ANALYSING THE WAVE SPECTRUM FOR THE PERSIAN GULF IN ...
ANALYSING THE WAVE SPECTRUM FOR THE PERSIAN GULF IN ...
ANALYSING THE WAVE SPECTRUM FOR THE PERSIAN GULF IN ...

Create successful ePaper yourself
Turn your PDF publications into a flip-book with our unique Google optimized e-Paper software.
صفحه 175<br />
چهاردهمين كنفرانس ژئوفيزيك ايران<br />
.<br />
.<br />
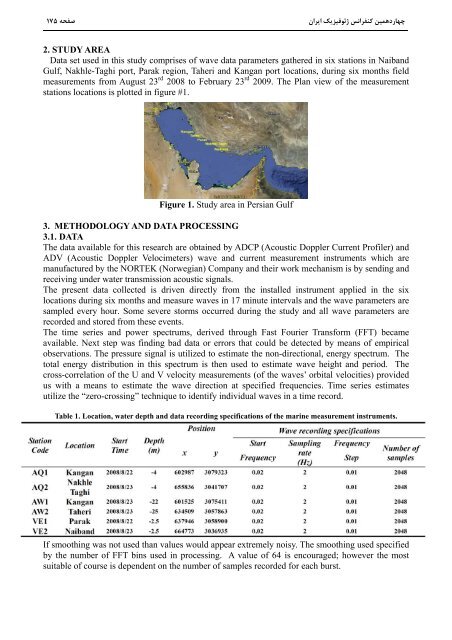
2. STUDY AREA<br />
Data set used in this study comprises of wave data parameters gathered in six stations in Naiband<br />
Gulf, Nakhle-Taghi port, Parak region, Taheri and Kangan port locations, during six months field<br />
measurements from August 23 rd 2008 to February 23 rd 2009. The Plan view of the measurement<br />
stations locations is plotted in figure #1.<br />
Figure 1. Study area in Persian Gulf<br />
3. METHODOLOGY AND DATA PROCESS<strong>IN</strong>G<br />
3.1. DATA<br />
The data available for this research are obtained by ADCP (Acoustic Doppler Current Profiler) and<br />
ADV (Acoustic Doppler Velocimeters) wave and current measurement instruments which are<br />
manufactured by the NORTEK (Norwegian) Company and their work mechanism is by sending and<br />
receiving under water transmission acoustic signals.<br />
The present data collected is driven directly from the installed instrument applied in the six<br />
locations during six months and measure waves in 17 minute intervals and the wave parameters are<br />
sampled every hour. Some severe storms occurred during the study and all wave parameters are<br />
recorded and stored from these events.<br />
The time series and power spectrums, derived through Fast Fourier Transform (FFT) became<br />
available. Next step was finding bad data or errors that could be detected by means of empirical<br />
observations. The pressure signal is utilized to estimate the non-directional, energy spectrum. The<br />
total energy distribution in this spectrum is then used to estimate wave height and period. The<br />
cross-correlation of the U and V velocity measurements (of the waves’ orbital velocities) provided<br />
us with a means to estimate the wave direction at specified frequencies. Time series estimates<br />
utilize the “zero-crossing” technique to identify individual waves in a time record.<br />
Table 1. Location, water depth and data recording specifications of the marine measurement instruments.<br />
If smoothing was not used than values would appear extremely noisy. The smoothing used specified<br />
by the number of FFT bins used in processing. A value of 64 is encouraged; however the most<br />
suitable of course is dependent on the number of samples recorded for each burst.