ANALYSING THE WAVE SPECTRUM FOR THE PERSIAN GULF IN ...
ANALYSING THE WAVE SPECTRUM FOR THE PERSIAN GULF IN ...
ANALYSING THE WAVE SPECTRUM FOR THE PERSIAN GULF IN ...

Create successful ePaper yourself
Turn your PDF publications into a flip-book with our unique Google optimized e-Paper software.
صفحه 176<br />
چهاردهمين كنفرانس ژئوفيزيك ايران<br />
.<br />
.<br />
3.2. DISTRIBUTION AND RANGES<br />
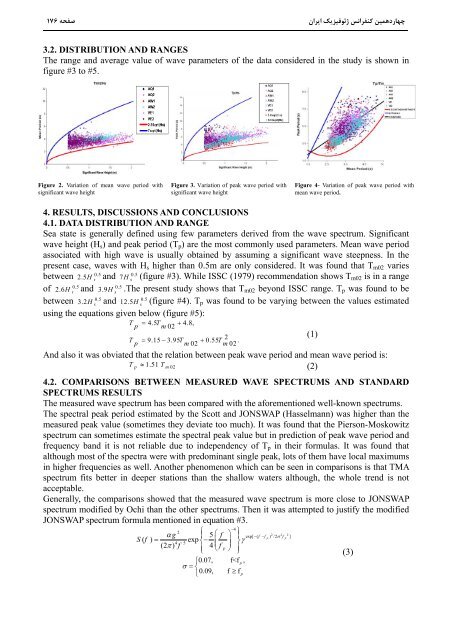
The range and average value of wave parameters of the data considered in the study is shown in<br />
figure #3 to #5.<br />
Figure 2. Variation of mean wave period with<br />
significant wave height<br />
Figure 3. Variation of peak wave period with<br />
significant wave height<br />
Figure 4- Variation of peak wave period with<br />
mean wave period.<br />
4. RESULTS, DISCUSSIONS AND CONCLUSIONS<br />
4.1. DATA DISTRIBUTION AND RANGE<br />
Sea state is generally defined using few parameters derived from the wave spectrum. Significant<br />
wave height (H s ) and peak period (T p ) are the most commonly used parameters. Mean wave period<br />
associated with high wave is usually obtained by assuming a significant wave steepness. In the<br />
present case, waves with H s higher than 0.5m are only considered. It was found that T m02 varies<br />
0.5<br />
0.5<br />
between 2.5H s<br />
and 7H<br />
s<br />
(figure #3). While ISSC (1979) recommendation shows T m02 is in a range<br />
0.5<br />
0.5<br />
of 2.6H s<br />
and 3.9H<br />
s<br />
.The present study shows that T m02 beyond ISSC range. T p was found to be<br />
0.5<br />
0.5<br />
between 3.2H s<br />
and 12.5H<br />
s<br />
(figure #4). T p was found to be varying between the values estimated<br />
using the equations given below (figure #5):<br />
T<br />
p<br />
4.5T<br />
m02<br />
4.8,<br />
T 9.15 3.95 0.55<br />
2<br />
p<br />
T<br />
m02 T<br />
m02<br />
.<br />
And also it was obviated that the relation between peak wave period and mean wave period is:<br />
T p 1.51 Tm<br />
02<br />
(2)<br />
4.2. COMPARISONS BETWEEN MEASURED <strong>WAVE</strong> <strong>SPECTRUM</strong>S AND STANDARD<br />
<strong>SPECTRUM</strong>S RESULTS<br />
The measured wave spectrum has been compared with the aforementioned well-known spectrums.<br />
The spectral peak period estimated by the Scott and JONSWAP (Hasselmann) was higher than the<br />
measured peak value (sometimes they deviate too much). It was found that the Pierson-Moskowitz<br />
spectrum can sometimes estimate the spectral peak value but in prediction of peak wave period and<br />
frequency band it is not reliable due to independency of T p in their formulas. It was found that<br />
although most of the spectra were with predominant single peak, lots of them have local maximums<br />
in higher frequencies as well. Another phenomenon which can be seen in comparisons is that TMA<br />
spectrum fits better in deeper stations than the shallow waters although, the whole trend is not<br />
acceptable.<br />
Generally, the comparisons showed that the measured wave spectrum is more close to JONSWAP<br />
spectrum modified by Ochi than the other spectrums. Then it was attempted to justify the modified<br />
JONSWAP spectrum formula mentioned in equation #3.<br />
4<br />
2<br />
g<br />
<br />
5 f<br />
<br />
<br />
S( f ) exp<br />
<br />
4 5 (2 ) f 4 <br />
<br />
f <br />
p<br />
<br />
0.07, f