2009 Leavers Destinations Report Batley Girls High School - Visual ...
2009 Leavers Destinations Report Batley Girls High School - Visual ...
2009 Leavers Destinations Report Batley Girls High School - Visual ...

Create successful ePaper yourself
Turn your PDF publications into a flip-book with our unique Google optimized e-Paper software.
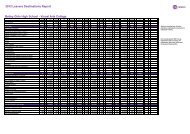
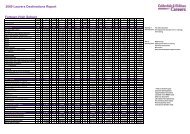
2007 <strong>Leavers</strong> <strong>Destinations</strong> in 08 and 09<br />
<strong>Batley</strong> <strong>Girls</strong> <strong>High</strong> <strong>School</strong><br />
2007 % 2008 % <strong>2009</strong> %<br />
Cohort total 181 180 180<br />
EET Total 161 88.95% 144 80.00% 142 78.89%<br />
Full Time Education 138 76.24% 104 57.78% 93 51.67%<br />
A Level 78 43.09% 74 41.11% 20 11.11%<br />
Vocational A Level / BTEC National 4 2.21% 12 6.67% 11 6.11%<br />
GNVQ Intermediate / BTEC First 41 22.65% 9 5.00% 7 3.89%<br />
GNVQ Foundation / BTEC Introductory 4 2.21% 1 0.56% 1 0.56%<br />
NVQ4 0 0.00% 0 0.00% 0 0.00%<br />
NVQ3 2 1.10% 4 2.22% 3 1.67%<br />
NVQ2 3 1.66% 0 0.00% 2 1.11%<br />
NVQ1 1 0.55% 2 1.11% 1 0.56%<br />
GCSE 2 1.10% 1 0.56% 0 0.00%<br />
Other courses 3 1.66% 0 0.00% 1 0.56%<br />
Continuation of 2 year course 0 0.00% 0 0.00% 0 0.00%<br />
P/T learning 0 0.00% 0 0.00% 0 0.00%<br />
<strong>High</strong>er Education 0 0.00% 1 0.56% 47 26.11%<br />
Employment 11 6.08% 20 11.11% 37 20.56%<br />
Apprenticeships 1 0.55% 1 0.56% 1 0.56%<br />
Employment with training to NVQ2 or above 1 0.55% 1 0.56% 3 1.67%<br />
Employment with locally recognised training 4 2.21% 0 0.00% 4 2.22%<br />
Employment no training 4 2.21% 17 9.44% 25 13.89%<br />
P/T employment 1 0.55% 1 0.56% 4 2.22%<br />
Training 12 6.63% 20 11.11% 12 6.67%<br />
Foundation app'ship (non-employed) 3 1.66% 11 6.11% 8 4.44%<br />
Other training / E2E / E2V (non-employed) 9 4.97% 9 5.00% 4 2.22%<br />
NEET Group 14 7.73% 30 16.67% 27 15.00%<br />
Seeking employment or training 11 6.08% 20 11.11% 13 7.22%<br />
Personal Development Opportunities 0 0.00% 0 0.00% 1 0.56%<br />
Not available to labour market 3 1.66% 10 5.56% 13 7.22%<br />
Young carers 1 0.55% 2 1.11% 2 1.11%<br />
Teenage parents 0 0.00% 1 0.56% 4 2.22%<br />
Illness 1 0.55% 3 1.67% 4 2.22%<br />
Pregnancy 0 0.00% 1 0.56% 1 0.56%<br />
Religious grounds 0 0.00% 2 1.11% 1 0.56%<br />
Unlikely to be economically active 0 0.00% 0 0.00% 0 0.00%<br />
Other reason 1 0.55% 1 0.56% 1 0.56%<br />
Other (not EET or NEET) 0 0.00% 0 0.00% 0 0.00%<br />
Custodial sentence 0 0.00% 0 0.00% 0 0.00%<br />
Asylum seekers 0 0.00% 0 0.00% 0 0.00%<br />
Current situation not known 6 3.31% 6 3.33% 11 6.11%<br />
Current situation not known 6 3.31% 6 3.33% 11 6.11%<br />
Refused to disclose activity 0 0.00% 0 0.00% 0 0.00%<br />
Staying in learning total 156 86.19% 126 70.00% 113 62.78%<br />
Not in learning total 25 13.81% 54 30.00% 67 37.22%<br />
Staying in learning total:<br />
Not in learning total:<br />
Full time education<br />
All employment (except with no training)<br />
All Training<br />
NEET Group<br />
Employment with no training<br />
Part time employment<br />
Not known<br />
Personal Development Opportunities