Batley Girls High School - Visual Arts College
Batley Girls High School - Visual Arts College
Batley Girls High School - Visual Arts College

Create successful ePaper yourself
Turn your PDF publications into a flip-book with our unique Google optimized e-Paper software.
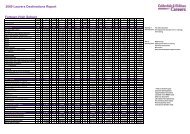
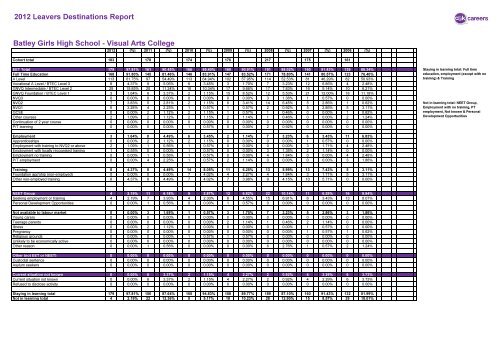
2012 Leavers Destinations Report<strong>Batley</strong> <strong>Girls</strong> <strong>High</strong> <strong>School</strong> - <strong>Visual</strong> <strong>Arts</strong> <strong>College</strong>2012 (%) 2011 (%) 2010 (%) 2009 (%) 2008 (%) 2007 (%) 2006 (%)Cohort total 183 178 174 176 217 175 161EET Total 179 97.81% 161 90.45% 166 95.40% 160 90.91% 191 88.02% 160 91.43% 139 86.34%Full Time Education 168 91.80% 145 81.46% 146 83.91% 147 83.52% 171 78.80% 141 80.57% 123 76.40%A Level 113 61.75% 97 54.49% 113 64.94% 102 57.95% 114 52.53% 81 46.29% 82 50.93%Vocational A Level / BTEC Level 3 8 4.37% 9 5.06% 6 3.45% 3 1.70% 7 3.23% 12 6.86% 4 2.48%GNVQ Intermediate / BTEC Level 2 29 15.85% 20 11.24% 18 10.34% 17 9.66% 17 7.83% 16 9.14% 10 6.21%GNVQ Foundation / BTEC Level 1 3 1.64% 6 3.37% 2 1.15% 15 8.52% 12 5.53% 21 12.00% 18 11.18%NVQ3 0 0.00% 0 0.00% 0 0.00% 0 0.00% 3 1.38% 1 0.57% 0 0.00%NVQ2 7 3.83% 5 2.81% 2 1.15% 6 3.41% 14 6.45% 5 2.86% 1 0.62%NVQ1 6 3.28% 4 2.25% 1 0.57% 1 0.57% 2 0.92% 5 2.86% 5 3.11%GCSE 0 0.00% 2 1.12% 2 1.15% 1 0.57% 1 0.46% 0 0.00% 1 0.62%Other courses 2 1.09% 2 1.12% 2 1.15% 2 1.14% 1 0.46% 0 0.00% 2 1.24%Continuation of 2 year course 0 0.00% 0 0.00% 0 0.00% 0 0.00% 0 0.00% 0 0.00% 0 0.00%P/T learning 0 0.00% 0 0.00% 1 0.57% 0 0.00% 2 0.92% 0 0.00% 0 0.00%Staying in learning total: Full timeeducation, employment (except with notraining) & TrainingNot in learning total: NEET Group,Employment with no training, PTemployment, Not known & PersonalDevelopment OpportunitiesEmployment 3 1.64% 8 4.49% 6 3.45% 2 1.14% 7 3.23% 6 3.43% 11 6.83%Apprenticeships 0 0.00% 2 1.12% 2 1.15% 0 0.00% 0 0.00% 1 0.57% 0 0.00%Employment with training to NVQ2 or above 2 1.09% 1 0.56% 1 0.57% 0 0.00% 0 0.00% 3 1.71% 4 2.48%Employment with locally recognised training 1 0.55% 0 0.00% 1 0.57% 0 0.00% 3 1.38% 2 1.14% 0 0.00%Employment no training 0 0.00% 1 0.56% 1 0.57% 0 0.00% 4 1.84% 0 0.00% 4 2.48%P/T employment 0 0.00% 4 2.25% 1 0.57% 2 1.14% 0 0.00% 0 0.00% 3 1.86%Training 8 4.37% 8 4.49% 14 8.05% 11 6.25% 13 5.99% 13 7.43% 5 3.11%Foundation app'ship (non-employed) 0 0.00% 0 0.00% 7 4.02% 4 2.27% 4 1.84% 3 1.71% 5 3.11%Other non-employed training 8 4.37% 8 4.49% 7 4.02% 7 3.98% 9 4.15% 10 5.71% 0 0.00%NEET Group 4 2.19% 11 6.18% 5 2.87% 12 6.82% 22 10.14% 11 6.29% 16 9.94%Seeking employment or training 4 2.19% 7 3.93% 4 2.30% 8 4.55% 15 6.91% 6 3.43% 13 8.07%Personal Development Opportunities 0 0.00% 1 0.56% 0 0.00% 1 0.57% 0 0.00% 0 0.00% 0 0.00%Not available to labour market 0 0.00% 3 1.69% 1 0.57% 3 1.70% 7 3.23% 5 2.86% 3 1.86%Young carers 0 0.00% 0 0.00% 0 0.00% 0 0.00% 0 0.00% 0 0.00% 0 0.00%Teenage parents 0 0.00% 0 0.00% 0 0.00% 2 1.14% 1 0.46% 2 1.14% 0 0.00%Illness 0 0.00% 2 1.12% 0 0.00% 0 0.00% 0 0.00% 1 0.57% 0 0.00%Pregnancy 0 0.00% 0 0.00% 0 0.00% 0 0.00% 0 0.00% 1 0.57% 1 0.62%Religious grounds 0 0.00% 0 0.00% 1 0.57% 1 0.57% 0 0.00% 0 0.00% 0 0.00%Unlikely to be economically active 0 0.00% 0 0.00% 0 0.00% 0 0.00% 0 0.00% 0 0.00% 0 0.00%Other reason 0 0.00% 1 0.56% 0 0.00% 0 0.00% 6 2.76% 1 0.57% 2 1.24%Other (not EET or NEET) 0 0.00% 0 0.00% 0 0.00% 0 0.00% 0 0.00% 0 0.00% 0 0.00%Custodial sentence 0 0.00% 0 0.00% 0 0.00% 0 0.00% 0 0.00% 0 0.00% 0 0.00%Asylum seekers 0 0.00% 0 0.00% 0 0.00% 0 0.00% 0 0.00% 0 0.00% 0 0.00%Current situation not known 0 0.00% 6 3.37% 2 1.15% 4 2.27% 2 0.92% 4 2.29% 6 3.73%Current situation not known 0 0.00% 6 3.37% 2 1.15% 4 2.27% 2 0.92% 4 2.29% 6 3.73%Refused to disclose activity 0 0.00% 0 0.00% 0 0.00% 0 0.00% 0 0.00% 0 0.00% 0 0.00%Staying in learning total 179 97.81% 156 87.64% 165 94.83% 158 89.77% 189 87.10% 160 91.43% 132 81.99%Not in learning total 4 2.19% 22 12.36% 9 5.17% 18 10.23% 28 12.90% 15 8.57% 29 18.01%
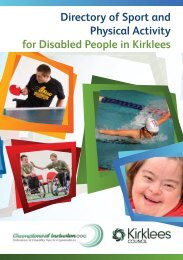
2012 Leavers Destinations By Ethnicity<strong>Batley</strong> <strong>Girls</strong> <strong>High</strong> <strong>School</strong> - <strong>Visual</strong> <strong>Arts</strong> <strong>College</strong>Y11 <strong>School</strong><strong>Batley</strong> <strong>Girls</strong> <strong>High</strong> <strong>School</strong> - <strong>Visual</strong> <strong>Arts</strong> <strong>College</strong>descriptionA Level 2 53 2 4 1 1 40 1 9 113Active in the labour market 0 1 0 0 0 0 3 0 0 4BTEC Level 1 0 0 0 0 0 0 1 0 2 3BTEC Level 2 0 4 1 0 0 0 20 1 3 29NVQ Level 1 0 0 0 1 0 0 3 0 2 6NVQ Level 2 0 1 1 1 0 0 2 0 2 7Other employment with locally recognised good quality training 0 0 0 0 0 0 1 0 0 1Other employment with planned off the job training leading to NVQ2 or equivalent 0 0 0 0 0 0 1 0 1 2Other LSC delivered training (eg. E2E, Lifeskills, etc) 0 1 0 0 0 0 4 0 0 5OtherGovt Supported training 0 0 0 0 0 0 3 0 0 3Pre NVQ Levl 1 0 0 0 1 0 0 1 0 0 2BTEC Level 3 0 3 0 0 0 0 2 0 3 8Grand Total 2 63 4 7 1 1 81 2 22 183BangladeshiIndianNo informationOtherOther Asian backgroundOther mixed backgroundPakistaniWhite and AsianWhite BritishGrand Total
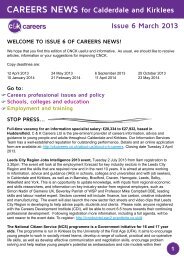
2012 Leavers In Education DestinationsBy Organisation<strong>Batley</strong> <strong>Girls</strong> <strong>High</strong> <strong>School</strong> - <strong>Visual</strong> <strong>Arts</strong> <strong>College</strong>Y11 <strong>School</strong><strong>Batley</strong> <strong>Girls</strong> <strong>High</strong> <strong>School</strong> - <strong>Visual</strong> <strong>Arts</strong> <strong>College</strong>EducationOrganisation0 0 0 0 1 0 0 1<strong>Batley</strong> <strong>Girls</strong> <strong>High</strong> <strong>School</strong> - <strong>Visual</strong> <strong>Arts</strong> <strong>College</strong> 77 0 0 0 0 17 0 94<strong>Batley</strong> Grammar <strong>School</strong> 7 0 0 0 0 0 0 7Bradford <strong>College</strong> 0 0 1 0 0 0 0 1Dixons City Academy 1 0 0 0 0 0 0 1Greenhead <strong>College</strong> 2 0 0 0 0 0 0 2Heckmondwike Grammar <strong>School</strong> 18 0 0 0 0 0 0 18Huddersfield New <strong>College</strong> 1 0 0 0 0 0 0 1Kirklees <strong>College</strong> Dewsbury Centre 0 5 6 2 1 3 3 20Kirklees <strong>College</strong> Huddersfield Centre 0 1 0 0 1 6 2 10Leeds City <strong>College</strong> 1 0 0 0 0 2 1 4Rastrick <strong>High</strong> <strong>School</strong> 1 0 0 0 0 0 0 1The Mirfield Free Grammar & Sixth Form 3 0 0 0 0 1 0 4Wakefield <strong>College</strong> 1 0 0 0 0 0 2 3Morley <strong>High</strong> <strong>School</strong> 1 0 0 0 0 0 0 1Grand Total 113 6 7 2 3 29 8 168A LevelNVQ Level 1NVQ Level 2Pre NVQ Levl 1BTEC Level 1BTEC Level 2BTEC Level 3Grand Total