The application of the q tunnelling quality index - Geohart Consultants
The application of the q tunnelling quality index - Geohart Consultants
The application of the q tunnelling quality index - Geohart Consultants

Create successful ePaper yourself
Turn your PDF publications into a flip-book with our unique Google optimized e-Paper software.
THE APPLICATION OF THE Q TUNNELLING QUALITY INDEX TO<br />
ROCK MASS ASSESSSMENT AT IMPALA PLATINUM MINE<br />
BY<br />
W. HARTMAN*<br />
AND<br />
M.F.HANDLEY †<br />
October 2001<br />
*Senior Rock Mechanics Engineer, Douglas Partners, 96 Hermitage Road, West<br />
Ryde, New South Wales 2114, Australia (formerly Senior Rock Engineering Officer<br />
Projects, Impala Platinum Limited) e-mail: wouterhartman@aol.com<br />
† Associate Pr<strong>of</strong>essor <strong>of</strong> Rock Mechanics, Department <strong>of</strong> Mining Engineering,<br />
University <strong>of</strong> Pretoria, Pretoria 0002. Tel.: 012-420-3181, Fax: 012-362-5304, e-mail:<br />
mhandley@postino.up.ac.za
SYNOPSIS<br />
Publications on hard rock tunnel support design in <strong>the</strong> South African mining industry<br />
have originated primarily from <strong>the</strong> gold mines during <strong>the</strong> last 50 years. Little has been<br />
published to date on <strong>the</strong> platinum and chrome mines <strong>of</strong> <strong>the</strong> Bushveld Complex. This<br />
paper covers <strong>the</strong> search for a suitable design methodology for <strong>of</strong>f-reef tunnels at<br />
Impala Platinum Mine, situated on <strong>the</strong> Western Lobe <strong>of</strong> <strong>the</strong> Bushveld Complex. <strong>The</strong><br />
fall <strong>of</strong> ground accident statistics for <strong>of</strong>f-reef excavations <strong>of</strong> <strong>the</strong> mine are presented and<br />
<strong>the</strong> available rock mass <strong>quality</strong> evaluation systems are reviewed. <strong>The</strong> Q Tunnelling<br />
Quality Index (or Q-Index) is selected because it assesses <strong>the</strong> important driving factors<br />
behind falls <strong>of</strong> ground at Impala. Two <strong>of</strong>f-reef excavations are evaluated using <strong>the</strong> Q-<br />
Index, and it is shown that minor modifications are required for implementation at<br />
Impala. It will take some time before support design throughout <strong>the</strong> mine is based on<br />
<strong>the</strong> outcome <strong>of</strong> proper geotechnical investigations based on <strong>the</strong> Q-Index. Widespread<br />
implementation <strong>of</strong> such support designs should help to solve <strong>the</strong> fall <strong>of</strong> ground<br />
problem in <strong>of</strong>f-reef excavations while at <strong>the</strong> same time reducing support costs.<br />
2
1 INTRODUCTION<br />
<strong>The</strong> current mining industry regulations and guidelines for South Africa call for<br />
systematic underground support that is capable <strong>of</strong> resisting 95% <strong>of</strong> all potential falls<br />
<strong>of</strong> ground as determined by statistical analysis. Data obtained from all fall <strong>of</strong> ground<br />
injuries at Impala Platinum Mine for <strong>the</strong> last 12 years show that most falls occurred on<br />
<strong>the</strong> reef horizon, with a smaller proportion in <strong>of</strong>f-reef excavations. A proper<br />
engineering approach to support design is already in place for stoping, but support in<br />
<strong>of</strong>f-reef excavations is still designed using <strong>the</strong> 33 kN/m 2 -support resistance criterion<br />
without a prior geotechnical investigation. This practice suffers from <strong>the</strong> disadvantage<br />
that geotechnical conditions, which affect <strong>the</strong> potential for rockfalls, are ignored.<br />
Hence, some <strong>of</strong>f-reef excavations are likely to be over-supported while o<strong>the</strong>rs are<br />
under-supported.<br />
<strong>Consultants</strong> to <strong>the</strong> mine suggested several rockmass classification systems to take<br />
account <strong>of</strong> geotechnical conditions in support design, but it soon became apparent that<br />
every available rockmass classification system has its origins in an <strong>application</strong> to a<br />
specific problem, <strong>the</strong>refore limiting its generality, and potential applicability on <strong>the</strong><br />
mine. It became apparent during this period that in order to ensure safe and costeffective<br />
support in <strong>of</strong>f-reef excavations at Impala Platinum, a suitable rockmass<br />
classification system would have to be found.<br />
This paper describes <strong>the</strong> approach used to select and implement <strong>the</strong> Q-Tunnelling<br />
Quality Index 1<br />
(or Q-Index) in <strong>the</strong> <strong>of</strong>f-reef excavation support design process at<br />
Impala Platinum. First, an accident analysis is presented in which <strong>the</strong> nature <strong>of</strong> <strong>the</strong><br />
3
fall <strong>of</strong> ground problem in <strong>of</strong>f-reef development is defined. <strong>The</strong>n, currently available<br />
rockmass evaluation systems are described to highlighting <strong>the</strong> strengths and<br />
weaknesses <strong>of</strong> each. This forms <strong>the</strong> background to <strong>the</strong> choice <strong>of</strong> <strong>the</strong> Q-Index, and<br />
provides a clear indication why it is suitable for Impala. To confirm its applicability,<br />
<strong>the</strong> Q-Index is applied to two tunnels in different geotechnical conditions. <strong>The</strong> first<br />
case study covers a tunnel, which has stood virtually unsupported in a very good<br />
<strong>quality</strong> rockmass for twenty years, while <strong>the</strong> second covers an incline shaft presently<br />
being developed in a fair to poor <strong>quality</strong> rockmass. <strong>The</strong> methodology developed to<br />
assess <strong>the</strong>se tunnels is described and <strong>the</strong> support designs appropriate for <strong>the</strong>se tunnels<br />
is presented.<br />
<strong>The</strong> case studies show that <strong>the</strong> Q Tunnelling Quality Index predicts larger stable<br />
unsupported spans than those observed by experience on <strong>the</strong> mine. <strong>The</strong> results were<br />
used to adjust <strong>the</strong> relationship between <strong>the</strong> equivalent dimension D e and <strong>the</strong> rock mass<br />
<strong>quality</strong> <strong>index</strong> Q (Barton et al. 1 ). Although all rock mass classification systems strive<br />
for simplicity while at <strong>the</strong> same time addressing <strong>the</strong> complexity and diversity <strong>of</strong><br />
natural rock masses, <strong>the</strong> adjustment to <strong>the</strong> Q-Index for Impala suggests that a general<br />
system applicable to all situations still does not exist. It appears from this study and<br />
<strong>the</strong> experience <strong>of</strong> o<strong>the</strong>rs, for example Laubscher and Jakubec 2 , that all rock mass<br />
classification schemes need some adjustment to suit local site conditions, and that <strong>the</strong><br />
user should apply proper engineering judgment when doing so. A simple and reliable<br />
rockmass evaluation system based on <strong>the</strong> Q Tunnelling Quality Index toge<strong>the</strong>r with a<br />
support design procedure for <strong>of</strong>f-reef development is now in place on Impala Platinum<br />
Mine.<br />
4
2 MINE LOCATION AND GEOLOGICAL SETTING<br />
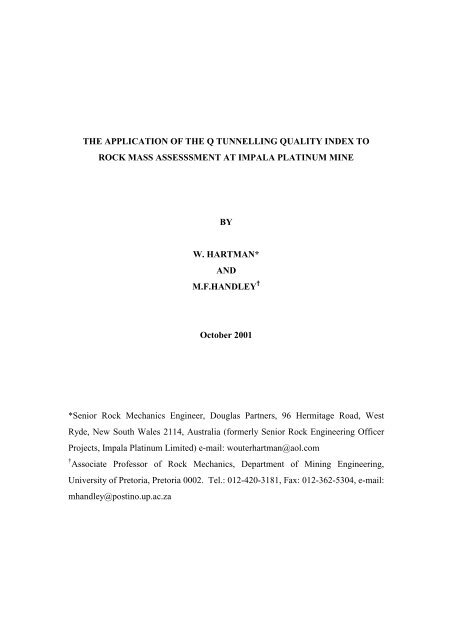
Impala Platinum Mine is situated 23km north <strong>of</strong> Rustenburg on <strong>the</strong> western edge <strong>of</strong><br />
<strong>the</strong> western lobe <strong>of</strong> <strong>the</strong> Bushveld Complex. <strong>The</strong> mining area extends approximately<br />
25 km from <strong>the</strong> south to <strong>the</strong> north (see Figure 1). <strong>The</strong> mine exploits <strong>the</strong> Merensky<br />
Reef and <strong>the</strong> UG2 Reef for platinum group metals and several o<strong>the</strong>r by-products.<br />
Figure 1: Location <strong>of</strong> Impala Platinum Mine<br />
<strong>The</strong> Bushveld Complex is a layered igneous intrusion consisting <strong>of</strong> mafic rocks such<br />
as chromitite, pyroxenite, norite, gabbro, gabbronorite, harzburgite, and anorthosite in<br />
<strong>the</strong> Lower, Critical, and Main zones 3 . <strong>The</strong> Upper Zone, which forms <strong>the</strong> cap <strong>of</strong> <strong>the</strong><br />
layered intrusion, consists <strong>of</strong> gabbro, anorthosite, and gabbronorite towards its base,<br />
with diorites at <strong>the</strong> top. <strong>The</strong> various Bushveld Granites succeeded <strong>the</strong>se mafic<br />
intrusions. <strong>The</strong>re are seven overlapping mafic intrusions, which are shaped like<br />
5
inverted cones spreading out laterally toward <strong>the</strong> surface. Each can be likened to an<br />
inverted wine glass. <strong>The</strong> layers around <strong>the</strong> edge <strong>of</strong> each intrusion (equivalent to <strong>the</strong><br />
wine glass base) dip towards <strong>the</strong> centre at an average <strong>of</strong> 9 to 10 degrees. <strong>The</strong> dip<br />
increases towards <strong>the</strong> centre where <strong>the</strong> vertical feeder is situated. <strong>The</strong> Bushveld<br />
Complex is large, stretching 370 km east west across North West Province, nor<strong>the</strong>rn<br />
Gauteng, and Mpumalanga.<br />
Table I: Generalised Geological Succession for Impala Platinum Mine with<br />
Average Unit Thickness, Unit Names and Rock Types<br />
Average Thickness (m) Unit Rock Type<br />
34 HW5 Mottled and spotted Anorthosite<br />
3-6 HW4 Spotted Anorthosite<br />
5-7 HW3 Mottled Anorthosite<br />
1.5-3 HW2 Spotted Anorthositic Norite<br />
2-6 HW1 Norite<br />
2-3 Bastard Pyroxenite Pyroxenite, Coarse Grained<br />
2-3 M3 Mottled Anorthosite<br />
3-7 M2 Spotted Anorthositic Norite<br />
0.5 M1 Norite<br />
1-1.5 Merensky Pyroxenite Medium to Coarse grain Pyroxenite<br />
0-2 Merensky Reef Chromitite Layer – Pegmatoid<br />
0.4 FW1 Spotted Anorthositic Norite<br />
0.2 FW2 Cyclic Unit – Pyroxenite<br />
3-5 FW3 Spotted Anorthositic Norite<br />
0.1-0.3 FW4 Mottled Anorthosite<br />
1-3 FW5 Spotted Anorthositic Norite<br />
1-3 FW6 Cyclic Unit - Spotted and Mottled Anorthosite<br />
1-3 FW7 Spotted Anorthositic Norite<br />
0.8-1.2 FW8 Spotted Anorthosite<br />
3-6 FW9 Mottled Anorthosite<br />
3-5 FW10 Spotted Anorthositic Norite<br />
12-15 FW11 Spotted Anorthosite<br />
10-12 FW12 Mottled Anorthosite<br />
5-7 UG2 Pyroxenite with Leader Chromitite Stringers<br />
0,7 UG2 Reef Chromitite<br />
10-12 FW UG2 Pegmatoid<br />
5-7 FW13 Spotted Anorthositic Norite<br />
6-8 FW14 Pyroxenite<br />
1-3 UG1 (FW15) Chromitite with anorthosite and pyroxenite lenses<br />
>100 FW16 Anorthosite with chrome stringers<br />
6
<strong>The</strong> most important platinum group element carriers in <strong>the</strong> Bushveld Complex are <strong>the</strong><br />
Merensky Reef and <strong>the</strong> UG2 Reef, which occur parallel to <strong>the</strong> major layering as<br />
distinct layers usually less than 2 metres thick. <strong>The</strong> Merensky Reef lies at <strong>the</strong> base <strong>of</strong><br />
<strong>the</strong> Main Zone, and consists <strong>of</strong> pyroxenite and pegmatoid units, while <strong>the</strong> UG2<br />
Chromitite Seam is located between 20 to 300 metres below <strong>the</strong> Merensky Reef in <strong>the</strong><br />
Critical Zone. Both carry economic concentrations <strong>of</strong> <strong>the</strong> platinum group elements,<br />
namely platinum, palladium, ru<strong>the</strong>nium, rhodium, iridium, and osmium as well as <strong>the</strong><br />
base metals nickel, copper and cobalt, and finally gold, in minor concentrations. At<br />
Impala, <strong>the</strong> vertical separation between <strong>the</strong> two reefs increases from 60 metres in <strong>the</strong><br />
north to 130 metres in <strong>the</strong> south. <strong>The</strong> general strike <strong>of</strong> both orebodies is northnorthwest<br />
to south-sou<strong>the</strong>ast, dipping gently towards <strong>the</strong> east at about 10 degrees.<br />
Both reefs outcrop at surface along <strong>the</strong> western boundary <strong>of</strong> <strong>the</strong> Impala lease 4 . <strong>The</strong><br />
geological succession for <strong>the</strong> Impala Platinum Mine is summarised in Table I.<br />
3 THE PROBLEM<br />
<strong>The</strong> <strong>of</strong>f-reef development at Impala Mine is placed in <strong>the</strong> footwall <strong>of</strong> <strong>the</strong> Merensky<br />
and UG2 reefs, in rock masses that vary in <strong>quality</strong> from very poor to extremely good.<br />
Until recently, all support designs were based upon <strong>the</strong> 33 kN/m 2 resistance criterion<br />
that was applied universally without regard to <strong>the</strong> rock mass <strong>quality</strong>. This criterion<br />
had been determined from <strong>the</strong> 95 th percentile on a cumulative fall <strong>of</strong> ground thickness<br />
curve based on fall <strong>of</strong> ground statistics on <strong>the</strong> mine.<br />
Universal use <strong>of</strong> a single criterion such as this means that some excavations may be<br />
under-supported while o<strong>the</strong>rs are over-supported. In addition to this, fall <strong>of</strong> ground<br />
7
accidents continue to occur in <strong>of</strong>f-reef development. It is <strong>the</strong>refore clear that a more<br />
scientific approach based on well-established rock engineering principles is necessary.<br />
First, an analysis <strong>of</strong> fall <strong>of</strong> ground accidents at Impala is presented, followed by an<br />
assessment <strong>of</strong> different rockmass evaluation schemes. This forms <strong>the</strong> background to<br />
<strong>the</strong> choice <strong>of</strong> <strong>the</strong> Q-Index, which is <strong>the</strong>n applied to mine conditions in an underground<br />
study described in Section 4.2.<br />
3.1 Fall <strong>of</strong> Ground Analysis<br />
<strong>The</strong> fall <strong>of</strong> ground data used in <strong>the</strong> analysis covers a five-year period from 1992 to<br />
1996, to ensure statistically meaningful results from a sufficiently large database. <strong>The</strong><br />
data has been strictly limited to falls <strong>of</strong> ground in <strong>of</strong>f-reef development to remove any<br />
bias that may arise if in-stope data were included. <strong>The</strong> following information was<br />
extracted from <strong>the</strong> accident reports for <strong>the</strong> analysis:<br />
reef type<br />
stope or <strong>of</strong>f-reef development<br />
depth below surface<br />
distance from face<br />
excavation size<br />
origin <strong>of</strong> <strong>the</strong> fall <strong>of</strong> ground: face, hangingwall, sidewall, or footwall<br />
mechanism <strong>of</strong> fall <strong>of</strong> ground: buckling, shear, or dead weight<br />
size <strong>of</strong> fall <strong>of</strong> ground: small, medium, or large<br />
shape <strong>of</strong> fall block: dome, wedge, or scaling<br />
dimensions <strong>of</strong> fall <strong>of</strong> ground: height, width, length, area, volume, and weight<br />
rock type<br />
proximity <strong>of</strong> major geological features: faults, dykes, potholes or joints<br />
8
oundaries <strong>of</strong> <strong>the</strong> fall <strong>of</strong> ground: joints, faults, dykes, or partings between<br />
layers such as a chromitite seam<br />
<strong>The</strong> database has been visualised by preparing a number <strong>of</strong> cumulative frequency plots<br />
and pie charts, which appear in Figures 2 to 5 (Appendix I) and Figures 6 to 10<br />
respectively (Appendix I). <strong>The</strong> 95 th percentile dimensions, obtained from Figures 2 to<br />
5 have been collected into Table II for easy reference.<br />
Table II: List <strong>of</strong> 95 th Percentile Variables for Falls <strong>of</strong> Ground in Off-reef Tunnels<br />
95 th Percentile Variable Dimension<br />
Thickness (m) 0.9<br />
Area (m 2 ) 9.0<br />
Width (m) 2.5<br />
Length (m) 3.5<br />
Volume (derived from above variables, m 3 ) 8.0<br />
Mass (derived from above variables, tons) 25.0<br />
<strong>The</strong> pie charts demonstrate aspects <strong>of</strong> falls <strong>of</strong> ground in <strong>of</strong>f-reef tunnels e.g. location,<br />
shape, origin, rock type and boundaries that cannot be represented in cumulative<br />
frequency plots. <strong>The</strong>se show that <strong>the</strong> majority <strong>of</strong> falls <strong>of</strong> ground are joint-bounded<br />
blocks originating in <strong>the</strong> hangingwall <strong>of</strong> <strong>the</strong> excavation. None <strong>of</strong> <strong>the</strong> statistics<br />
presented above suggest an insoluble problem.<br />
Instead, <strong>the</strong>y suggest that<br />
appropriately designed local support would have been sufficient to prevent every<br />
occurrence listed.<br />
9
3.2 Description <strong>of</strong> Rockmass Classification Schemes<br />
A number <strong>of</strong> rockmass classification schemes have been applied in <strong>the</strong> field, and as<br />
far as is known, none <strong>of</strong> <strong>the</strong> authors have claimed that <strong>the</strong>ir classification can be<br />
applied generally. This survey shows that most classifications were designed to<br />
address a specific set <strong>of</strong> problems, <strong>the</strong>reby limiting <strong>the</strong>ir range <strong>of</strong> applicability.<br />
3.2.1 Terzaghi’s rock mass classification<br />
Terzaghi's 5 rock mass classification is applied to <strong>the</strong> design <strong>of</strong> tunnel support in which<br />
rock loads, carried by steel sets, are estimated on <strong>the</strong> basis <strong>of</strong> a descriptive<br />
classification. <strong>The</strong> scheme classifies rock as intact, stratified, moderately jointed,<br />
blocky and seamy, crushed (but chemically intact), squeezing and swelling. Where<br />
one or more <strong>of</strong> <strong>the</strong>se characteristics dominate, Terzaghi proposed a particular steel set<br />
design. His classification scheme was applied to railroad tunnels in <strong>the</strong> Alps, and has<br />
been widely used in North America ever since <strong>the</strong> paper was published. It is generally<br />
not applicable to hard rock mines because steel sets are expensive and seldom used,<br />
but could still be applied to shallow workings in wea<strong>the</strong>red rock where in-situ stress is<br />
not important.<br />
3.2.2 Rock Quality Designation (RQD)<br />
Deere 6 developed <strong>the</strong> RQD <strong>index</strong> to provide a quantitative estimate <strong>of</strong> rockmass<br />
<strong>quality</strong> from drill core logs. <strong>The</strong> RQD is defined as <strong>the</strong> sum <strong>of</strong> <strong>the</strong> lengths <strong>of</strong> intact<br />
core pieces longer than 100mm expressed as a percentage <strong>of</strong> <strong>the</strong> total length <strong>of</strong> core.<br />
<strong>The</strong> core should be at least 50mm in diameter and should be drilled with double barrel<br />
diamond drilling equipment. <strong>The</strong> RQD can be misleading in rockmasses where<br />
discontinuities in <strong>the</strong> rock are widely spaced and contain ei<strong>the</strong>r infilling or wea<strong>the</strong>red<br />
10
material 7 . Such a situation may result in a blocky, unstable rockmass, despite a high<br />
measured RQD. <strong>The</strong> RQD is thus unsuitable as a rockmass evaluator on its own, but<br />
has proven to be valuable as a component <strong>of</strong> more sophisticated rockmass rating<br />
schemes (see Sections 3.2.4. and 3.2.9).<br />
3.2.3 Rock Structure Rating (RSR)<br />
<strong>The</strong> RSR 8<br />
is a quantitative method for describing <strong>the</strong> <strong>quality</strong> <strong>of</strong> a rock mass and for<br />
selecting appropriate support based on <strong>the</strong> classification. Most <strong>of</strong> <strong>the</strong> case histories,<br />
used in <strong>the</strong> development <strong>of</strong> this classification, were for relatively small, shallow<br />
tunnels supported by means <strong>of</strong> steel sets. <strong>The</strong> RSR was <strong>the</strong> first to refer to shotcrete<br />
as a means <strong>of</strong> support. It is unsuitable for hard rock mines because it confines itself to<br />
shallow tunnels and steel sets or shotcrete support.<br />
3.2.4 Stini and Lauffer classifications<br />
Stini 9 proposed a rock mass classification for tunnels and discussed many <strong>of</strong> <strong>the</strong><br />
adverse conditions, which can be encountered in tunneling. <strong>The</strong> original work is in<br />
German; <strong>the</strong>refore, it attracted little attention in <strong>the</strong> English-speaking world 10 . He<br />
emphasized <strong>the</strong> importance <strong>of</strong> structural defects in <strong>the</strong> rock mass and stressed <strong>the</strong> need<br />
to avoid <strong>tunnelling</strong> parallel to <strong>the</strong> strike <strong>of</strong> steeply dipping discontinuities. While both<br />
Terzaghi and Stini had discussed time-dependent instability in tunnels, it was<br />
Lauffer 11 who proposed that <strong>the</strong> stand-up time for an unsupported span is related to<br />
<strong>the</strong> <strong>quality</strong> <strong>of</strong> <strong>the</strong> rock mass in which <strong>the</strong> span is excavated.<br />
In a tunnel, <strong>the</strong> unsupported span is defined as <strong>the</strong> span <strong>of</strong> <strong>the</strong> tunnel or <strong>the</strong> distance<br />
between <strong>the</strong> face and <strong>the</strong> nearest support, if this is greater than <strong>the</strong> tunnel span. <strong>The</strong><br />
significance <strong>of</strong> <strong>the</strong> stand-up time concept is that an increase in <strong>the</strong> span <strong>of</strong> <strong>the</strong> tunnel<br />
11
leads to a significant reduction in <strong>the</strong> stand-up time, i.e. <strong>the</strong> time available for <strong>the</strong><br />
installation <strong>of</strong> support. Knowledge <strong>of</strong> stand-up time is useful in designing miningsupport<br />
cycles for advancing tunnels, but provides no guide to a permanent support<br />
system. This classification may suffice as a part <strong>of</strong> a support design process for an<br />
underground mine, but would require fur<strong>the</strong>r development for it to be universally<br />
applicable.<br />
3.2.5 Checklist methodology for hazard identification in tunnels<br />
<strong>The</strong> checklist approach was developed to assess <strong>the</strong> risk <strong>of</strong> falls <strong>of</strong> ground in a mine<br />
tunnel 12 . <strong>The</strong> hazard identification takes place in two phases: <strong>the</strong> user answers a series<br />
<strong>of</strong> questions which pertain to a given hazard or group <strong>of</strong> hazards and <strong>the</strong>n, a ranking<br />
method is used to determine scores for each answer, <strong>the</strong>reby generating an overall<br />
hazard score with which to assess <strong>the</strong> relative importance <strong>of</strong> <strong>the</strong> hazard 12 . <strong>The</strong><br />
disadvantage <strong>of</strong> this system is that <strong>the</strong> user tends to focus only on <strong>the</strong> points addressed<br />
by <strong>the</strong> questions, and if <strong>the</strong>y do not highlight a particular hazard, it is likely to remain<br />
unnoticed. This method does not propose any support for a given hazard, but acts<br />
merely to alert <strong>the</strong> rock engineering practitioner to a certain group <strong>of</strong> hazards it is<br />
designed to identify. It is <strong>the</strong>refore unsuitable as a basis for objective support designs<br />
in mine tunnels.<br />
3.2.6 Rockwall Condition Factor<br />
<strong>The</strong> first classification scheme to be designed for use in deep level mine tunnels is that<br />
<strong>of</strong> Wiseman 13 , who proposed evaluating <strong>the</strong> conditions <strong>of</strong> tunnels using in situ stress,<br />
and <strong>the</strong> uniaxial compressive strength <strong>of</strong> intact rock. Ryder 14 added <strong>the</strong> empirical rock<br />
condition factor F to Wiseman’s 13 equation, and coined <strong>the</strong> name Rockwall Condition<br />
Factor (RCF) in 1987. <strong>The</strong> best available description <strong>of</strong> <strong>the</strong> RCF may be found in<br />
12
COMRO 14 , pages 88 and 89. <strong>The</strong> formulation <strong>of</strong> <strong>the</strong> RCF is based on a simple<br />
comparison <strong>of</strong> <strong>the</strong> maximum induced tangential stress <strong>of</strong> an assumed circular<br />
excavation to <strong>the</strong> estimated rockmass strength. It is given by:<br />
3σ1−<br />
σ3<br />
RCF =<br />
Fσ<br />
c<br />
(1)<br />
In equation (1), <strong>the</strong> major and minor principal stresses within <strong>the</strong> plane <strong>of</strong> <strong>the</strong> tunnel<br />
cross-section are σ 1 and σ 3 respectively, F is Ryder’s 14 dimensionless empirical rock<br />
mass condition factor, and σ c is <strong>the</strong> uniaxial compressive strength <strong>of</strong> <strong>the</strong> intact rock<br />
material.<br />
Wiseman 13 logged some 20 kilometres <strong>of</strong> underground tunnels in <strong>the</strong> South African<br />
gold mining industry, and related <strong>the</strong> results obtained to <strong>the</strong> support systems installed<br />
in <strong>the</strong> tunnels. It <strong>the</strong>refore represents <strong>the</strong> first attempt to objectively determine support<br />
required given certain rockmass and stress conditions for underground mines.<br />
Although it is fairly widely used in <strong>the</strong> gold mines after Ryder’s 14 addition <strong>of</strong> a<br />
rockmass condition factor, it is considered applicable to tunnels that are affected by<br />
both jointing and mining induced fractures, and is <strong>the</strong>refore not entirely appropriate to<br />
evaluate <strong>the</strong> potential for discontinuity-bounded falls <strong>of</strong> ground, which are commonest<br />
at Impala Platinum Mine.<br />
3.2.7 <strong>The</strong> CSIR Geomechanics Classification for Jointed Rockmasses<br />
Bieniawski 16<br />
proposed a rockmass evaluation system that addresses some <strong>of</strong> <strong>the</strong><br />
limitations outlined above by providing a more comprehensive description <strong>of</strong> <strong>the</strong><br />
rockmass from which a quantitative result is obtained. This classification system is<br />
called <strong>the</strong> CSIR Geomechanics Classification for Jointed Rock Masses, or <strong>the</strong> Rock<br />
Mass Rating (RMR). It classifies a rock mass using <strong>the</strong> following six parameters:<br />
13
uniaxial compressive strength <strong>of</strong> <strong>the</strong> rock material<br />
Rock Quality Designation (RQD)<br />
spacing <strong>of</strong> discontinuities<br />
condition <strong>of</strong> discontinuities<br />
orientation <strong>of</strong> discontinuities<br />
groundwater conditions<br />
When applying this classification system, <strong>the</strong> rock mass should be divided into<br />
structural regions for separate classification. Structural features such as faults or<br />
dykes, or changes in rock type should define <strong>the</strong> boundaries <strong>of</strong> a structural region.<br />
<strong>The</strong> RMR has been applied to civil engineering projects at or near surface where <strong>the</strong><br />
in situ stresses are generally not <strong>of</strong> any concern. This is <strong>the</strong> first scheme to consider<br />
geotechnical conditions in detail, but it is still generally unsuitable for underground<br />
mines because it omits <strong>the</strong> in situ stress from <strong>the</strong> classification.<br />
3.2.8 Laubscher’s Mining Modification to Bieniawski’s RMR<br />
In 1973, DH Laubscher met with ZT Bieniawski to discuss <strong>the</strong> RMR, which was <strong>the</strong>n<br />
being developed at <strong>the</strong> CSIR 17 . At <strong>the</strong> meeting, it became clear that <strong>the</strong> RMR was<br />
much better than that under development in Zimbabwe by Heslop and Laubscher 18 .<br />
Although Bieniawski’s scheme was better, it did not possess <strong>the</strong> flexibility to adjust to<br />
different mining situations, and this led to <strong>the</strong> development <strong>of</strong> <strong>the</strong> Modified Rock<br />
Mass Classification for Jointed Rock Masses 17<br />
based on Bieniawski’s RMR.<br />
Originally, block caving in asbestos mines in Africa formed <strong>the</strong> basis for <strong>the</strong><br />
modifications, but subsequently o<strong>the</strong>r case histories from around <strong>the</strong> world have been<br />
14
added to <strong>the</strong> database 19, 20, 21 . <strong>The</strong> modified classification scheme uses <strong>the</strong> RMR<br />
obtained from Bieniawski’s scheme, and adjusts it to account for wea<strong>the</strong>ring, joint<br />
orientation, induced stress, blasting, and water according to <strong>the</strong> following equation:<br />
MRMR = RMR×<br />
adjustment factors (2)<br />
Figure 11: Flow Sheet <strong>of</strong> <strong>the</strong> Mining Rock Mass Rating (MRMR) Procedure with<br />
Recent Modifications (after Laubscher and Jakobec 17 )<br />
<strong>The</strong> classification has grown in complexity to <strong>the</strong> current procedure shown as a<br />
flowchart in Figure 11. This classification scheme is fine for design and detailed<br />
15
design, but its complexity <strong>of</strong> <strong>the</strong> scheme as a whole makes it too tedious to apply to<br />
<strong>the</strong> support design procedure on a day-to-day basis. Fur<strong>the</strong>rmore, <strong>the</strong>re is a<br />
considerable amount <strong>of</strong> subjectivity in <strong>the</strong> choice <strong>of</strong> adjustments for water, blasting,<br />
wea<strong>the</strong>ring, and so on. Jakubec and Laubscher 22<br />
discuss this issue in <strong>the</strong>ir<br />
introduction and to repeat in <strong>the</strong>ir own words “…<strong>the</strong>re is a growing concern in <strong>the</strong><br />
mining community about <strong>the</strong>ir appropriateness and usefulness as a mine design tool.<br />
Some <strong>of</strong> <strong>the</strong> concerns are based on misunderstandings and misuse <strong>of</strong> <strong>the</strong> classification<br />
systems. It must be understood that a classification system can give <strong>the</strong> guidelines,<br />
but <strong>the</strong> geologist or engineer must interpret <strong>the</strong> finer details. <strong>The</strong> most important<br />
pitfall to avoid is <strong>the</strong> belief that <strong>the</strong> method is a rigorous analysis.” <strong>The</strong>se concerns<br />
are applicable to every scheme that is available: engineering judgment is <strong>of</strong> paramount<br />
importance when assessing rockmass conditions. <strong>The</strong> apparent complexity <strong>of</strong> <strong>the</strong><br />
MRMR system makes it difficult to use underground daily. <strong>The</strong> authors decided to<br />
choose a scheme that could adequately address <strong>the</strong> variability <strong>of</strong> geotechnical<br />
conditions underground at Impala Platinum Mine, while at <strong>the</strong> same time being simple<br />
enough to make objective rockmass assessments daily.<br />
3.2.9 Rock Tunneling Quality Index, Q<br />
Barton et al. 1 proposed a Tunneling Quality Index (Q) for <strong>the</strong> determination <strong>of</strong> rock<br />
mass characteristics and tunnel support requirements. <strong>The</strong> numerical value <strong>of</strong> <strong>the</strong><br />
<strong>index</strong> Q varies on a logarithmic scale from 0.001 to a maximum <strong>of</strong> 1,000 and is<br />
defined by:<br />
RQD J<br />
r<br />
J<br />
w<br />
Q = × ×<br />
J J SRF<br />
n<br />
a<br />
(3)<br />
Where RQD is <strong>the</strong> Rock Quality designation<br />
J n<br />
is <strong>the</strong> joint set number<br />
16
J r<br />
J a<br />
J w<br />
SRF<br />
is <strong>the</strong> joint roughness number<br />
is <strong>the</strong> joint alteration number<br />
is <strong>the</strong> joint water reduction factor<br />
is <strong>the</strong> stress reduction factor<br />
<strong>The</strong> first quotient (RQD/J n ), represents <strong>the</strong> discontinuous structure <strong>of</strong> <strong>the</strong> rockmass,<br />
and can be considered a crude measure <strong>of</strong> <strong>the</strong> block or particle size. <strong>The</strong> second<br />
quotient (J r /J a ) represents <strong>the</strong> roughness and frictional characteristics <strong>of</strong> <strong>the</strong><br />
discontinuity surfaces and filling materials. This quotient is weighted in favor <strong>of</strong><br />
rough, unaltered joints with opposing surfaces in direct contact with each o<strong>the</strong>r.<br />
When rock joints have thin clay mineral coatings and fillings, <strong>the</strong> strength <strong>of</strong> <strong>the</strong><br />
rockmass as a whole is reduced significantly, which is taken into account by <strong>the</strong><br />
second quotient. <strong>The</strong> third quotient (J w /SRF) consists <strong>of</strong> two stress parameters. <strong>The</strong><br />
SRF is a measure <strong>of</strong> loosening load in <strong>the</strong> case <strong>of</strong> an excavation through shear zones<br />
and clay bearing rock; rock stress in competent rock; and squeezing loads in plastic<br />
incompetent rocks. Toge<strong>the</strong>r with J w , which is a measure <strong>of</strong> water pressure in joints,<br />
<strong>the</strong> quotient forms a complex empirical stress factor describing <strong>the</strong> active stresses in a<br />
tunnel.<br />
In summary, <strong>the</strong> rock tunneling <strong>quality</strong> Q is a measure <strong>of</strong>:<br />
block size (RQD/J n )<br />
inter-block shear strength (J r /J a )<br />
active stress (J w /SRF).<br />
17
<strong>The</strong>se three factors are important in assessing mine tunnel stability, and toge<strong>the</strong>r with<br />
<strong>the</strong> support guidelines provided by <strong>the</strong> system, provide a simple yet flexible scheme to<br />
take geotechnical factors into account in tunnel support designs.<br />
3.3 Choice <strong>of</strong> Rockmass Rating System Applicable to Impala Platinum Mine<br />
<strong>The</strong> tunneling <strong>quality</strong> <strong>index</strong> Q proposed by Barton et al 1 and <strong>the</strong> MRMR classification<br />
scheme developed and modified by Laubscher 17 are probably <strong>the</strong> two most commonly<br />
used rock mass classifications in mining rock mechanics. Both are designed to assess<br />
factors, which influence <strong>the</strong> stability <strong>of</strong> underground excavations. <strong>The</strong> similarities<br />
between <strong>the</strong> MRMR and <strong>the</strong> Q-Index stem from <strong>the</strong> use <strong>of</strong> identical, or very similar,<br />
parameters in calculating <strong>the</strong> final rock mass <strong>quality</strong> rating. <strong>The</strong> differences between<br />
<strong>the</strong> two systems lie in <strong>the</strong> different weightings given to similar parameters and in <strong>the</strong><br />
use <strong>of</strong> distinct parameters in one or <strong>the</strong> o<strong>the</strong>r scheme.<br />
<strong>The</strong> MRMR uses <strong>the</strong> uniaxial compressive strength <strong>of</strong> intact rock directly while <strong>the</strong> Q-<br />
Index only considers strength as it relates to in situ stress in competent rock. Both<br />
schemes deal with <strong>the</strong> geology and geometry <strong>of</strong> <strong>the</strong> rock mass, but in slightly different<br />
ways. Both consider ground water, and both consider in-situ stress, although <strong>the</strong><br />
MRMR approaches stress more quantitatively than <strong>the</strong> Q-Index. Like <strong>the</strong> MRMR, <strong>the</strong><br />
Q-Index has evolved over <strong>the</strong> years; for example, it has been extended to estimate<br />
tunnel boring machine performance in rockmasses 23 . Unlike <strong>the</strong> MRMR, which has<br />
been generalised for all mining, <strong>the</strong> Q-Index has remained focused on tunneling.<br />
Since both systems consider <strong>the</strong> factors necessary to assess underground tunnel<br />
stability, nei<strong>the</strong>r supercedes <strong>the</strong> o<strong>the</strong>r as a suitable system for <strong>application</strong> to <strong>of</strong>f-reef<br />
18
tunnels at Impala Platinum Mine. <strong>The</strong> choice <strong>of</strong> <strong>the</strong> Q Tunneling Quality Index was<br />
<strong>the</strong>refore made for <strong>the</strong> following reasons:<br />
• its simplicity as a measure <strong>of</strong> block size, inter-block shear strength, and<br />
active stress, all <strong>of</strong> which are critical factors in <strong>the</strong> fall <strong>of</strong> ground problem,<br />
as determined from <strong>the</strong> fall <strong>of</strong> ground analysis;<br />
• <strong>the</strong> Q-Index is easy to use on a daily basis underground;<br />
• <strong>the</strong> simple relationship provided in <strong>the</strong> scheme to decide whe<strong>the</strong>r support<br />
is required or not.<br />
<strong>The</strong> Q-Index has since been applied in two case studies at Impala Platinum Mine.<br />
4 CASE STUDIES<br />
Two excavations were chosen for <strong>the</strong> case studies, namely 10 Level Crosscut West<br />
and 23 Level Conveyor Decline. <strong>The</strong> first excavation is in a fair to extremely good<br />
rockmass, <strong>the</strong> second in a poor to very poor rockmass. <strong>The</strong> range <strong>of</strong> <strong>the</strong> two<br />
combined covers all conditions likely to be encountered at Impala Platinum Mine.<br />
<strong>The</strong> 10 Level Crosscut is located 640 metres below surface at No. 9-Shaft where both<br />
<strong>the</strong> Merensky and UG2 Reefs are being exploited. It lies above both reefs at <strong>the</strong> shaft,<br />
crosscutting down through <strong>the</strong> strata in a westerly direction until it intersects <strong>the</strong><br />
Merensky Reef 120 m west <strong>of</strong> <strong>the</strong> shaft, and <strong>the</strong> UG2 Reef about 640 m west <strong>of</strong> <strong>the</strong><br />
shaft. Mining has been restricted from taking place ei<strong>the</strong>r directly above or below <strong>the</strong><br />
crosscut, which has limited mining induced stress changes in <strong>the</strong> crosscut itself to<br />
small values. <strong>The</strong> vertical virgin stress along <strong>the</strong> entire length <strong>of</strong> <strong>the</strong> crosscut is<br />
estimated to be approximately 20 MPa, and mining induced stress changes remain<br />
19
insignificant. <strong>The</strong> crosscut intersects <strong>the</strong> entire stratigraphic succession given in Table<br />
I.<br />
<strong>The</strong> average width <strong>of</strong> <strong>the</strong> crosscut is 3 m with sections that widen out to 5.2 metres in<br />
places. Support was installed in <strong>the</strong> crosscut at <strong>the</strong> wider sections and spot bolts were<br />
installed in one o<strong>the</strong>r area. <strong>The</strong> tunnel was developed in 1981, and has remained open<br />
without any significant falls <strong>of</strong> ground along its entire length ever since. <strong>The</strong> Q-Index<br />
was estimated for 10 m intervals over a distance <strong>of</strong> 770 metres in this tunnel.<br />
<strong>The</strong> 23 Level Conveyor Decline is located 1058 metres below surface at No. 14-Shaft,<br />
which is currently mining <strong>the</strong> Merensky Reef. <strong>The</strong> vertical virgin stress at No. 14-<br />
shaft is approximately 32.3 MPa at 23 Level. <strong>The</strong> decline is currently being<br />
developed in Footwall 16 anorthosite below <strong>the</strong> UG2 Reef, at an average width <strong>of</strong> 5.6<br />
metres span and an average 30 centimetres overbreak.<br />
<strong>The</strong> support installed in <strong>the</strong> decline consists <strong>of</strong> full column grouted, 3 metres long, 16<br />
millimetre diameter shepherd crooks placed one metre apart on dip and strike. <strong>The</strong><br />
rock mass shows hangingwall and sidewall instability, with falls <strong>of</strong> ground up to two<br />
metres high taking place almost immediately after <strong>the</strong> blast.<br />
4.1 Methodology Used to Obtain <strong>the</strong> Q Tunneling Quality Index<br />
<strong>The</strong> Q-Index is used to assess <strong>the</strong> stability <strong>of</strong> an excavation, and to provide guidelines<br />
for <strong>the</strong> excavation support. <strong>The</strong> methodology used to estimate <strong>the</strong> input parameters<br />
for <strong>the</strong> Q-Index is discussed briefly below.<br />
20
4.1.1 Estimating <strong>the</strong> RQD from Scan line Measurements<br />
<strong>The</strong> RQD for a rock mass can be calculated from scan line measurements taken<br />
underground. A scan line is defined as a line, usually a tape, set on <strong>the</strong> surface <strong>of</strong> <strong>the</strong><br />
rock mass, and <strong>the</strong> survey consists <strong>of</strong> counting <strong>the</strong> number <strong>of</strong> joints which intersect<br />
this line along its length. Three mutually perpendicular scan lines were set up in <strong>the</strong><br />
tunnel, <strong>the</strong> first parallel to <strong>the</strong> axis <strong>of</strong> <strong>the</strong> tunnel, <strong>the</strong> second spanning <strong>the</strong> tunnel width<br />
at <strong>the</strong> midpoint <strong>of</strong> <strong>the</strong> axial scan line, and <strong>the</strong> third vertical, also located at <strong>the</strong><br />
midpoint <strong>of</strong> <strong>the</strong> axial scan line. <strong>The</strong> scans were repeated every ten metres along <strong>the</strong><br />
axis <strong>of</strong> <strong>the</strong> tunnel. <strong>The</strong> scan line length along <strong>the</strong> axis <strong>of</strong> <strong>the</strong> tunnel was chosen to be<br />
ten metres in order to capture joint sets with spacing <strong>of</strong> up to ten metres.<br />
Joint densities (number <strong>of</strong> joints per linear metre) were found by counting <strong>the</strong> number<br />
<strong>of</strong> joints intersecting <strong>the</strong> scan line and dividing by its length. In this way a linear joint<br />
density for <strong>the</strong> tunnel axis direction D, for its span S, and its height, V were obtained<br />
and inserted into equations (4) and (5) below:<br />
J = D+ S+<br />
V (4)<br />
D<br />
RQD = 115 −3.3J D<br />
(5)<br />
If <strong>the</strong> RQD obtained from Equation (5) is less than 10%, <strong>the</strong>n a value <strong>of</strong> 10% is<br />
entered into Equation (2). For values greater than 100% obtained using Equation (5),<br />
a value <strong>of</strong> 100% is used for <strong>the</strong> RQD in equation (2).<br />
4.1.2 Estimating <strong>the</strong> o<strong>the</strong>r variables<br />
Estimates for J n , J r , J a , J w , and <strong>the</strong> SRF are obtained as described by Barton et al. 1 .<br />
21
Where <strong>the</strong> excavation is expected to be subject to a stress change, a stress analysis is<br />
carried out using MINSIM-W 24 to help estimate a stress - rock strength relationship.<br />
4.2 Q-Index Analysis <strong>of</strong> 10 Level Crosscut and 23 Level Conveyor Decline<br />
A total <strong>of</strong> 89 tunneling <strong>quality</strong> <strong>index</strong> measurements were made, 77 in 10 Level<br />
Crosscut and 12 in 23 Level Conveyor Decline. This represents 890 metres <strong>of</strong> tunnel<br />
covered using this method. Figure 12 provides statistics <strong>of</strong> <strong>the</strong> spread <strong>of</strong> Q-Index<br />
values obtained in <strong>the</strong> two excavations.<br />
QUANTITY<br />
40<br />
35<br />
30<br />
25<br />
20<br />
15<br />
10<br />
5<br />
0<br />
10 LEVEL CROSSCUT<br />
23 LEVEL CONVEYOR<br />
DECLINE<br />
Exceptionally<br />
poor<br />
Extremely<br />
Poor<br />
Very Poor<br />
Poor<br />
Fair<br />
Good<br />
Very Good<br />
Extremely<br />
Good<br />
Q-VALUE CATEGORIES<br />
Figure 12: Distribution <strong>of</strong> Q-Index Values Obtained from 10 Level Crosscut and<br />
23 Level Conveyor Decline<br />
22
Excavation Span (m)<br />
10<br />
9<br />
8<br />
7<br />
6<br />
5<br />
4<br />
3<br />
2<br />
1<br />
No Bolting<br />
Bolting<br />
Barton<br />
Impala<br />
0<br />
0.1 1 10 100 1000 10000<br />
Rock Mass Quality, Q<br />
Figure 13: Scatter plot <strong>of</strong> Equivalent Dimension vs. Q-Index for an Excavation<br />
Support Ratio <strong>of</strong> 1.6 (Permanent Mine Openings)<br />
10<br />
Excavation Span (m)<br />
9<br />
8<br />
7<br />
6<br />
5<br />
4<br />
3<br />
2<br />
1<br />
No Bolting<br />
Bolting<br />
Barton<br />
Impala<br />
0<br />
0.1 1 10 100 1000 10000<br />
Rock Mass Quality, Q<br />
Figure 14: Scatter Plot <strong>of</strong> Excavation Span vs. Q-Index<br />
23
Figures 13 and 14 are log-linear scatter plots <strong>of</strong> Equivalent Dimension (D e ) versus Q-<br />
Index and Excavation Span versus Q-Index respectively. Two populations <strong>of</strong> points<br />
appear in <strong>the</strong> plots, <strong>the</strong> diamond symbols for unsupported sections, and <strong>the</strong> squares for<br />
supported sections. <strong>The</strong> type <strong>of</strong> support is ignored in <strong>the</strong>se plots, so that excavations<br />
with support ranging from spot bolts to heavy support using several types <strong>of</strong> support<br />
elements are considered supported. In both plots, Barton’s 1<br />
“no support” line<br />
straddles both unsupported and supported excavation data, which suggests that <strong>the</strong><br />
current decision line position is not suitable for Impala. If this line were used as a<br />
guideline, <strong>the</strong>re would be occasions when no support would be installed in an<br />
excavation that needs support, which could lead to a fall <strong>of</strong> ground. <strong>The</strong> “no support”<br />
line only straddled data from 10 Level Crosscut, which is located in a good to very<br />
good rockmass. All data for <strong>the</strong> 23 Level Conveyor Decline plotted well to <strong>the</strong> left <strong>of</strong><br />
<strong>the</strong> “no support” line, since this excavation yielded relatively low Q-Index values.<br />
Barton’s “no support” line is given by <strong>the</strong> following formula for <strong>the</strong> Equivalent<br />
Dimension – Q-Index relationship:<br />
De<br />
0.4<br />
= 2Q<br />
(6)<br />
D e is <strong>the</strong> Equivalent Dimension, defined by excavation height or excavation span<br />
divided by <strong>the</strong> Excavation Support Ratio, which is given by Barton 1 as 1.6 for<br />
permanent mine openings. In considering <strong>the</strong> relationship for excavation span,<br />
Barton 24 considered both natural and man-made excavations, from which he deduced<br />
that:<br />
Span<br />
0.66<br />
= 2Q<br />
(7)<br />
24
In order to estimate where <strong>the</strong> “no support” line should plot for Impala data, it is<br />
assumed that conditions demanded support wherever it was installed, and that<br />
unsupported sections really do not need support. Since geotechnical parameters have<br />
not until recently been taken into account in <strong>the</strong> decision to support or not, it is also<br />
assumed that <strong>the</strong> relevant supervisor decided where support was necessary on <strong>the</strong><br />
strength <strong>of</strong> a visual check. This decision was probably based on a fall <strong>of</strong> ground,<br />
ei<strong>the</strong>r shortly after <strong>the</strong> development blast, or sometime later in <strong>the</strong> excavation’s life.<br />
<strong>The</strong>re is no evidence to suggest that <strong>the</strong> relationship should not be <strong>the</strong> power law<br />
already given by Barton 1 , hence this will be retained in <strong>the</strong> following general form:<br />
b<br />
Span = a × ESR× Q<br />
(8)<br />
Where it remains to determine a and b to suit <strong>the</strong> data obtained for Impala, assuming<br />
in all cases that ESR = 1.6 for permanent mine openings. Two points on <strong>the</strong> “no<br />
support” line need to be defined in order to determine <strong>the</strong> parameters for <strong>the</strong><br />
relationship. <strong>The</strong> smallest dimension measured in <strong>the</strong> fall <strong>of</strong> ground data is 0.5 m (see<br />
Figures 3, 4, and 5). It is <strong>the</strong>refore assumed that a fall <strong>of</strong> ground this size could occur<br />
in an excavation with a span <strong>of</strong> 0.5 m. Secondly, it appears from Figures 13 and 14<br />
that all excavations with Q-Index values <strong>of</strong> 1.0 or less require support. <strong>The</strong> first point<br />
for <strong>the</strong> “no support” line in Figure 14 would thus be (1.0, 0.5). It also appears from<br />
<strong>the</strong> data in Figures 13 and 14 that excavations with Q-Index values <strong>of</strong> 100 or more<br />
never need support. Since this was only ever observed in 10 Level Crosscut, a span <strong>of</strong><br />
3 m is assumed, and <strong>the</strong> second point is thus (100.0, 3.0).<br />
Using <strong>the</strong> two points to solve for a and b in equation (8) and assuming <strong>the</strong> ESR = 1.6,<br />
we obtain:<br />
DE<br />
0.3891<br />
= 0.3125Q<br />
(9)<br />
25
Span ESR Q<br />
0.3891<br />
= 0.3125× × (10)<br />
<strong>The</strong>se lines appear in Figures 13 and 14, and it can be seen that <strong>the</strong>y separate <strong>the</strong><br />
unsupported data from <strong>the</strong> supported data more effectively than Barton’s 1,24 lines.<br />
<strong>The</strong> result <strong>of</strong> <strong>the</strong> changed support lines is that tunnels <strong>of</strong> smaller span will require<br />
support than that required by <strong>the</strong> original analyses <strong>of</strong> Barton 1 and Barton 24 . <strong>The</strong><br />
reasons for this smaller span may lie in <strong>the</strong> hardness and brittleness <strong>of</strong> <strong>the</strong> rock<br />
material, toge<strong>the</strong>r with <strong>the</strong> fact that it is blasted. If <strong>the</strong> tunnels were mechanically<br />
excavated, it is expected that larger spans would be stable in <strong>the</strong> same conditions.<br />
This indicates <strong>the</strong> site-specific nature <strong>of</strong> <strong>the</strong> Q Tunnelling Quality Index, and how it<br />
needs to be modified for <strong>the</strong> environment in which it is being used.<br />
4.3 Bolt length design for permanent mine openings<br />
<strong>The</strong> Q-Index analysis first provides a guideline on whe<strong>the</strong>r <strong>the</strong> tunnel needs support or<br />
not, using <strong>the</strong> revised “no support” line. If support is required, <strong>the</strong>n <strong>the</strong> support design<br />
must consider <strong>the</strong> bolt type in use, <strong>the</strong> 95 th Percentile fallout height, and fall <strong>of</strong> ground<br />
dimensions. An example design, which results in a bolt length <strong>of</strong> 1.2 metres spaced 1<br />
m apart, appears in Appendix 1. Note that this design should not be applied<br />
everywhere on <strong>the</strong> mine. Ra<strong>the</strong>r, geotechnical conditions at <strong>the</strong> site should be<br />
reckoned into <strong>the</strong> support design. A comparable design using Barton’s 1 formula<br />
follows in Appendix 1. <strong>The</strong>re is an opportunity to modify this formula as well for<br />
conditions at Impala Platinum Mine.<br />
26
<strong>The</strong> work in implementing <strong>the</strong> use <strong>of</strong> geotechnical parameters in tunnel support design<br />
is still not complete. Geotechnical mapping should be carried out far more widely on<br />
<strong>the</strong> mine, and should include excavations with larger spans than those measured in<br />
this paper. This will help to fix <strong>the</strong> “no support” line with better confidence. Shortlife<br />
excavations should also be included in <strong>the</strong> mapping. With this increased database<br />
it will be possible to determine a set <strong>of</strong> excavation support designs for all geotechnical<br />
conditions and all excavation spans at Impala, so that support design could be<br />
simplified to a reference to a standard support table for <strong>the</strong> mine based on <strong>the</strong> Q-<br />
Index. With time it will be possible to refine <strong>the</strong> support designs to increase <strong>the</strong>ir<br />
cost-effectiveness, while at <strong>the</strong> same time eliminating falls <strong>of</strong> ground in <strong>of</strong>f-reef<br />
excavations.<br />
5 CONCLUSION<br />
Support designs for <strong>of</strong>f-reef excavations at Impala previously met <strong>the</strong> 33-kN/m 2<br />
support resistance criterion without any consideration <strong>of</strong> <strong>the</strong> geotechnical conditions.<br />
This approach is no longer acceptable because it does not prevent fall <strong>of</strong> ground<br />
accidents. <strong>The</strong>re are also many instances where such support may not be necessary.<br />
A fall <strong>of</strong> ground accident analysis for <strong>of</strong>f-reef tunnels at Impala revealed that:<br />
• 95% <strong>of</strong> all falls <strong>of</strong> ground were 0.9 metres thick or less;<br />
• nearly all were controlled by discontinuities in <strong>the</strong> rockmass;<br />
• large falls <strong>of</strong> ground are rare;<br />
• conventional support designs already in use could have prevented all falls <strong>of</strong><br />
ground if <strong>the</strong> circumstances leading to <strong>the</strong>m had been identified beforehand.<br />
27
<strong>The</strong> Q Tunnelling Quality Index is sufficiently flexible to identify <strong>the</strong> potential fall <strong>of</strong><br />
ground hazard if it is properly used at Impala, and it can be used as a guideline to<br />
more cost-effective support. Since testing <strong>the</strong> viability <strong>of</strong> <strong>the</strong> Q-Index as a rockmass<br />
classification scheme underground, it has shown that:<br />
• <strong>the</strong> Q-Index addresses all <strong>the</strong> critical parameters that control falls <strong>of</strong> ground in<br />
tunnels at Impala;<br />
• it is easy to apply underground, and geotechnical data ga<strong>the</strong>ring using <strong>the</strong><br />
system is quick;<br />
• Barton’s 1 “no support” line needs to be modified for Impala;<br />
• <strong>the</strong> changes to <strong>the</strong> parameters for <strong>the</strong> “no support” line represent a first<br />
estimate, which should be refined as more geotechnical data is ga<strong>the</strong>red;<br />
• routine mapping <strong>of</strong> <strong>the</strong> tunnels should reveal all potential fall <strong>of</strong> ground<br />
hazards;<br />
• Impala Platinum Mine should be able to take remedial action against potential<br />
falls <strong>of</strong> ground before <strong>the</strong>y occur.<br />
Implementing effective support designs based on geotechnical investigations should<br />
help solve <strong>the</strong> fall <strong>of</strong> ground problem in <strong>of</strong>f-reef excavations, while underground<br />
support designs for <strong>of</strong>f-reef excavations could be simplified once a comprehensive<br />
geotechnical database has been built up.<br />
28
6 ACKNOWLEDGEMENTS<br />
<strong>The</strong> authors would like to thank <strong>the</strong> management <strong>of</strong> Impala Platinum Limited for<br />
permission to publish this paper. A special mention in this regard is expressed to P.J.<br />
Anderson and N.F. Fernandes for providing <strong>the</strong> opportunity to ga<strong>the</strong>r information as<br />
part <strong>of</strong> this MSc <strong>the</strong>sis.<br />
7 REFERENCES<br />
1. Barton N, Lien R, and Lunde J (1974): Engineering classification <strong>of</strong> rock<br />
masses for <strong>the</strong> design <strong>of</strong> tunnel support. Rock Mechanics, Vol. 6, No. 4, 1974,<br />
pp. 189-236.<br />
2. Jakubec J and Laubscher DH (2000): <strong>The</strong> MRMR Rock Mass Rating<br />
Classification System in Mining Practice.<br />
Massmin 2000, Brisbane,<br />
Queensland, 29 October – 2 November 2000, pp. 413-421.<br />
3. Vermaak CF (1995): <strong>The</strong> Platinum Group Metals: A Global Perspective.<br />
Mintek, Randburg, South Africa, 1995.<br />
4. Mellowship P (1996): Impala Platinum Limited Geology - Training Module.<br />
Geology Department Impala Platinum Limited, 1996.<br />
5. Terzaghi K (1946): Rock defects and loads on tunnel supports. In: Rock<br />
Tunneling with Steel Supports, Eds. R. V. Procter and T.L. White Vol. 1, pp.<br />
17-99. Youngstown, OH: Commercial Shearing and Stamping Company,<br />
1946.<br />
6. Deere DU (1964): Technical description <strong>of</strong> rock cores for engineering<br />
purposes. Rock Mechanics and Engineering Geology Vol. 1 No. 1, pp. 17-22,<br />
1964.<br />
29
7. Merritt AH (1972): Geologic prediction for underground excavations. Procs.<br />
First North American Rapid Excavation and Tunnelling Conference, AIME,<br />
New York, 1972, pp. 115-132.<br />
8. Wickham GE, Tiedeman HR, and Skinner EH (1972): Support determination<br />
based on geological predictions. In Proc. North American Rapid Excavation<br />
and Tunneling Conference, Chicago, 1972, pp. 43-64. New York: Soc. Min.<br />
Engrs, Am. Inst. Min. Metall. Petrom. Engrs.<br />
9. Stini I (1950): Tunnelbaugeologie. Vienna: Springer Verlag, 1950, 366p.<br />
10. Hoek E and Brown ET (1980): Underground Excavations in Rock. <strong>The</strong><br />
Institution <strong>of</strong> Mining and Metallurgy, London, England, 1980.<br />
11. Lauffer H (1958): Gebirgsklassifiziering fur den spollenbau. Geologie en<br />
Bauwesen, Vol. 24, No. 1, 1958, pp. 46-51.<br />
12. SIMRAC (1998): Hazard identification for Rock Engineering. Final Project<br />
Report, Project GAP 339, Department <strong>of</strong> Minerals and Energy, Johannesburg,<br />
1998.<br />
13. Wiseman N (1979): A Study <strong>of</strong> <strong>the</strong> Factors Affecting <strong>the</strong> Design and Support<br />
<strong>of</strong> Gold Mine Tunnels. Research Report No. 50/78, Chamber <strong>of</strong> Mines<br />
Research Organization, Johannesburg, 1979.<br />
14. Ryder JA (2001): Personal communication by telephone, 2 nd November 2001.<br />
15. COMRO (1988): An Industry Guide to Methods <strong>of</strong> Ameliorating <strong>the</strong> Hazards<br />
<strong>of</strong> Rockfalls and Rockbursts. Research Organization <strong>of</strong> <strong>the</strong> Chamber <strong>of</strong> Mines<br />
<strong>of</strong> South Africa (COMRO), Johannesburg, 1988.<br />
16. Bieniawski ZT (1978): Rock mass classification in rock engineering. In<br />
Proceedings <strong>of</strong> <strong>the</strong> Symposium on Exploration for Rock Engineering, (ed. Z.T.<br />
Bieniawski) Vol. 1, pp. 97-106. Johannesburg, 1978.<br />
30
17. Laubscher DH and Jakubec J (2000): <strong>The</strong> MRMR Rock Mass Classification<br />
for Jointed Rock Masses. Chapter 57, pp 475-481, Society <strong>of</strong> Mining<br />
Engineers, AIME, 2000.<br />
18. Heslop TG (1973): Internal company report.<br />
19. Laubscher DH (1977): Geomechanics classification <strong>of</strong> jointed rock massesmining<br />
<strong>application</strong>s. Trans Instn. Min. Metall. 1977, Vol. 86, pp. A1-8.<br />
20. Laubscher DH and Taylor HW (1978): <strong>The</strong> importance <strong>of</strong> geomechanics<br />
classification <strong>of</strong> jointed rock masses in mining operations. In: Proceedings <strong>of</strong><br />
<strong>the</strong> Symposium on Exploration for Rock Engineering (ed. Z.T. Bieniawski)<br />
Vol. 1, pp. 119-128. Cape Town. Balkema, 1978.<br />
21. Laubscher DM and Page CH (1990): <strong>The</strong> design <strong>of</strong> rock Support in high stress<br />
or weak rock environments. Proc. 92nd Can. Inst. Min. Metall. AGM, Ottawa,<br />
Paper No. 91, 1990.<br />
22. Jakubec J and Laubscher DH (2000): <strong>The</strong> MRMR Rock Mass Rating System<br />
in Mining Practice. Proceedings <strong>of</strong> MassMin 2000, Brisbane, Queensland,<br />
Australia 29 October – 2 November 2000, pp.413-421.<br />
23. Barton N (2000): TBM Tunnelling in Jointed and Faulted Rock. Rotterdam:<br />
AA Balkema, 173p.<br />
24. Barton N (1976): Recent experiences with <strong>the</strong> Q-system <strong>of</strong> tunnel support<br />
design. Proceedings <strong>of</strong> <strong>the</strong> Symposium on Exploration for Rock Engineering,<br />
Johannesburg, Vol. 1, pp. 107-117.<br />
31
APPENDIX I<br />
9<br />
100%<br />
FREQUENCY<br />
8<br />
7<br />
6<br />
5<br />
4<br />
3<br />
2<br />
1<br />
80%<br />
60%<br />
40%<br />
20%<br />
CUMULATIVE PERCENTAGE<br />
0<br />
0%<br />
0.0<br />
0.1<br />
0.2<br />
0.3<br />
0.4<br />
0.5<br />
0.6<br />
0.7<br />
0.8<br />
0.9<br />
1.0<br />
1.1<br />
1.2<br />
1.3<br />
1.4<br />
1.5<br />
More<br />
THICKNESS (metres)<br />
Figure 2: Cumulative Frequency Plot <strong>of</strong> Maximum Thickness <strong>of</strong> Falls <strong>of</strong> Ground<br />
FREQUENCY<br />
16<br />
14<br />
12<br />
10<br />
8<br />
6<br />
4<br />
2<br />
0<br />
0<br />
1<br />
2<br />
3<br />
4<br />
5<br />
6<br />
7<br />
8<br />
9<br />
10<br />
11<br />
12<br />
13<br />
14<br />
More<br />
100%<br />
80%<br />
60%<br />
40%<br />
20%<br />
0%<br />
CUMULATIVE PERCENTAGE<br />
AREAL EXTENT ( m 2 )<br />
Figure 3: Cumulative Frequency Plot <strong>of</strong> Areal extent <strong>of</strong> Falls <strong>of</strong> Ground<br />
32
FREQUENCY<br />
12<br />
10<br />
8<br />
6<br />
4<br />
2<br />
0<br />
100%<br />
80%<br />
60%<br />
40%<br />
20%<br />
0%<br />
0.0<br />
0.5<br />
1.0<br />
1.5<br />
2.0<br />
2.5<br />
CUMULATIVE PERCENTAGE<br />
3.0<br />
More<br />
WIDTH ( metres )<br />
Figure 4: Cumulative Frequency Plot <strong>of</strong> Width <strong>of</strong> Falls <strong>of</strong> Ground<br />
FREQUENCY<br />
10<br />
9<br />
8<br />
7<br />
6<br />
5<br />
4<br />
3<br />
2<br />
1<br />
0<br />
100%<br />
0.0<br />
0.5<br />
1.0<br />
1.5<br />
2.0<br />
2.5<br />
3.0<br />
3.5<br />
4.0<br />
4.5<br />
5.0<br />
5.5<br />
More<br />
80%<br />
60%<br />
40%<br />
20%<br />
0%<br />
CUMULATIVE PERCENTAGE<br />
LENGTH ( metres )<br />
Figure 5: Cumulative Frequency Plot <strong>of</strong> Length <strong>of</strong> Falls <strong>of</strong> Ground<br />
33
Scaling<br />
32%<br />
Block<br />
50%<br />
Wedge<br />
Figure 6: Shape <strong>of</strong> Falls <strong>of</strong> Ground<br />
Cross Cut<br />
6%<br />
Boxhole<br />
11%<br />
Traveling<br />
Way 13%<br />
Raise<br />
24%<br />
Winze<br />
6%<br />
Figure 7: Location <strong>of</strong> Falls <strong>of</strong> Ground<br />
Drive<br />
40%<br />
34
Figure 8: Origin <strong>of</strong> Falls <strong>of</strong> Ground<br />
Figure 9: Rock Type Involved in Falls <strong>of</strong> Ground<br />
35
Figure 10: Boundaries <strong>of</strong> Falls <strong>of</strong> Ground<br />
APPENDIX II<br />
CALCULATION OF REQUIRED BOLT LENGTH FOR 3 METRE SPAN<br />
TUNNELS<br />
Fall <strong>of</strong> ground data suggest that 56% <strong>of</strong> <strong>the</strong> falls are 1 m 2 in area or less, 44% <strong>of</strong> falls<br />
are 0.5 m or less wide, and 36% are 0.5 m or less long. To prevent <strong>the</strong>se from<br />
occurring, a maximum bolt spacing <strong>of</strong> 1 by 1 m is necessary. This does not mean that<br />
bolt spacings everywhere on <strong>the</strong> mine should be 1 x 1 metre. Geotechnical mapping<br />
using <strong>the</strong> Q-Index will be far more effective in deducing maximum bolt spacings than<br />
fall <strong>of</strong> ground accident data, and should be used for this purpose wherever possible.<br />
Each bolt must suspend a potential fall <strong>of</strong> ground. Hence, it should be bonded to solid<br />
ground above <strong>the</strong> 95 th percentile potential fall-out height <strong>of</strong> 0.9 m. Assume that<br />
36
grouted rebars will be used. If <strong>the</strong> 95 th percentile fall <strong>of</strong> ground thickness is 0.9 m,<br />
<strong>the</strong>n <strong>the</strong> rebar must be long enough to suspend 0.9 m <strong>of</strong> rock. <strong>The</strong> volume <strong>of</strong> rock to<br />
be supported by each rebar is thus 0.9 m 3 , amounting to a deadweight <strong>of</strong> 27.4 kN, if<br />
<strong>the</strong> rock density is assumed 3000 kg/m 3 . <strong>The</strong> strength <strong>of</strong> a grout bond with <strong>the</strong><br />
support element is given by:<br />
bond strength<br />
pull − out force<br />
=<br />
π × rebar diameter × bond length<br />
(11)<br />
Underground pull tests have revealed an average 4 MPa bond strength for cement<br />
grouts that have cured for 1 hour. Rearranging equation (12):<br />
bond length<br />
pull − out force<br />
=<br />
π × rebar diameter × bond strength<br />
(12)<br />
Assuming a 16 mm rebar diameter, a bond length <strong>of</strong> 0.14 m is required. Using a<br />
factor <strong>of</strong> safety <strong>of</strong> 2.0, <strong>the</strong> minimum bond length should be 0.28 m. <strong>The</strong> rebar length<br />
should thus be 0.9 + 0.28 = 1.18 metres, say 1.2 metres.<br />
Comparing this with a typical bolt design from Barton et al. 1 :<br />
2.0 + 0.15B<br />
L = (13)<br />
ESR<br />
Where L is bolt length, B is <strong>the</strong> excavation width, and <strong>the</strong> ESR is <strong>the</strong> Excavation<br />
Support Ratio - a value related to <strong>the</strong> intended use <strong>of</strong> <strong>the</strong> excavation and <strong>the</strong> degree <strong>of</strong><br />
security. For permanent mine openings assume <strong>the</strong> ESR = 1.6. For Impala, a<br />
37
permanent 3.0 m wide excavation will thus require a bolt 1.53 m long. This design<br />
length is some 20% longer than <strong>the</strong> design using <strong>the</strong> fall <strong>of</strong> ground data and measured<br />
pull-out forces. With time, <strong>the</strong>re will be sufficient geotechnical data to change this<br />
formula to suit conditions at Impala Platinum Mine.<br />
38