EOG Grades 3-5 - Public Schools of North Carolina
EOG Grades 3-5 - Public Schools of North Carolina
EOG Grades 3-5 - Public Schools of North Carolina

You also want an ePaper? Increase the reach of your titles
YUMPU automatically turns print PDFs into web optimized ePapers that Google loves.
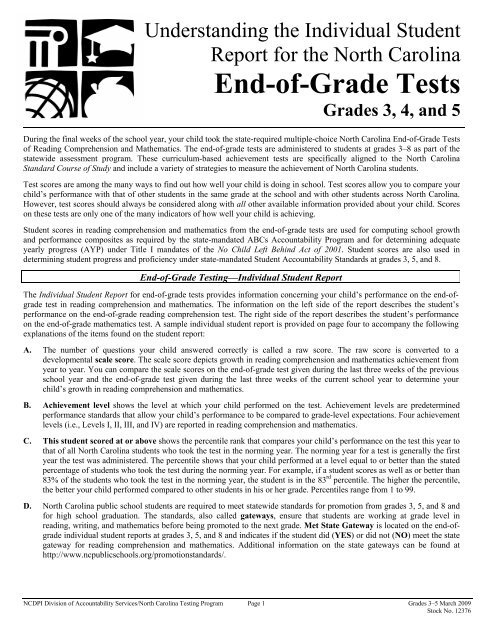
Understanding the Individual Student<br />
Report for the <strong>North</strong> <strong>Carolina</strong><br />
End-<strong>of</strong>-Grade Tests<br />
<strong>Grades</strong> 3, 4, and 5<br />
During the final weeks <strong>of</strong> the school year, your child took the state-required multiple-choice <strong>North</strong> <strong>Carolina</strong> End-<strong>of</strong>-Grade Tests<br />
<strong>of</strong> Reading Comprehension and Mathematics. The end-<strong>of</strong>-grade tests are administered to students at grades 3–8 as part <strong>of</strong> the<br />
statewide assessment program. These curriculum-based achievement tests are specifically aligned to the <strong>North</strong> <strong>Carolina</strong><br />
Standard Course <strong>of</strong> Study and include a variety <strong>of</strong> strategies to measure the achievement <strong>of</strong> <strong>North</strong> <strong>Carolina</strong> students.<br />
Test scores are among the many ways to find out how well your child is doing in school. Test scores allow you to compare your<br />
child’s performance with that <strong>of</strong> other students in the same grade at the school and with other students across <strong>North</strong> <strong>Carolina</strong>.<br />
However, test scores should always be considered along with all other available information provided about your child. Scores<br />
on these tests are only one <strong>of</strong> the many indicators <strong>of</strong> how well your child is achieving.<br />
Student scores in reading comprehension and mathematics from the end-<strong>of</strong>-grade tests are used for computing school growth<br />
and performance composites as required by the state-mandated ABCs Accountability Program and for determining adequate<br />
yearly progress (AYP) under Title I mandates <strong>of</strong> the No Child Left Behind Act <strong>of</strong> 2001. Student scores are also used in<br />
determining student progress and pr<strong>of</strong>iciency under state-mandated Student Accountability Standards at grades 3, 5, and 8.<br />
End-<strong>of</strong>-Grade Testing—Individual Student Report<br />
The Individual Student Report for end-<strong>of</strong>-grade tests provides information concerning your child’s performance on the end-<strong>of</strong>grade<br />
test in reading comprehension and mathematics. The information on the left side <strong>of</strong> the report describes the student’s<br />
performance on the end-<strong>of</strong>-grade reading comprehension test. The right side <strong>of</strong> the report describes the student’s performance<br />
on the end-<strong>of</strong>-grade mathematics test. A sample individual student report is provided on page four to accompany the following<br />
explanations <strong>of</strong> the items found on the student report:<br />
A. The number <strong>of</strong> questions your child answered correctly is called a raw score. The raw score is converted to a<br />
developmental scale score. The scale score depicts growth in reading comprehension and mathematics achievement from<br />
year to year. You can compare the scale scores on the end-<strong>of</strong>-grade test given during the last three weeks <strong>of</strong> the previous<br />
school year and the end-<strong>of</strong>-grade test given during the last three weeks <strong>of</strong> the current school year to determine your<br />
child’s growth in reading comprehension and mathematics.<br />
B. Achievement level shows the level at which your child performed on the test. Achievement levels are predetermined<br />
performance standards that allow your child’s performance to be compared to grade-level expectations. Four achievement<br />
levels (i.e., Levels I, II, III, and IV) are reported in reading comprehension and mathematics.<br />
C. This student scored at or above shows the percentile rank that compares your child’s performance on the test this year to<br />
that <strong>of</strong> all <strong>North</strong> <strong>Carolina</strong> students who took the test in the norming year. The norming year for a test is generally the first<br />
year the test was administered. The percentile shows that your child performed at a level equal to or better than the stated<br />
percentage <strong>of</strong> students who took the test during the norming year. For example, if a student scores as well as or better than<br />
83% <strong>of</strong> the students who took the test in the norming year, the student is in the 83 rd percentile. The higher the percentile,<br />
the better your child performed compared to other students in his or her grade. Percentiles range from 1 to 99.<br />
D. <strong>North</strong> <strong>Carolina</strong> public school students are required to meet statewide standards for promotion from grades 3, 5, and 8 and<br />
for high school graduation. The standards, also called gateways, ensure that students are working at grade level in<br />
reading, writing, and mathematics before being promoted to the next grade. Met State Gateway is located on the end-<strong>of</strong>grade<br />
individual student reports at grades 3, 5, and 8 and indicates if the student did (YES) or did not (NO) meet the state<br />
gateway for reading comprehension and mathematics. Additional information on the state gateways can be found at<br />
http://www.ncpublicschools.org/promotionstandards/.<br />
NCDPI Division <strong>of</strong> Accountability Services/<strong>North</strong> <strong>Carolina</strong> Testing Program Page 1 <strong>Grades</strong> 3–5 March 2009<br />
Stock No. 12376
E. Achievement levels show the four achievement levels and their relation to the scale score.<br />
F. Student shows your child’s score in relation to the range <strong>of</strong> possible scores and the achievement levels. Your child’s<br />
score is represented by a closed diamond (♦). The bar ( ) across the closed diamond represents where your child’s true<br />
score should be about two-thirds <strong>of</strong> the time (standard error <strong>of</strong> measurement). On another day or with a different set <strong>of</strong><br />
test questions, your child might have obtained a slightly different score, but the score should still lie within the bar,<br />
assuming no additional learning occurred.<br />
G-I.<br />
Your child’s scale score is compared to the average scale scores for the school (G), the school system (H), and the state<br />
(I). The average scale scores for G–I are represented as open diamonds (◊). The horizontal line (—) across each open<br />
diamond represents the range <strong>of</strong> scores achieved by about two-thirds <strong>of</strong> the students in the same grade as your child (one<br />
standard deviation). The average scale scores for the school and the school system are based on the spring 2008 test<br />
administration. The state average is based on the scores <strong>of</strong> all <strong>North</strong> <strong>Carolina</strong> students who took the test in the norming<br />
year.<br />
J. The description <strong>of</strong> the achievement level is reported for your child’s performance in reading comprehension and<br />
mathematics. A complete listing <strong>of</strong> the four achievement levels for reading comprehension and mathematics by grade<br />
level may be found at http://www.ncpublicschools.org/accountability/testing/shared/achievelevel/readingeog and<br />
http://www.ncpublicschools.org/accountability/testing/shared/achievelevel/matheog, respectively.<br />
K. The reading comprehension tests are linked to the Lexile Framework for Reading. The Lexile Framework measures both<br />
reader ability and text difficulty on the same scale, the Lexile scale. Lexile scores are reported from a low <strong>of</strong> BR<br />
(Beginning Reader) to a high <strong>of</strong> 2000L. Lexile scores do not translate specifically to grade levels. Using your child’s<br />
Lexile score, you can match your child to books or other reading material that are similar to his or her reading ability. The<br />
lower a book’s Lexile measure, the easier it will be to comprehend. For example, a text with a Lexile measure <strong>of</strong> 850L<br />
will most likely be easier for a reader to comprehend than a text at 950L. The Lexile score also allows you to track your<br />
child’s progress over time. Additional information on Lexiles can be found at http://www.lexile.com, and a list <strong>of</strong> books<br />
and their Lexile measures can be found at www.lexile.com/booksearch.<br />
L. The <strong>North</strong> <strong>Carolina</strong> Standard Course <strong>of</strong> Study is the framework that guides classroom instruction and assessment for<br />
every student in <strong>North</strong> <strong>Carolina</strong> and provides competency goals for each grade and high school course to ensure rigorous<br />
student academic performance standards that are uniform across the state. On this student report, the Subscale<br />
Performance section shows the subscale score for the goals and/or section reported for the end-<strong>of</strong>-grade tests <strong>of</strong> reading<br />
comprehension and mathematics. The reporting units for subscales <strong>of</strong> the end-<strong>of</strong>-grade test <strong>of</strong> reading comprehension are<br />
literary reading and informational reading. The reporting units for subscales <strong>of</strong> the end-<strong>of</strong>-grade test <strong>of</strong> mathematics are<br />
goals and units defined by calculator active portions <strong>of</strong> the test and calculator inactive portions <strong>of</strong> the test. The closed<br />
diamond (♦) represents your child’s performance at the individual goal level. The bar ( ) represents the standard error<br />
<strong>of</strong> measurement (SEM). The SEM indicates how much your child’s score is expected to vary if tested repeatedly with the<br />
same test, assuming that no additional instruction is given. The subscale scores do not reflect the number <strong>of</strong> items aligned<br />
to each goal and/or section. All subscale scores have values between 0 and 20. The state average for all subscales is<br />
equivalent to 10. Although the tests meet high pr<strong>of</strong>essional and legal technical standards as a whole, these technical<br />
attributes weaken when the test is taken apart into smaller units. In nearly all cases, the number <strong>of</strong> items on a test form that<br />
represents a single subscale is very small. Therefore, it is imperative that the subscale scores be used as only one piece <strong>of</strong><br />
information used to qualify instructional or placement decisions.<br />
Key Features <strong>of</strong> the Reading Comprehension Test<br />
‣ Reading and knowledge <strong>of</strong> vocabulary are assessed by having students read selections and then answer questions related to<br />
the selections.<br />
‣ The reading comprehension test at grades 3–5 consists <strong>of</strong> 52 items. Some <strong>of</strong> the reading comprehension items at grades 3–5<br />
are field test items. The field test items do not count toward or against the student’s score.<br />
‣ The selections on the test are reading materials chosen to reflect the variety <strong>of</strong> actual reading done by students in and out <strong>of</strong><br />
the classroom.<br />
‣ Students read literary selections (i.e., fiction, nonfiction, and poetry) and informational selections (i.e., content and<br />
consumer).<br />
‣ The variety <strong>of</strong> selections allows for the assessment <strong>of</strong> reading for various purposes: for literary experience, to gain<br />
information, and to perform a task.<br />
NCDPI Division <strong>of</strong> Accountability Services/<strong>North</strong> <strong>Carolina</strong> Testing Program Page 2 <strong>Grades</strong> 3–5 March 2009
How Can I Help My Child with Reading<br />
‣ Establish time for your child to read.<br />
‣ Provide your child with a variety <strong>of</strong> suitable reading materials.<br />
‣ Read aloud to and with your child.<br />
‣ Take time to discuss interesting books you and your child have read.<br />
‣ Model reading by reading a variety <strong>of</strong> materials yourself, such as newspapers, magazines, schedules, etc.<br />
‣ Discuss the purpose <strong>of</strong> different text types, such as fiction, letters, newspaper articles, journals, etc.<br />
‣ Share and discuss articles, diagrams, charts, illustrations, and maps with your child.<br />
‣ Ask your child open-ended questions that cannot be answered with a single word or a single phrase (e.g., Why How do<br />
you know Explain . . . Tell me about . . . Give me examples.)<br />
‣ Ensure that your child reads independently each day at a comfortable reading level. Reading materials should not be too<br />
hard or too easy in terms <strong>of</strong> subject matter and content.<br />
Key Features <strong>of</strong> the Mathematics Test<br />
‣ The mathematics test assesses student achievement in the five strands <strong>of</strong> the mathematics curriculum: (1) Number and<br />
Operations, (2) Measurement, (3) Geometry, (4) Data Analysis and Probability, and (5) Algebra.<br />
‣ Some <strong>of</strong> the mathematics items at grades 3–5 are field test items. The field test items do not count toward or against the<br />
student’s score.<br />
‣ The 82-item test (including field test items) is administered in two parts: Calculator Active (54 questions) and Calculator<br />
Inactive (28 questions).<br />
‣ Students are allowed to use calculators during the Calculator Active part (66%) <strong>of</strong> the test. Students are not allowed to use<br />
calculators during the Calculator Inactive part (34%) <strong>of</strong> the test.<br />
‣ The minimum (“at least”) calculator requirement for grades 3–5 is a four-function calculator with memory key.<br />
‣ The mathematics tests are administered on two consecutive days.<br />
‣ The estimated time for students at grades 3–5 to complete the mathematics—calculator active test is 135 minutes. Students<br />
who are not finished at the end <strong>of</strong> the estimated time may be given additional time. However, no administration <strong>of</strong> the<br />
mathematics—calculator active test at grades 3–5 may exceed four hours (240 minutes).<br />
‣ The estimated time for students at grades 3–5 to complete the mathematics—calculator inactive test is 60 minutes. Students<br />
who are not finished at the end <strong>of</strong> the estimated time may be given additional time. However, no administration <strong>of</strong> the<br />
mathematics—calculator inactive test at grades 3–5 may exceed two and one-half hours (150 minutes).<br />
How Can I Help My Child with Mathematics<br />
‣ “Do math” with your child at home as problem-solving partners. Use word problems. Have your child explain how he or<br />
she is solving the problems.<br />
‣ Make a list <strong>of</strong> all the ways your family uses mathematics at home:<br />
‣ Newspapers and weather reports include charts, graphs, data, and statistics.<br />
‣ Sporting events provide data and statistics.<br />
‣ The grocery store affords an opportunity for practicing measurement and estimation.<br />
‣ Recipes can be modified.<br />
‣ The changing seasons give an opportunity to examine temperature.<br />
‣ Road trips encourage map reading and distance, time, and gasoline mileage problems.<br />
‣ By “doing math” together, you will demonstrate that learning mathematics is fun.<br />
Additional Information<br />
For additional information on the end-<strong>of</strong>-grade tests, visit the NCDPI Division <strong>of</strong> Accountability Services/<strong>North</strong> <strong>Carolina</strong><br />
Testing Program Web site at http://www.ncpublicschools.org/accountability/testing/eog/.<br />
In compliance with federal laws, NC <strong>Public</strong> <strong>Schools</strong> administers all state-operated educational programs, employment<br />
activities and admissions without discrimination because <strong>of</strong> race, religion, national or ethnic origin, color, age, military<br />
service, disability, or gender, except where exemption is appropriate and allowed by law. Inquiries or complaints should be<br />
directed to:<br />
Dr. Rebecca Garland, Chief Academic Officer<br />
Academic Services and Instructional Support<br />
6368 Mail Service Center<br />
Raleigh, NC 27699-6368<br />
Telephone (919) 807-3200; Fax (919) 807-4065<br />
NCDPI Division <strong>of</strong> Accountability Services/<strong>North</strong> <strong>Carolina</strong> Testing Program Page 3 <strong>Grades</strong> 3–5 March 2009
Student<br />
Grade Level<br />
School Name<br />
System Name<br />
3<br />
A<br />
B<br />
A<br />
B<br />
C<br />
D<br />
C<br />
D<br />
E<br />
I<br />
F<br />
G<br />
H<br />
E<br />
I<br />
F<br />
G<br />
H<br />
J<br />
J<br />
SAMPLE<br />
K<br />
Student’s Reported<br />
Lexile Score<br />
L<br />
Goals/Units<br />
Literary Reading<br />
Informational Reading<br />
965L<br />
Grade Three Lexile<br />
Text Measures<br />
500L-700L<br />
“Lexile Text Measures” describes the range <strong>of</strong> Lexile measures found<br />
in a national sample <strong>of</strong> texts collected from grade 3 classrooms.<br />
Information on Lexiles can be found at:<br />
http://www.ncpublicschools/org/accountability/parents/lexiles/<br />
End-<strong>of</strong>-Grade Reading<br />
Subscale Performance 1<br />
0 5 10 15 20 2<br />
L<br />
Goals/Units<br />
Calculator Active<br />
Calculator Inactive<br />
Model, identify, and compute with<br />
whole numbers through 9,999<br />
Standard units <strong>of</strong> metric and<br />
customary measurement<br />
Use basic geometric properties <strong>of</strong><br />
two - and three - dimensional figures<br />
Understand and use data and<br />
simple probability concepts<br />
Recognize, determine, and<br />
represent patterns and simple<br />
mathematical relationships<br />
End-<strong>of</strong>-Grade Mathematics<br />
Subscale Performance 1<br />
0 5 10 15 20 2<br />
1 Please note that the subscale scores are less reliable than the scale score because there are fewer questions on which the<br />
score is based. Therefore, instructional and placement decisions should not be based solely on these subscale scores.<br />
2 The state average for all subscales is equivalent to 10. The subscale scores do not reflect the number <strong>of</strong> items aligned to<br />
each goal. All subscale scores have values between 0 and 20.<br />
For a publication explaining the individual student report visit: http://www.ncpublicschools.org/accountability/testing/shared/abriefs/eogreadmath