The Evolving Global Talent Pool Lessons from the BRICS Countries
The Evolving Global Talent Pool Lessons from the BRICS Countries
The Evolving Global Talent Pool Lessons from the BRICS Countries

You also want an ePaper? Increase the reach of your titles
YUMPU automatically turns print PDFs into web optimized ePapers that Google loves.
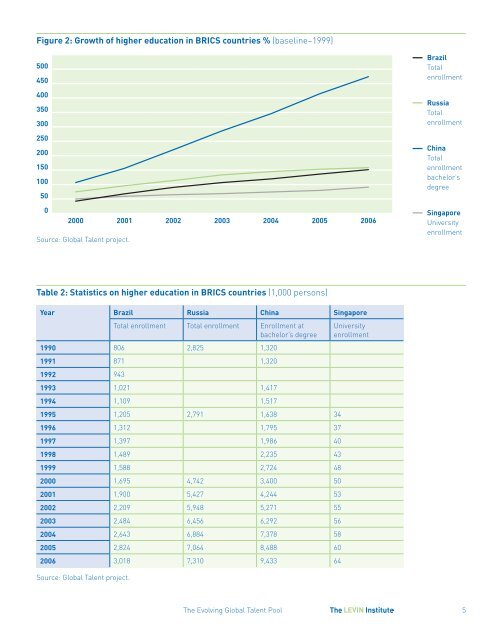
Figure 2: Growth of higher education in <strong>BRICS</strong> countries % (baseline–1999)<br />
500<br />
450<br />
400<br />
350<br />
300<br />
250<br />
200<br />
150<br />
100<br />
50<br />
0<br />
2000 2001 2002 2003 2004 2005 2006<br />
Source: <strong>Global</strong> <strong>Talent</strong> project.<br />
Brazil<br />
Total<br />
enrollment<br />
Russia<br />
Total<br />
enrollment<br />
China<br />
Total<br />
enrollment<br />
bachelor’s<br />
degree<br />
Singapore<br />
University<br />
enrollment<br />
Table 2: Statistics on higher education in <strong>BRICS</strong> countries (1,000 persons)<br />
Year Brazil Russia China Singapore<br />
Total enrollment Total enrollment Enrollment at<br />
bachelor’s degree<br />
1990 806 2,825 1,320<br />
1991 871 1,320<br />
1992 943<br />
1993 1,021 1,417<br />
1994 1,109 1,517<br />
1995 1,205 2,791 1,638 34<br />
1996 1,312 1,795 37<br />
1997 1,397 1,986 40<br />
1998 1,489 2,235 43<br />
1999 1,588 2,724 48<br />
2000 1,695 4,742 3,400 50<br />
2001 1,900 5,427 4,244 53<br />
2002 2,209 5,948 5,271 55<br />
2003 2,484 6,456 6,292 56<br />
2004 2,643 6,884 7,378 58<br />
2005 2,824 7,064 8,488 60<br />
2006 3,018 7,310 9,433 64<br />
Source: <strong>Global</strong> <strong>Talent</strong> project.<br />
University<br />
enrollment<br />
<strong>The</strong> <strong>Evolving</strong> <strong>Global</strong> <strong>Talent</strong> <strong>Pool</strong><br />
5