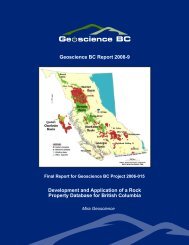
Report - Geoscience BC
Report - Geoscience BC
Report - Geoscience BC

You also want an ePaper? Increase the reach of your titles
YUMPU automatically turns print PDFs into web optimized ePapers that Google loves.
Rock physical property measurements to aid geophysical surveys<br />
in the Nechako Basin oil and gas region, central British Columbia<br />
Graham Andrews 1 , Steve Quane 2 , Randolph J. Enkin 3 , Kelly Russell 1 , Alexandra Kushnir 4 , Lori<br />
Kennedy 4 , Nathan Hayward 5 , Michael Heap 6 ,<br />
1 Volcanology and Petrology Lab, Department of Earth and Ocean Sciences, University of British<br />
Columbia, Vancouver, British Columbia, V6T 1Z4; 2 Quest University Canada, 3200 University<br />
Boulevard, Squamish, British Columbia, V8B O8N; 3 Geological Survey of Canada, P.O. Box<br />
6000, Sidney, British Columbia, V8L 4B2, 250-363-6431, Randy.Enkin@NRCan.gc.ca; 4 Centre<br />
for Experimental Studies of the Lithosphere, Department of Earth and Ocean Sciences,<br />
University of British Columbia, Vancouver, British Columbia, V6T 1Z4, 5 Geological Survey of<br />
Canada, 625 Robson Street, Vancouver, British Columbia, V6B 5J3; 6 Laboratoire de<br />
Géophisique Expérimentale, Institut de Physique de Globe de Strasbourg (UMR 7516 CNRS,<br />
Université de Strasbourg/EOST) 5 rue René Déscartes, 67084 Strasbourg cédex, France<br />
Executive Summary<br />
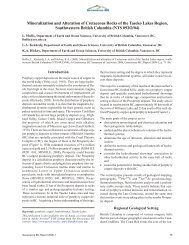
Miocene and younger basalts (e.g., Chilcotin Group) and Eocene to Jurassic age volcanic and<br />
sedimentary rocks (e.g., Endako Group, Ootsa Lake Group, Taylor Creek Group) underlie<br />
significant portions of the Interior Plateau and Nechako Basin of central British Columbia (Fig.<br />
1). There is potential for unexploited hydrocarbon and base metal resources underlying these<br />
younger volcanic and sedimentary successions, making this area of significant economic interest.<br />
Geophysical surveys (both seismic reflection and magnetotellurics), funded by <strong>Geoscience</strong> <strong>BC</strong><br />
and the Geological Survey of Canada, have concentrated on (1) portions of the Nechako Basin<br />
for hydrocarbon potential within Jurassic and Cretaceous sedimentary rocks (Ferri & Riddell;<br />
2006; Riddell, 2006; Riddell et. al 2007) and (2) portions of the Interior Plateau for base metal<br />
exploration. To help interpret variations in geophysical signals, we have measured the<br />
geophysical properties (density, porosity, magnetic susceptibility and remanence, electrical<br />
resistivity and chargeability, and seismic velocity) for 107 samples of the key lithologies of the<br />
Nechako Basin. This report was funded by <strong>Geoscience</strong> <strong>BC</strong> to aid in processing raw seismic and<br />
magnetotelluric data with the intention of extracting more accurate geophysical images of the<br />
subsurface and delineation of exploration targets.
1.0 Introduction<br />
The Mesozoic Nechako Basin in south-central British Columbia has under explored<br />
potential for oil and gas deposits hosted in Cretaceous strata (Hayes, 2002). First-order<br />
geological interpretations of the subsurface are hampered by the Nechako Basin’s structural<br />
complexity, which results from extensive poly-phase deformation and partial burial beneath<br />
significant extents of Cenozoic volcanic, volcaniclastic, and sedimentary rocks. The lack of<br />
continuity in outcrop and stratigraphy has hindered reconstructions of the basin and efforts to<br />
identify potential hydrocarbon traps. In an effort to address this, <strong>Geoscience</strong> <strong>BC</strong> and the<br />
Geological Survey of Canada have funded multi-million dollar geophysical survey programs<br />
(including seismic reflection, gravimetric, and magnetotelluric studies) and a reassessment of<br />
existing geophysical data sets across portions of the Interior Plateau (e.g., Spratt et al., 2007;<br />
2009; Hayward, 2008; Idowu et al., 2009; Kim et al., 2009). Interpretation of these surveys is<br />
made difficult by a lack of physical rock property data from the corresponding rocks within the<br />
Nechako Basin and a fragmentary understanding of even the near-surface geology. Establishing<br />
the extent of buried Cenozoic volcanic rocks and distinguishing them from buried and deformed<br />
Mesozoic successions is particularly challenging.<br />
<strong>Geoscience</strong> <strong>BC</strong> funded an investigation of the rock physical properties of the Nechako<br />
Basin to provide physical and geophysical measurements on rock samples representative of the<br />
geological formations underlying the Nechako Basin. These measurements include bulk density,<br />
connected porosity, magnetic susceptibility, magnetic remanence, Koenigsberger ratio, electrical<br />
resistivity, chargeability and seismic velocity. All measurements were performed at the Centre<br />
for Experimental Study of the Lithosphere, under the guidance of Dr. J.K. Russell and Dr. Lori<br />
Kennedy at the University of British Columbia; at the Paleomagnetism and Petrophysics<br />
Laboratory at the Geological Survey of Canada – Pacific under the guidance of Dr. Randolph<br />
Enkin; and at la Laboratoire de Géophysique Expérimentale under the guidance of Dr. Michael<br />
Heap at l’Université de Strasbourg, France. The complete dataset of physical and geophysical<br />
measurements is compiled in the spreadsheet G<strong>BC</strong>Rpt2011-10-Nechako_RxPhys_Database.xls.<br />
The purpose of this document is to provide explanatory notes and information on the methods<br />
used at each laboratory to make the physical measurements and is intended strictly as a<br />
supplement to the measurement database; it is not a stand-alone document, nor is it intended to<br />
provide any scientific analysis of the dataset.
2.0 Geology of the Nechako Basin<br />
The Interior Plateau is underlain by rocks belonging to the Intermontane Belt and, at its<br />
western boundary, is underlain mostly by the Coast Belt. The Plateau is predominantly ‘covered’<br />
by young volcanic rocks (i.e., Chilcotin Basalts) and Quaternary deposits. Beneath this cover, an<br />
inferred Jurassic-Cretaceous marine basin assemblage (i.e., the Nechako Basin) is overlain by<br />
Eocene volcanic and sedimentary successions deposited into a complex array of transtensional<br />
basins. The Jurassic-Cretaceous sequence has been a suspected hydrocarbon reserve since the<br />
1960s (Hannigan et al., 1994; Ferri & Riddell, 2006).<br />
The Nechako Basin is an approximately 75,000 km 2 area bounded to the south and west<br />
by the Coast Mountains, to the north by the Skeena Arch, and to the east by the Bonaparte<br />
Plateau and Cariboo Mountains (Fig. 1; Hayes, 2002; Riddell, 2006). It underlies much of the<br />
Present-day Fraser River Basin, including important tributaries such as the Chilcotin, Chilko, and<br />
Taseko Rivers. It is interpreted to have developed as a foreland basin during the Late Jurassic to<br />
Middle Cretaceous on basement comprised of integral parts of the Intermontane superterrane,<br />
namely the Cache Creek and Stikine terranes. Stikine terrane basement is present at the surface<br />
in the west and north of the Basin (Riddell, 2006) where it is represented by the Early-Middle<br />
Jurassic Hazelton volcanic arc (Hazelton Group). Oceanic rocks of the Cache Creek terrane rocks<br />
outcrop in the east and northeast.<br />
The Nechako Basin was filled by clastic sedimentary rocks in the Middle Jurassic<br />
(Ladner Group) and into the Early Cretaceous (Relay Mountain Group). Clastic marine<br />
sedimentation continued through the Cretaceous: the Hauterivian-Cenomanian Jackass Mountain<br />
Group, the Albian Taylor Creek and Skeena Groups, and the Albian-Cenomanian Silverquick<br />
Formation. Clastic sedimentation was interspersed with deposition of volcanic and volcaniclastic<br />
rocks of the Albian to Santonian Spences Bridge and Kasalka Groups, and the Turonian-<br />
Campanian Powell Creek volcanics and informally named Taseko River strata. All appreciable<br />
hydrocarbon potential is within the Cretaceous succession. Fig. 2 provides a generalized and<br />
schematic stratigraphic summary of the Nechako Basin.<br />
The Nechako Basin is extensively buried beneath 0 to 4000 m of Eocene, Miocene and<br />
Pliocene volcanic, volcaniclastic and sedimentary rocks belonging, chiefly, to the Endako, Ootsa<br />
Lake and Chilcotin Groups (Riddell, 2006). A diverse range of mafic and felsic volcanic and<br />
volcaniclastic rocks occur, including ash-flow tuffs indicative of caldera-forming eruptions. The
Pliocene to Holocene Anahim volcanic belt extends from west to east across the centre of the<br />
Basin. There are numerous Mesozoic and Cenozoic plutons intruded into the Basin. The Nechako<br />
Basin and overlying Cenozoic rocks are extensively buried beneath a 1 to 100 m thick veneer of<br />
glacial sediments (including till), glaciolacustrine and glaciofluvial successions. There is no<br />
inferred hydrocarbon resource in the Cenozoic succession.<br />
The structural geology of the Nechako Basin is not understood and, therefore, the<br />
architecture of potential hydrocarbon traps has not been established. Preliminary geophysical<br />
surveys have identified sub-basins, high- and low-angle faults, folds, and unconformities;<br />
however a lack of stratigraphic control due to the paucity of boreholes in the Basin makes lateral<br />
correlation and section-balancing impossible. A dedicated rock property suite from the known<br />
Nechako Basin stratigraphy will allow for improved geophysical imaging of the sub-surface<br />
geology.<br />
3.0 Previous Work<br />
During the 1980s, Canadian-Hunter exploration conducted a seismic reflection and<br />
gravity survey in the Nechako Basin and drilled some additional exploration wells. The seismic<br />
datasets have been reprocessed by Hayward and Calvert (SFU) to provide clearer imaging of<br />
subsurface structure and stratigraphy (2007-09). In addition, new vibroseis seismic reflection<br />
datasets were collected in 2008. The quality of imaging of the old dataset is relatively poor. As<br />
such, there is a pressing need to have a better constraint on the velocity structure of the diverse<br />
suite of volcanic and sedimentary rocks in the Nechako Basin. The physical and seismic<br />
properties collected will find use in refining and modeling the newly acquired seismic datasets.<br />
At the informal Nechako Basin workshop hosted by Andy Calvert at Simon Fraser<br />
University in late February 2009, the importance of having high quality data on seismic<br />
velocities and electrical resistivities from a large, geographically extensive sample suite was<br />
identified as a critical element of the interpretation of geophysical datasets, particularly given<br />
some ambiguous results and uncertainties in the surface geology. Jim Craven’s (GSC Ottawa)<br />
and Jessica Spratt's (<strong>Geoscience</strong> <strong>BC</strong> and GSC Ottawa) magnetotelluric studies have highlighted<br />
the need for good resolution in electrical resistivities data to differentiate the widespread<br />
Cretaceous and Eocene sequences. Similarly, seismic inversions (Calvert) suggest non-intuitive<br />
variations in compressional wave velocities for individual formations, specifically overlap in<br />
inferred seismic velocities between the Eocene and Jurassic-Cretaceous successions.<br />
Quantitative experimental data from the provided dataset will aid the interpretations of these
surveys and distinguish the prospective, non-hydrocarbon Eocene basinal sequence from the<br />
Jurassic-Cretaceous basinal sequence.<br />
4.0 Methods for Measurement of Physical & Geophysical Rock Properties<br />
Our experimental program focused on stratigraphic units that are most important to the<br />
interpretation of seismic datasets and the delineation of exploration targets within the Nechako<br />
Basin. These stratigraphic packages include:<br />
A) Eocene Volcanic and Sedimentary Rocks: These deposits are highly variable in thickness<br />
(absent to greater than 1000 meters) and, in part, cover the Jurassic and Cretaceous rocks which<br />
form the Nechako Basin. These stratigraphic units blanket, obscure, and complicate the<br />
interpretation of structure and stratigraphy of the Jurassic source rocks and Cretaceous reservoir<br />
rocks. Specific lithological packages studied include:<br />
i) the Endako Group: coherent, mafic, volcanic lavas that need to be distinguished<br />
from Chilcotin group rocks;<br />
ii) the Ootsa Lake Group:<br />
a. Volcaniclastic facies: a series of felsic volcaniclastic rocks and associated<br />
sedimentary rocks that exhibit bedding, and are difficult to discriminate<br />
geophysically from older Cretaceous volcaniclastic and sedimentary<br />
successions;<br />
b. Coherent facies: intermediate to felsic lavas and lava domes, which need to<br />
be discriminated against Endako Group lavas.<br />
B) Upper Cretaceous Volcaniclastic and Sedimentary Rocks: These rocks represent the potential<br />
hydrocarbon reservoir rocks within the Nechako Basin and are strongly bedded, weakly<br />
deformed and of exceptionally variable thickness. The lateral continuity of stratigraphy has not<br />
yet been fully resolved (Ferri & Riddell, 2006) and, therefore, it is necessary to sample several<br />
units in different locations, acknowledging that they may represent lateral facies variations of<br />
each other. Our experimental program has characterized the geophysical properties of the<br />
following lithological packages:<br />
i) Jackass Mountain Group: coarse-grained clastic sedimentary rocks inferred to be the<br />
most likely surface correlative of the subsurface Skeena Assemblage, which has been identified<br />
as the most significant potential reservoir in the Nechako Basin (Mustard & Mahoney, 2007).
The Jackass Mountain Group is best exposed and studied along the southern margin of the<br />
Nechako Basin near Taseko Lake;<br />
ii) Taylor Creek Group & Skeena Group: clastic sedimentary rocks and minor volcanic<br />
rocks exposed along and encountered in the subsurface of the Nazko River area;<br />
iii) Spences Bridge Group: intermediate lavas and tuffs, and minor sedimentary rocks<br />
exposed in the southern Nechako Basin;<br />
iv) Kasalka Group, Powell Creek Group & “Taseko River Strata”: intermediate lavas and<br />
tuffs, associated clastic sedimentary rocks (including conglomerates and sandstones in “Taseko<br />
Rive Strata”) found in many areas across the Basin; this is likely a very extensive sequence.<br />
C) Middle-Late Jurassic Sedimentary Rocks: the likely source rocks for hydrocarbon reserves in<br />
the Nechako Basin; these units probably form the lowermost parts of the basinal sequence:<br />
i) Ladner Group: fine to coarse-grained calcareous clastic rocks and carbonates. These<br />
are best exposed around Chilko Lake in the southern Nechako Basin;<br />
ii) Relay Mountain Group: fine to coarse-grained clastic and carbonaceous rocks<br />
underlying the Jackass Mountain Group, best exposed in the Nemaiah Valley and Chilko Lake<br />
areas of the southern Nechako Basin.<br />
D) Basement Rocks: Ultimately, the Nechako Basin is underlain by Permian, Triassic and<br />
Jurassic rocks of the Cache Creek and Stikine terranes, and Jurassic to Eocene age intrusions.<br />
These rocks tend to be more homogeneous in character and more easily differentiated against the<br />
overlying Cretaceous and Eocene stratigraphy. The more abundant of these stratigraphic units<br />
include:<br />
i) Jurassic-Cretaceous intrusive rocks (e.g., Taseko River);<br />
ii) Lower/Mid-Jurassic Hazelton Group: intermediate to felsic lavas and tuffs, minor<br />
clastic and carbonate sedimentary rocks (e.g., Puntzi Lake & west of Nechako), and;<br />
iii) Mid-Triassic Cache Creek Group: limestone, chert, clastic sediments, metamorphic,<br />
basalt (e.g., Blackwater River, Hanceville).<br />
A suite of more than 100 rock samples from formations representing the key Mesozoic<br />
and Eocene lithologies/stratigraphic units within the Nechako Basin was collected and from this<br />
collection 107 samples were chosen for experimental work to be performed at U<strong>BC</strong>, GSC-Pacific<br />
Centre and EOST Strasbourg. Our database of geophysical properties includes: density, porosity,<br />
magnetic susceptibility, remanent magnetization, electrical resistivity, chargeability and seismic
wave velocities. These measurements are made available through <strong>Geoscience</strong> <strong>BC</strong> in tabulated<br />
and map-based formats and are intended to aid in the reduction and interpretation of data from<br />
seismological, magnetotelluric, and airborne geophysical surveys. This database will, in turn, be<br />
able to be integrated into other provincial and national rock property databases (e.g., Parsons et<br />
al., 2009).<br />
The Nechako sample suite comprises rock samples of various lithologies, sampled from<br />
11 distinct stratigraphic units distributed across the Nechako Basin. In total, 107 samples were<br />
collected. A 25mm diameter cylindrical core was taken from each sample. The ends of each core<br />
were ground and polished at right angles to the cylinder side to create a perfectly smooth<br />
(~0.02mm precision) end surface. The polished ends are particularly important to the<br />
experimental measurement of seismic velocity because: i) they provide a perfect sample<br />
geometry, and ii) they ensure that there is good contact between the seismic velocity transducer<br />
endcaps and the sample.<br />
All sample preparation (e.g., cleaning, trimming, coring, drying) was done at U<strong>BC</strong> with<br />
some modification at EOST, Strasbourg. Different sets of geophysical properties were measured<br />
on the same sample cores by both J.K. Russell’s team at CESL (U<strong>BC</strong>) and EOST, Strasbourg<br />
and by Randy Enkin’s team at the GSC-Pacific (GSC-P). Specifically, for each sample measured:<br />
1) bulk density (EOST),<br />
2) porosity (EOST),<br />
3) magnetic susceptibility (U<strong>BC</strong> & GSC-P),<br />
4) remanent magnetization (GSC-P),<br />
5) electrical resistivity (GSC-P),<br />
6) induced polarization chargeability (GSC-P) and<br />
7) seismic wave velocities (EOST).<br />
Density and Porosity<br />
Bulk densities ( ! d<br />
) involve the direct measurement of sample mass and volume and are<br />
calculated using the following expression:<br />
(1)<br />
! d<br />
= m d<br />
V
where m d<br />
is the mass of the vacuum dried sample measured in air and V is the sample volume.<br />
The values of ! d<br />
are the density of the total sample (i.e. rock plus pores). The framework<br />
density ( ! f<br />
) is the density of the rock and isolated pore space alone and is computed using the<br />
wet/dry method for determining density. The method is also known as the Hydrostatic Weighing<br />
(Displacement method) and is derived from Archimedes’ Buoyancy law. After the dry masses<br />
were determined, all samples were vacuum saturated for a minimum of 15 hours to allow water<br />
to fill any pore spaces within the sample. The mass of the water-saturated sample was then<br />
weighed in air ( m w<br />
) and after it was fully submerged in water ( m b<br />
). ‘Wet’ bulk densities ( ! w<br />
)<br />
were calculated for all water-saturated samples using m w<br />
and reflect the density of the rock,<br />
isolated pore space and water saturated pore space. These values are necessary for determination<br />
of ‘wet’ seismic velocity.<br />
The density of the rock framework (plus any remaining isolated pores) was then<br />
computed using the following relationship:<br />
(2)<br />
m d<br />
! f<br />
= ! H 2 O<br />
m d<br />
" m b<br />
where ! H2 O is the density of the water at lab conditions. These two values of density ( ! d and<br />
! f<br />
) allow an indirect estimation of porosity (%):<br />
(3)<br />
! = m w " m d<br />
m w<br />
" m b<br />
*100<br />
Table 1. Maximum and minimum values of density and porosity for the Nechako Basin sample<br />
suite.<br />
Maximum Value<br />
Minimum Value<br />
Bulk Density (Dry) (g/m 3 ) 2.89 1.87<br />
Bulk Density (Wet) (g/m 3 ) 2.90 2.16<br />
Wet/Dry Density (g/m 3 ) 3.02 2.45<br />
Porosity (%) 30.06 0.19
Magnetic Susceptibility<br />
Magnetic susceptibility was measured on hand samples in the lab using a GF Instruments<br />
SM-20 pocket magnetic susceptibility meter, with a sensitivity of 10 -6 SI volume units. The<br />
measurement coil has a 5 cm diameter, and ~90% of the measured response comes from the top 2<br />
cm of the sample. We investigated the effect of small sample size on the measurements and<br />
found that samples more than 3 cm thick allow accurate magnetic susceptibility determinations.<br />
Usually 3 measurements were taken on different surfaces of the sample and the average is<br />
reported. The standard deviation of the 3 measurements is typically 10% due to spatial variations<br />
of magnetite concentration. Susceptibility measurements on cores were measured with a<br />
Sapphire SI2B susceptibility meter, accurate to 10 -7 SI. These measurements were used in<br />
preference to the SM-20 measurements.<br />
Table 2. Maximum and minimum values of magnetic susceptibility for the Nechako Basin<br />
sample suite.<br />
Maximum Value<br />
Minimum Value<br />
Magnetic Susceptibility (SI) 5.40 x 10 -2 2.79 x 10 -5<br />
Magnetic remanence and Koenigsberger ratio<br />
Magnetic remanence was measured using an AGICO JR5-A spinner magnetometer<br />
(sensitivity 10 -5 A/m). The full vector was measured, but only the total vector magnitude of the<br />
remanence is reported in the database.<br />
The Koenigsberger ratio (K N ) compares the relative strength of the natural remanent<br />
magnetization (NRM) to the induced magnetism in the geomagnetic field: K N = NRM / ( H 0 χ 0 ),<br />
where χ 0 is the magnetic susceptibility and the geomagnetic field strength (H 0 ) is approximated<br />
as a constant 40 A/m (or µ 0 H 0 = 50 µT = 50000 γ). When K N is above 1, then magnetic anomaly<br />
interpretation will be incorrect if magnetic remanence is not taken into consideration.<br />
Table 3. Maximum and minimum values of magnetic remanence and Koenigsberger ratio for the<br />
Nechako Basin.<br />
Maximum Value<br />
Minimum Value<br />
NRM (A/m) 27.7 2.57 x 10 -4<br />
K N 45.4 9.99 x 10 -3
Electrical Resistivity and Chargeability<br />
Complex electrical impedance frequency spectra were measured using a Solartron 1260<br />
Impedance Spectrum Analyser, based on the method of Katsube (2001). Sample cylinders were<br />
vacuum impregnated in distilled water and allowed to soak for at least 24 hours, to allow original<br />
ground water solutes precipitated in the sample porosity to dissolve and approximate original<br />
ground water conductivity. The impedance was measured with 5 frequencies per decade from 1<br />
MHz to 0.03 Hz. The scalar resistance was picked as the real impedance at the frequency which<br />
displays minimum imaginary impedance, typically around 1000 Hz. Resistivity [Ohm.m] is this<br />
resistance times the sample geometric factor, the cross section area divided by the length.<br />
Conductivity [Mho/m] is the reciprocal of the resistivity.<br />
Induced Polarization Chargeability is calculated after converting the frequency domain<br />
impedance spectrum to the time domain response to a step function, V (t)<br />
. Using the Newmont<br />
Standard, the chargeability (Sumner, 1976) is:<br />
t 1100ms<br />
(4) m = V ( t)<br />
dt V (0)<br />
T ∫ = t=<br />
440ms<br />
Table 4. Maximum and minimum values of electrical resistivity for the Nechako Basin sample<br />
suite.<br />
Maximum Value<br />
Minimum Value<br />
Electrical Resistivity (Ohm.m) 4.99 x 10 4 36.8<br />
Chargeability (ms) 55.6 1.44 x 10 -2<br />
Wet/Dry Seismic Wave Velocity Determination<br />
The values of V P are most important to the ongoing seismic surveys because the inversions<br />
of the seismic survey data are based on V P alone; values of shear wave velocities (V S ) are more<br />
difficult to invert for. It is unknown what the pore fluid pressures magnitudes are within the<br />
Nechako Basin, however, pore fluid pressure exerts a significant influence on geophysical<br />
seismic reflection and thus we feel that these measurements will be relevant.<br />
Dry and wet ultrasonic measurements were made on all cores. ‘Dry’ samples were dried<br />
under vacuum at 40°C for at least 24 hours. Subsequently, ‘wet’ ultrasonic measurements were
made on all samples after being vacuum saturated with agitated, deionized, distilled water for at<br />
least 15 hours.<br />
Two fundamental body wave types travel through material: P- (compressional) waves and<br />
S- (shear) waves. For P-waves, material moves parallel to the direction of propagation, while for<br />
S-waves, material moves in a plane perpendicular to the direction of wave propagation. For<br />
energy to travel through a given elastic material, there must be a resulting restoring force that<br />
resists deformation. For instance, when a material experiences strain, strain must be<br />
accommodated by a change in shape of the material. Because fluids cannot sustain a shear force,<br />
S-waves do not propagate through fluids. P-wave arrivals are always precursory to S-wave<br />
arrivals and are therefore easiest to identify. Knowing the P- and S-wave velocities,<br />
V and V<br />
P S<br />
,<br />
respectively, passing through a given rock sample, one can characterize the material in terms of<br />
its elastic moduli: Poisson’s ratio and Young’s modulus. Measurements on both wet and dry<br />
samples were performed to return acoustic wave velocities in wet and dry materials.<br />
P- and S-wave arrival times were measured using a bench top apparatus at the<br />
Laboratoire de Géophysique Expérimentale (l’Université de Strasbourg, France). Measurements<br />
were made using an Agilent Technologies DSO5012A digital storage oscilloscope, an Agilent<br />
Technologies 33210A, 10 MHz function/waveform generator and two broadband PZT<br />
piezoelectric transducer crystals (100 kHz to 1 MHz frequency) located at the top and bottom of<br />
the sample. Measurements were made under a force of 600 N to ensure a good contact between<br />
the endcaps and the sample ends. P-wave measurements were made on samples using a<br />
frequency of 700 kHz; S-wave measurements were made at a frequency of 300 kHz.<br />
Table 5. Maximum and minimum values of seismic velocities for the Nechako Basin sample<br />
suite under wet and dry laboratory conditions.<br />
Maximum Value<br />
Minimum Value<br />
Vp (Dry) (km/s) 6.17 1.65<br />
Vs (Dry) (km/s) 4.04 1.04<br />
Vp (Wet) (km/s) 6.63 3.02<br />
Vs (Wet) (km/s) 4.10 1.47<br />
P-wave arrivals were chosen as the first easily identified signal following the triggering<br />
pulse from the function generator. S-wave arrivals were more difficult to identify, but<br />
significantly easier for wet samples. A significant change in signal amplitude or a distinct<br />
inflection point in the slope of the signal identified S-wave arrivals.
Elastic Moduli Calculation<br />
Hooke’s Law describes elastic extension:<br />
(5) ! = E"<br />
where ! is the normal stress and ! is the elongation or normal strain. Young’s modulus, E, is<br />
the coefficient of proportionality and is the ratio of uniaxial stress to uniaxial strain; for most<br />
rocks, E has values between 10 and 80 GPa.<br />
Poisson’s ratio is the ratio between the extension and contraction of a material under<br />
uniaxial tension. Most rocks have Poisson’s ratios less than 0.5, generally 0.1 to 0.3.<br />
Incompressible materials exhibit conservation of volume, therefore, for these materials Poisson’s<br />
ratio equals 0.5.<br />
Using calculated P- and S-wave velocities, dynamic Poisson’s ratio (! d<br />
) and Young<br />
modulus ( E d<br />
) are computed:<br />
(6)<br />
and<br />
(7)<br />
!<br />
E d<br />
" d<br />
= V 2 2<br />
p<br />
# 2V s<br />
2(V 2 p<br />
# V 2 s<br />
)<br />
= " V 2 s<br />
(3V 2 p<br />
# 4V 2 s<br />
)<br />
V 2 2<br />
p<br />
# V s<br />
where ! is the bulk density of the sample (g/m 3 ).<br />
!
Table 6. Maximum and minimum values of the elastic moduli for the Nechako Basin sample<br />
suite under wet and dry laboratory conditions.<br />
Maximum Value<br />
Minimum Value<br />
Poisson’s Ratio (Dry) 0.41 -0.16<br />
Poisson’s Ration (Wet) 0.45 0.03<br />
Young’s Modulus (Dry) (GPa) 96.54 5.21<br />
Young’s Modulus (Wet) (GPa) 94.08 13.87<br />
V P /V S (Dry) 2.53 1.33<br />
V P /V S (Wet) 3.30 1.43<br />
Results<br />
Values from all the rock physical property measurements made in this study are<br />
compiled in the spreadsheet G<strong>BC</strong>Rpt2011-10-Nechako_rxPhys_Database.xls. As expected,<br />
different geologic units show different absolute values and different amounts of variance in each<br />
property. For example, the diverse volcanic and volcaniclastic Eocene Ootsa Lake unit (basalt<br />
lava flows to volcaniclastic sediments) shows a much greater scatter in rock physical properties<br />
than the much more uniform Ladner formation (sandstones and shales). These extensive and<br />
high-quality datasets will be incorporated into <strong>Geoscience</strong> <strong>BC</strong>’s digital database and promise to<br />
aid geophysical interpretation of these key exploration targets in central British Columbia.<br />
Multi-parameter plots featuring data from each stratigraphic unit are presented to demonstrate<br />
significant correlations (Figs. 3 through 23).<br />
Acknowledgements<br />
This study was supported by <strong>Geoscience</strong> <strong>BC</strong> project grant 2008-028 and GSC Contract #23254-<br />
096844-001-VAN awarded to JKR. We thank Janet Riddell, Bert Struik, Mitch Mihalynuk, Kate<br />
MacLaurin, and Peter Mustard, for providing us with their archived samples. Sample preparation<br />
at U<strong>BC</strong> was conducted by Peter Van de Reep and Harmanpreet Dhillon. Hayley Linton and<br />
Ashley Tkachyk performed the lab-work at the Geological Survey of Canada. Figure 1 was<br />
created by Fion Ma of <strong>Geoscience</strong> <strong>BC</strong>.
References Cited<br />
Hayes, B.J., 2002. Petroleum exploration potential of the Nechako Basin, British Columbia. B.C.<br />
Ministry of Energy, Mines and Petroleum Resources, Petroleum Geology Special Paper 2002-3.<br />
Katsube, T.J., 2001. An analytical procedure for determining spectral induced polarization<br />
characteristics of anisotropic rocks, Yellowknife mining district, Northwest Territories.<br />
Geological Survey of Canada, Current Research 2001-E3, 2001; 29 pages<br />
Riddell, J.M., 2006. Geology of the southern Nechako Basin. British Columbia Ministry of<br />
Energy, Mines and Petroleum Resources, Oil and Gas Division, Petroleum Geology Map 2006-1,<br />
scale 1:400 000.<br />
Sumner, J.S. 1976. Principles of Induced Polarization for Geophysical Exploration. Elsevier<br />
Scientific Publishing company, Amsterdam., 277 pp.
Figures<br />
Figure 1. Geologic map (with legend) of the Nechako Basin, (adapted from Riddell, 2006)<br />
showing the locations of samples analysed in this study.
Neogene<br />
Paleogene<br />
Cretaceous<br />
Stratified Rocks<br />
Qal: Quaternary cover<br />
Qv: Quaternary volcanics<br />
LTQAn: Anahim volcanics;;<br />
LTQGb: Garibaldi volcanics<br />
LTQCh: Chilcotin Group volcanics;;<br />
OlPiFr: Fraser Bend/Australian Creek<br />
Formation;; Miv: Miocene volcanics<br />
ETKm: Kamloops Group;;<br />
ETPr: Princeton Group<br />
ETEn: Endako Group;;<br />
ETOo: Ootsa Lake Group<br />
uKTa: Taseko River strata (informal)<br />
uKKs: Kasalka Group;;<br />
uKPo: Powell Creek volcanics<br />
KSq: Silverquick Fm<br />
KJa: Jackass Mountain Group<br />
KTc: Taylor Creek Group;;<br />
lKSk: Skeena Group<br />
lKSb: Spences Bridge Group<br />
lKGa: Gambier Group<br />
Jurassic to Cretaceous<br />
uJKRe: Relay Mountain Group<br />
Lower Middle Jurassic<br />
lmJAh: Ashcroft formation<br />
lmJHz: Hazelton Group<br />
(includes Hotnarko volcanics)<br />
Early to Middle Jurassic<br />
lmJLd: Ladner Creek, includes<br />
Last Creek, Huckleberry Mountain,<br />
Nemaiah formation<br />
Triassic to Jurassic<br />
uTrJNc: Nicola Group;;<br />
TrJTk: Takla Group<br />
Upper Triassic<br />
uTrTy: Tyaughton Group<br />
uTrCd: Cadwallader Group<br />
uTrS: Stuhini Group<br />
Permian to Triassic<br />
PJKu: Kutcho Group,<br />
including Sitlika assemblage<br />
Carboniferous to Jurassic<br />
CJBr: Bridge River Group<br />
Mississippian to Triassic<br />
MTrCc: Cache Creek Group<br />
Carboniferous to Permian<br />
CPSm: Slide Mountain Group<br />
to Triassic<br />
Ultramafic Rocks<br />
Pzus;; Pzum;; CTrus;; Pum;;<br />
Pus;; Cpus;; us<br />
Intrusive and<br />
High-grade Metamorphic Rocks<br />
Paleogene to Pliocene<br />
Ltgd<br />
ETfp;; ETg;; ETgb;; ETgd;; ETgr;;<br />
ETmi;; ETqm;; ETqp;; ETto<br />
Cretaceous to Paleogene<br />
KTdr;; KTfp;; KTg;; KTgd;;<br />
KTmi;; KTqd;; KTqp;; KTto<br />
Cretaceous<br />
LKdr;; LKfp;; LKg;; LKgd;;<br />
LKog;; LKqd;; LKqm;; LKto<br />
Kg;; Kgr;; Kmi;; Kog<br />
mKgb;; mKgd;; mKgr;;<br />
mKqd;; mKto<br />
EKdr;; EKgd;; EKim;;<br />
EKto;; EKog<br />
Jurassic to Cretaceous<br />
Jurassic<br />
JKdr;; JKg;; JKgd;; JKml;; JKog;;<br />
JKqd;; JKqm;; JKqp;; JKto<br />
LJgd;; LJgr;; LJqd;;<br />
LJqm;; LJto<br />
MJdr;; MJfp;; MJg;;<br />
MJqd;; MJqm<br />
EMJdr<br />
Jgd;; Jgs;; Jml;; Jmy;; Jqd<br />
MLJdr;; MLJgb;;<br />
MLJgd;; MLJqd<br />
EJdr;; EJqd;; EJsy<br />
Triassic to Jurassic<br />
TrJdr;; Trqd;; Trto<br />
Permian to Jurassic<br />
PJml;; PJog<br />
Paleozoic to Mesozoic<br />
PzMzm;; PzMzog;; PzMzpg<br />
Permian<br />
Pdr;; Pgb;; Pqm<br />
Age Unknown<br />
dr;; g;; gr;; hfs;; m;; ml;;<br />
og;; pg;; qd;; qm;; to<br />
Figure 1 (con’t). Geologic map (with legend) of the Nechako Basin, (adapted from Riddell,<br />
2006) showing the locations of samples analysed in this study.
idealized stratigraphy of the Nechako Basin<br />
Jurassic Cretaceous Eocene<br />
Endako Group<br />
basalt lavas<br />
and breccias (11)<br />
Ootsa Lake<br />
volcanic (9)<br />
Ootsa Lake<br />
sedimentary (9)<br />
Kasalka<br />
Group<br />
(8)<br />
Jackass Mtn.<br />
Group (17)<br />
Taylor Creek and<br />
Skeena Groups<br />
(10)<br />
Spences Bridge<br />
Group (9)<br />
Relay Mtn.<br />
Group (7)<br />
Hazelton Group<br />
(10)<br />
Ladner Creek<br />
Group (11)<br />
lithologies collected<br />
andesite, gabbro<br />
basalt to rhyolite<br />
lavas and tuffs<br />
greywacke, conglomerate,<br />
basalt breccia<br />
intermediate lava<br />
flows and breccias<br />
shales, sandstones,<br />
conglomerates, dacite<br />
porphyry<br />
siltstones, sandstones<br />
and conglomerates<br />
sandstones, conglomerates,<br />
dacite lava flows and tuffs<br />
sandstones and<br />
conglomerates<br />
shales, conglomerates,<br />
basalt lavas and breccias,<br />
felsic lavas and granites<br />
shales, siltstones<br />
and sandstones<br />
Mesozoic Plutonic Rocks<br />
(6)<br />
schists, gneisses<br />
and porphyry<br />
not to scale<br />
Figure 2. Andrews et al., 2010<br />
Not to scale<br />
Figure 2. Schematic representation of stratigraphic relationships within the Nechako basin.<br />
Number of samples collected from each stratigraphic unit is given in parentheses.
Figure 3. Graph showing relationship between measured values of density and porosity.<br />
Symbols distinguish samples from specific stratigraphic units.
Figure 4. Graph showing relationship between measured values of density and magnetic<br />
susceptibility. Symbols distinguish samples from specific stratigraphic units.
Figure 5. Graph showing relationship between measured values of density and NRM. Symbols<br />
distinguish samples from specific stratigraphic units.
Figure 6. Graph showing relationship between measured values of density and Koenigsberger<br />
ratio. Symbols distinguish samples from specific stratigraphic units.
Figure 7. Graph showing relationship between measured values of density and resistivity.<br />
Symbols distinguish samples from specific stratigraphic units.
Figure 8. Graph showing relationship between measured values of density and chargeability.<br />
Symbols distinguish samples from specific stratigraphic units.
Figure 9. Graph showing relationship between measured values of porosity and resistivity.<br />
Symbols distinguish samples from specific stratigraphic units.
Figure 10. Graph showing relationship between measured values of porosity and chargeability.<br />
Symbols distinguish samples from specific stratigraphic units.
Figure 11. Graph showing relationship between measured values of magnetic susceptibility and<br />
NRM. Symbols distinguish samples from specific stratigraphic units.
Figure 12. Graph showing relationship between measured values of magnetic susceptibility and<br />
Koenigsberger ratio. Symbols distinguish samples from specific stratigraphic units.
Figure 13. Graph showing relationship between measured values of magnetic susceptibility and<br />
resistivity. Symbols distinguish samples from specific stratigraphic units.
Figure 14. Graph showing relationship between measured values of magnetic susceptibility and<br />
chargeability. Symbols distinguish samples from specific stratigraphic units.
Figure 15. Graph showing relationship between measured values of Koenigsberger ratio and<br />
NRM. Symbols distinguish samples from specific stratigraphic units.
Figure 16. Graph showing relationship between measured values of resistivity and chargeability.<br />
Symbols distinguish samples from specific stratigraphic units.
Figure 17. Graph showing relationship between measured values of resistivity and dry P-wave<br />
velocity. Symbols distinguish samples from specific stratigraphic units.
Figure 18. Graph showing relationship between measured values of resistivity and dry S-wave<br />
velocity. Symbols distinguish samples from specific stratigraphic units.
Figure 19. Graph showing relationship between measured values of resistivity and wet P-wave<br />
velocity. Symbols distinguish samples from specific stratigraphic units.
Figure 20. Graph showing relationship between measured values of resistivity and wet S-wave<br />
velocity. Symbols distinguish samples from specific stratigraphic units.
Figure 21. Graph showing relationship between measured values of dry P-wave velocity and<br />
density. Symbols distinguish samples from specific stratigraphic units.
Figure 22. Graph showing relationship between measured values of wet P-wave velocity and<br />
density. Symbols distinguish samples from specific stratigraphic units.
Figure 23. Graph showing relationship between measured values of dry P-wave velocity and dry<br />
S-wave velocity. Symbols distinguish samples from specific stratigraphic units.
Figure 24. Graph showing relationship between measured values of wet P-wave velocity and wet<br />
S-wave velocity. Symbols distinguish samples from specific stratigraphic units.