2002-03 - Grasim
2002-03 - Grasim
2002-03 - Grasim

Create successful ePaper yourself
Turn your PDF publications into a flip-book with our unique Google optimized e-Paper software.
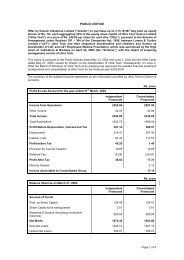
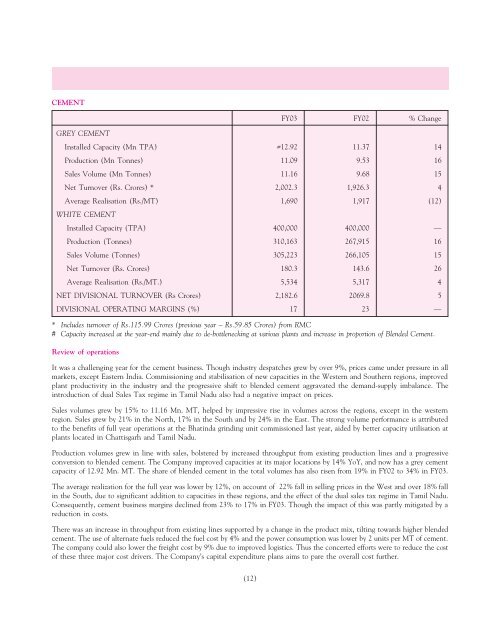
CEMENT<br />
FY<strong>03</strong> FY02 % Change<br />
GREY CEMENT<br />
Installed Capacity (Mn TPA) #12.92 11.37 14<br />
Production (Mn Tonnes) 11.09 9.53 16<br />
Sales Volume (Mn Tonnes) 11.16 9.68 15<br />
Net Turnover (Rs. Crores) * 2,002.3 1,926.3 4<br />
Average Realisation (Rs./MT) 1,690 1,917 (12)<br />
WHITE CEMENT<br />
Installed Capacity (TPA) 400,000 400,000 —<br />
Production (Tonnes) 310,163 267,915 16<br />
Sales Volume (Tonnes) 305,223 266,105 15<br />
Net Turnover (Rs. Crores) 180.3 143.6 26<br />
Average Realisation (Rs./MT.) 5,534 5,317 4<br />
NET DIVISIONAL TURNOVER (Rs Crores) 2,182.6 2069.8 5<br />
DIVISIONAL OPERATING MARGINS (%) 17 23 —<br />
* Includes turnover of Rs.115.99 Crores (previous year – Rs.59.85 Crores) from RMC<br />
# Capacity increased at the year-end mainly due to de-bottlenecking at various plants and increase in proportion of Blended Cement.<br />
Review of operations<br />
It was a challenging year for the cement business. Though industry despatches grew by over 9%, prices came under pressure in all<br />
markets, except Eastern India. Commissioning and stabilisation of new capacities in the Western and Southern regions, improved<br />
plant productivity in the industry and the progressive shift to blended cement aggravated the demand-supply imbalance. The<br />
introduction of dual Sales Tax regime in Tamil Nadu also had a negative impact on prices.<br />
Sales volumes grew by 15% to 11.16 Mn. MT, helped by impressive rise in volumes across the regions, except in the western<br />
region. Sales grew by 21% in the North, 17% in the South and by 24% in the East. The strong volume performance is attributed<br />
to the benefits of full year operations at the Bhatinda grinding unit commissioned last year, aided by better capacity utilisation at<br />
plants located in Chattisgarh and Tamil Nadu.<br />
Production volumes grew in line with sales, bolstered by increased throughput from existing production lines and a progressive<br />
conversion to blended cement. The Company improved capacities at its major locations by 14% YoY, and now has a grey cement<br />
capacity of 12.92 Mn. MT. The share of blended cement in the total volumes has also risen from 19% in FY02 to 34% in FY<strong>03</strong>.<br />
The average realization for the full year was lower by 12%, on account of 22% fall in selling prices in the West and over 18% fall<br />
in the South, due to significant addition to capacities in these regions, and the effect of the dual sales tax regime in Tamil Nadu.<br />
Consequently, cement business margins declined from 23% to 17% in FY<strong>03</strong>. Though the impact of this was partly mitigated by a<br />
reduction in costs.<br />
There was an increase in throughput from existing lines supported by a change in the product mix, tilting towards higher blended<br />
cement. The use of alternate fuels reduced the fuel cost by 4% and the power consumption was lower by 2 units per MT of cement.<br />
The company could also lower the freight cost by 9% due to improved logistics. Thus the concerted efforts were to reduce the cost<br />
of these three major cost drivers. The Company’s capital expenditure plans aims to pare the overall cost further.<br />
(12)