A R C T E X
A R C T E X
A R C T E X

Create successful ePaper yourself
Turn your PDF publications into a flip-book with our unique Google optimized e-Paper software.
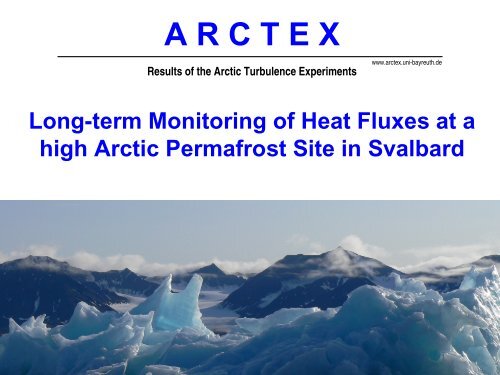
A R C T E X<br />
Results of the Arctic Turbulence Experiments<br />
www.arctex.uni-bayreuth.de<br />
Long-term Monitoring of Heat Fluxes at a<br />
high Arctic Permafrost Site in Svalbard<br />
1
A R C T E X<br />
Results of the Arctic Turbulence Experiments<br />
www.arctex.uni-bayreuth.de<br />
CONTENT<br />
Overview field experiments<br />
Meso-scale atmospheric circulation pattern - Kongsfjord<br />
Wind field and atmospheric stability<br />
Typical diurnal patterns spring time<br />
Disturbed temperature profile close to the surface<br />
Ratio of buoyancy / shear production - Free Convection conditions<br />
Surface energy budget of permafrost on Svalbard<br />
Johannes Lüers<br />
DACH 2010 Bonn<br />
Universität Bayreuth Bayreuther Zentrum für Ökologie und Umweltforschung<br />
Abteilung Mikrometeorologie johannes.lueers@uni-bayreuth.de
Direct near surface measurements of sensible heat fluxes in the<br />
arctic tundra applying eddy-covariance and laser scintillometry<br />
(supported by the DFG)<br />
1 st Measurement experiment May 02, 2006 to May 20, 2006 -<br />
Location: Ny-Ålesund, Spitzbergen (Svalbard), 79° North Latitude<br />
Lüers, J and Bareiss, J (2010): The effect of misleading surface temperature estimations on the sensible heat<br />
fluxes at a high Arctic site - The Arctic turbulence experiment 2006 on Svalbard (ARCTEX-2006),<br />
Atmospheric Chemistry and Physics, 10 (1), 157-168.<br />
Lüers, J and Bareiss, J: Direct near surface measurements of sensible heat fluxes in the arctic tundra<br />
applying eddy-covariance and laser scintillometry - The Arctic Turbulence Experiment 2006 on Svalbard<br />
(ARCTEX-2006), Theor Appl Climatol, in review 2010.<br />
Westermann, S; Lüers, J; Langer, M; Piel, K; Boike, J (2009): The annual surface energy budget of a higharctic<br />
permafrost site on Svalbard, Norway, The Cryosphere, 3 (2), 631-680.<br />
Johannes Lüers<br />
DACH 2010 Bonn<br />
Universität Bayreuth Bayreuther Zentrum für Ökologie und Umweltforschung<br />
Abteilung Mikrometeorologie johannes.lueers@uni-bayreuth.de<br />
3
Diurnal variability of near surface sensible heat fluxes during summer<br />
time over dry and wet high arctic Tundra using eddy-covariance and<br />
laser scintillometer techniques in a typical footprint area on Svalbard<br />
(DFG project LU 1400/2-1). 2 nd measurement experiment August 10,<br />
2009 to August 20, 2009 - Location: Bayelva Catchment south-west of<br />
Ny-Ålesund, 79° North latitude.<br />
Johannes Lüers<br />
DACH 2010 Bonn<br />
Universität Bayreuth Bayreuther Zentrum für Ökologie und Umweltforschung<br />
Abteilung Mikrometeorologie johannes.lueers@uni-bayreuth.de<br />
4
Meso-scale atmospheric circulation pattern - Kongsfjord<br />
Ny-Alesund<br />
Johannes Lüers<br />
DACH 2010 Bonn<br />
Universität Bayreuth Bayreuther Zentrum für Ökologie und Umweltforschung<br />
Abteilung Mikrometeorologie johannes.lueers@uni-bayreuth.de<br />
5
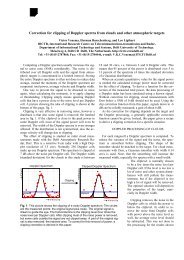
Wind field and atmospheric stability (Lüers & Bareiss, TAC 2010)<br />
360<br />
Ny-Alesund<br />
NW SE NW SE NW SE<br />
SE<br />
NW<br />
May 2006<br />
0.8<br />
2.0<br />
315<br />
0.7<br />
1.5<br />
wind direction ¨ [°]<br />
270<br />
225<br />
180<br />
135<br />
90<br />
45<br />
0<br />
0.0<br />
07 08 09 10 11 12 13 14 15 16 17 18 19 20<br />
Time [Day]<br />
0.6<br />
0.5<br />
0.4<br />
0.3<br />
0.2<br />
0.1<br />
u * [m s -2 ]<br />
u¨ [m s¨1]<br />
1.0<br />
0.5<br />
0.0<br />
-0.5<br />
-1.0<br />
-1.5<br />
-2.0<br />
stability z/L z/L ¨ [-] [-]<br />
Interaction of micrometeorological atmospheric stability with change of wind direction<br />
down (SE) or up (NW) Kongsfjord valley<br />
Forced by change of thermal meso-scale atmospheric circulation pattern or synoptic<br />
weather situation around Spitsbergen<br />
Affected by<br />
mountainous Islands covered by glaciers and sea-water filled Fjords<br />
Johannes Lüers<br />
DACH 2010 Bonn<br />
Universität Bayreuth Bayreuther Zentrum für Ökologie und Umweltforschung<br />
Abteilung Mikrometeorologie johannes.lueers@uni-bayreuth.de<br />
6
z/L z [ ]<br />
z/L z [ ]<br />
Ny-Alesund<br />
2.0<br />
1.5<br />
1.0<br />
0.5<br />
0.0<br />
-0.5<br />
-1.0<br />
-1.5<br />
-2.0<br />
1.5<br />
1.0<br />
0.5<br />
0.0<br />
-0.5<br />
-1.0<br />
-1.5<br />
-2.0<br />
NW<br />
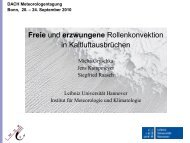
Typical diurnal patterns spring time (Lüers & Bareiss, TAC 2010)<br />
z/L<br />
QH ECV<br />
00 01 02 03 03 04 04 05 05 06 06 07 07 08 08 09 09 10 10 11 12 11 13 12 14 13 1514 1615 1716 1817 19 18 20 19 21 20 22 23 21 00 22 23 00<br />
Ny-Alesund<br />
2.0<br />
SE<br />
z/L<br />
SE<br />
QH ECV<br />
QH LC95 IR<br />
QH SLS<br />
CET [hour]<br />
SE<br />
SE<br />
NW<br />
QH LC95 IR<br />
QH SLS<br />
May 16, 11, 2006<br />
10 20<br />
00 01 02 03 03 04 04 05 05 06 06 07 07 08 08 09 09 10 10 11 12 11 13 12 14 13 1514 1615 1716 1817 19 18 20 19 21 20 22 23 21 00 22 23 00<br />
CET [hour]<br />
SE<br />
NW<br />
8<br />
15<br />
6<br />
10<br />
4<br />
2<br />
5<br />
0<br />
-2<br />
-5<br />
-4<br />
-10<br />
-6<br />
-8<br />
-15<br />
-10 -20<br />
May 16, 2006<br />
10 20<br />
NW<br />
8<br />
15<br />
6<br />
10<br />
4<br />
2<br />
5<br />
0<br />
-2<br />
-5<br />
-4<br />
-10<br />
-6<br />
-8<br />
-15<br />
-10 -20<br />
QH [W m -2 ]<br />
QH [W m -2 ]<br />
10<br />
8<br />
6<br />
4<br />
2<br />
0<br />
-2<br />
-4<br />
-6<br />
-8<br />
-10<br />
10<br />
8<br />
6<br />
4<br />
2<br />
0<br />
-2<br />
-4<br />
-6<br />
-8<br />
-10<br />
Vh [ m s -1 ]<br />
Vh [ m s -1 ]<br />
May 11<br />
Day time sustainable<br />
neutral conditions with<br />
strong SE winds<br />
Night time stability<br />
weak or calm NW<br />
winds.<br />
May 16 vice versa<br />
Day time intermittent<br />
turbulent exchange at<br />
noon, calm winds<br />
during change of<br />
directions SE to NW.<br />
Night time sustainable<br />
neutral and windy<br />
conditions during low<br />
sun positions<br />
(Both days were sunny<br />
with some scattered<br />
alto-level clouds.)<br />
Johannes Lüers<br />
DACH 2010 Bonn<br />
Universität Bayreuth Bayreuther Zentrum für Ökologie und Umweltforschung<br />
Abteilung Mikrometeorologie johannes.lueers@uni-bayreuth.de<br />
7
Disturbed temperature profile close to the surface (Lüers & Bareiss, ACP 2010)<br />
Mean vertical profile of temperature and wind speed<br />
Case A reflects strong surface cooling and a sharp inversion within 1 or 2 meter (5 h to 8 h or 17 to 22 h CET).<br />
Case B occurs around noon (9 to 16 CET) indicating a disturbed profile caused by surface warming.<br />
Johannes Lüers<br />
DACH 2010 Bonn<br />
Universität Bayreuth Bayreuther Zentrum für Ökologie und Umweltforschung<br />
Abteilung Mikrometeorologie johannes.lueers@uni-bayreuth.de<br />
8
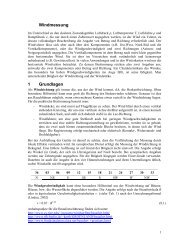
Ratio of buoyancy / shear production - Free Convection conditions<br />
Production of Turbulent Kinetic Energy TKE<br />
B<br />
=<br />
g<br />
θ<br />
v<br />
⋅ w′<br />
θ′<br />
v<br />
Buoyancy production: This term represents effect of<br />
thermal convection on the generation of TKE.<br />
S<br />
2<br />
= u ∗<br />
⋅<br />
∆v<br />
h<br />
∆z<br />
Shear production: This term represents<br />
mechanical production of TKE or of turbulent eddies. Interaction of<br />
the vertical wind profile with the kinematic stress against the surface.<br />
Ratio B/S (B/S = flux Richardson number Ri f )<br />
TKE produced or consumed by the buoyancy term B<br />
versus<br />
TKE produced by the mechanical or shear stress term S<br />
Usable to assess the dynamical stability or the convective activity<br />
of the atmospheric boundary layer.<br />
Johannes Lüers<br />
DACH 2010 Bonn<br />
Universität Bayreuth Bayreuther Zentrum für Ökologie und Umweltforschung<br />
Abteilung Mikrometeorologie johannes.lueers@uni-bayreuth.de<br />
9
Ratio of buoyancy / shear production - Free Convection conditions<br />
Ny-Alesund<br />
May 2006<br />
Ratio Buoyancy/Shear [ ]<br />
12<br />
9<br />
6<br />
3<br />
0<br />
-3<br />
-6<br />
-9<br />
+1 or -3<br />
Ratio B/S<br />
12<br />
9<br />
6<br />
3<br />
0<br />
-3<br />
-6<br />
-9<br />
-12<br />
07 08 09 10 11 12 13 14 15 16 17 18 19 20<br />
Determination if a free convection event or extreme stability (Stull 2000)<br />
B/S threshold of -3 buoyancy is three times greater than wind shear |B| > 3⋅|S|<br />
high possibility to generate free convection.<br />
B/S threshold of +1<br />
Time [Day]<br />
states dynamical stable, wave motion drive conditions.<br />
Most of the time in May 2006 relation thermal vs. mechanical produced TKE is near zero.<br />
Distinct, short periods of free convection or extreme stability (duration only 1 h to 2 h).<br />
Events at Ny-Ålesund appear mostly around noon or afternoon.<br />
-12<br />
Johannes Lüers<br />
DACH 2010 Bonn<br />
Universität Bayreuth Bayreuther Zentrum für Ökologie und Umweltforschung<br />
Abteilung Mikrometeorologie johannes.lueers@uni-bayreuth.de<br />
10
Surface energy budget of permafrost on Svalbard (Westermann, Lüers et al. TC 2009)<br />
Johannes Lüers<br />
DACH 2010 Bonn<br />
Universität Bayreuth Bayreuther Zentrum für Ökologie und Umweltforschung<br />
Abteilung Mikrometeorologie johannes.lueers@uni-bayreuth.de
DS<br />
-18<br />
DL<br />
+41<br />
Q H<br />
-18<br />
Q E<br />
+0.7<br />
Light Winter<br />
15 Mar<br />
to 15 Apr<br />
DS<br />
-41<br />
DL<br />
+33<br />
Q H<br />
-8<br />
Pre melt 15 Apr<br />
to 31 May<br />
Q E<br />
+2.5<br />
C ~0<br />
Q G<br />
-5.9<br />
Q G<br />
+3<br />
C +10.5<br />
DS<br />
-91<br />
Q G<br />
+12<br />
DL<br />
+43<br />
Q Melt<br />
+27<br />
Snow melt<br />
Jun<br />
Q H<br />
-6<br />
Q E<br />
+11<br />
C +3<br />
Light winter: Net short-wave radiation increasing à limited by high snow albedo.<br />
Energy loss by ∆L compensated by sensible heat flux and short-wave radiation.<br />
Snow heat flux negative à further cooling underlying soil column à lowest soil<br />
temperatures.<br />
Pre melt: Net short-wave radiation dominant energy supply. Sensible heat flux<br />
add. melt energy.<br />
Net long-wave radiation main balancing factor. Latent heat remains insignificant.<br />
Snow and soil column start to warm (now positive snow heat flux).<br />
Snow melt: Warming of snow pack towards 0°C à followed by snow melt.<br />
Energy consumed by melting snow is dominant component.<br />
Strong net short-wave radiation (albedo change) à Compensated by net longwave<br />
radiation.<br />
Total net radiation is much stronger energy suppler compared to Q H .<br />
Snow melt almost entirely controlled by radiation.<br />
Johannes Lüers<br />
DACH 2010 Bonn<br />
Universität Bayreuth Bayreuther Zentrum für Ökologie und Umweltforschung<br />
Abteilung Mikrometeorologie johannes.lueers@uni-bayreuth.de
Dark Winter<br />
Oct to Mar<br />
Summer Jul & Aug<br />
DL<br />
+28 Q H<br />
-16<br />
Q E<br />
+2.5<br />
Q G<br />
-5<br />
C -9<br />
Dark winter: Long-wave radiation is main forcing<br />
à Net long-wave radiation dominant energy loss<br />
∆L loss is compensated by<br />
negative sensible heat flux (warming of surface,<br />
cooling of atmosphere)<br />
Sig. positive latent heat fluxes (at high wind speed<br />
& neutral stratification)<br />
Sig. influence of other factors:<br />
wind speed & precipitation (rain on snow)<br />
Schematic diagram of the contributions of the surface energy budget for different<br />
seasons. Arrows pointing away from the surface indicate positive fluxes.<br />
The flux values are given in Wm - 2 .<br />
DS<br />
-122<br />
Q G<br />
+12<br />
DL<br />
+43<br />
Q H<br />
22.5<br />
Q E<br />
22.5<br />
Summer: strong forcing by short-wave radiation<br />
à absence of snow cover.<br />
C +22<br />
Net short-wave radiation ∆S is compensated by:<br />
+ net long-wave radiation ∆L<br />
+ sensible and latent heat flux<br />
+ ground heat flux à Thawing of the active layer.<br />
Johannes Lüers<br />
DACH 2010 Bonn<br />
Universität Bayreuth Bayreuther Zentrum für Ökologie und Umweltforschung<br />
Abteilung Mikrometeorologie johannes.lueers@uni-bayreuth.de
Surface energy budget of permafrost on Svalbard<br />
Summer 1 Jul to 31 Aug 2008, Bayelva permafrost station<br />
Sensible (red), latent (blue) and ground (green) heat<br />
fluxes W m −2 (left axis).<br />
Soil water content θ w - Time Domain Reflectometry at<br />
0.1 m depth (right axis).<br />
Average daily Bowen ratio vs. volumetric soil<br />
water content θ w<br />
Soil water content classes of widths of 0.02.<br />
Error bars represent the standard deviation of<br />
the Bowen ratio values within one class.<br />
Johannes Lüers<br />
DACH 2010 Bonn<br />
Universität Bayreuth Bayreuther Zentrum für Ökologie und Umweltforschung<br />
Abteilung Mikrometeorologie johannes.lueers@uni-bayreuth.de
Surface energy budget of permafrost on Svalbard<br />
Snow melt - June<br />
Sensible (red), latent heat flux<br />
(blue), W m −2 , left axis.<br />
Light gray : snow-covered<br />
Dark gray : snow-free<br />
fraction of the surface area, right<br />
axis.<br />
Intermediate gray : uncertainty in<br />
area fractions.<br />
Until large snow-free patches appear<br />
Air temperature between -1°C and +5°C à snow surface temperature remains close to 0°C à resulting temperature<br />
gradient is small à weak Q H -flux à positive Q E -flux, causing cooling of surface, becomes significant (presence of water).<br />
During snow melt<br />
Infiltrating melt water à subsequent refreezing processes dominates snow pack, (isothermal close to 0°C).<br />
Underlying soil still colder à resulting in a heat transport from snow-soil interface into the soil.<br />
Johannes Lüers<br />
DACH 2010 Bonn<br />
Universität Bayreuth Bayreuther Zentrum für Ökologie und Umweltforschung<br />
Abteilung Mikrometeorologie johannes.lueers@uni-bayreuth.de
Surface energy budget (SEB) of permafrost on Svalbard<br />
Annual cycle<br />
During polar night - main components SEB:<br />
* IR-radiation *sensible heat flux *heat input refreezing active layer<br />
Determining factor surface temperature of snow:<br />
*incoming atmospheric IR-radiation and *downward sensible heat flux<br />
During spring - Apr/May - long-lasting snow cover - high albedo:<br />
Limitation of *short-wave radiation<br />
Dominant component: energy consumed by melting snow<br />
Albedo change by snow melt is of critical importance for annual SEB<br />
Marking transition point between two fundamentally different regimes<br />
During polar day - Jul/Aug - snow-free period - system governed by<br />
*short-wave radiation<br />
Main balancing factors in the surface energy budget<br />
*turbulent heat fluxes and *IR-radiation balance<br />
Johannes Lüers<br />
DACH 2010 Bonn<br />
Universität Bayreuth Bayreuther Zentrum für Ökologie und Umweltforschung<br />
Abteilung Mikrometeorologie johannes.lueers@uni-bayreuth.de
Conclusions : Process understanding<br />
ARCTEX-2006 and 2009 + Understanding: variability and transport processes<br />
+ Interaction: meso-scale atmospheric circulation pattern with micrometeorological<br />
near surface atmospheric exchange conditions.<br />
+ Wind field change: short, developed unstable situations<br />
or even free-convection events (noon or early afternoon).<br />
+ Positive feedback: snow and ice melt is supported by<br />
free-convection or short unstable periods<br />
+ Disturbed temperature profile close to surface: Decoupling major error source<br />
to estimate heat fluxes and appropriate surface temperature<br />
+ Comparison: heat-flux parameterizations with direct measurements.<br />
Hydrodynamic three-layer temperature-profile model reliably reproduces<br />
temporal variability of surface temperature<br />
Johannes Lüers<br />
DACH 2010 Bonn<br />
Universität Bayreuth Bayreuther Zentrum für Ökologie und Umweltforschung<br />
Abteilung Mikrometeorologie johannes.lueers@uni-bayreuth.de<br />
17
Conclusions : Practical recommendations<br />
Main technical error source drifting snow and precipitation effects through flux sensor pathways (over- or<br />
underestimation and misleading flux directions)<br />
Solution<br />
Measurement height should be recorded (variation of snow depth) and must be adjusted according to change of<br />
seasons, service of a present weather detector (weather code, visibility).<br />
Decoupling effect (disturbed temperature profiles) and the determination of the surface temperature<br />
Solution<br />
Additional meteorological data + near-surface vertical gradients of wind, temperature, humidity.<br />
Surf. temp.: IR-Thermometer or pyrgeometer or extrapolation applying a hydrodynamic three-layer temperatureprofile<br />
model (Lüers & Bareiss ACP 10/1).<br />
Measurement height of instrumentation (eddy-covariance systems or gradient towers) should be in appropriate<br />
layer within and above this disturbed wind and temperature profiles.<br />
General<br />
Adaptation to polar conditions of flux data corrections and quality assessment and quality control (QA/QC)<br />
techniques (rotation of coordinate system).<br />
Detection of intermittent turbulent conditions, of free-convection events, of wave motion.<br />
Investigation of meso-scale circulation pattern and micro-scale near surface profiles.<br />
Observation of variability of the snow and tundra soil surface conditions (e.g. Web-Cam).<br />
Finding a compromise between conflicting nature of the effect of the disturbed temperature profile and the search<br />
for an acceptable fetch and desired footprint area.<br />
Johannes Lüers<br />
DACH 2010 Bonn<br />
Universität Bayreuth Bayreuther Zentrum für Ökologie und Umweltforschung<br />
Abteilung Mikrometeorologie johannes.lueers@uni-bayreuth.de<br />
18
Thanks<br />
19