Ottawa County Equalization Department 2011 Annual Report
Ottawa County Equalization Department 2011 Annual Report
Ottawa County Equalization Department 2011 Annual Report

Create successful ePaper yourself
Turn your PDF publications into a flip-book with our unique Google optimized e-Paper software.
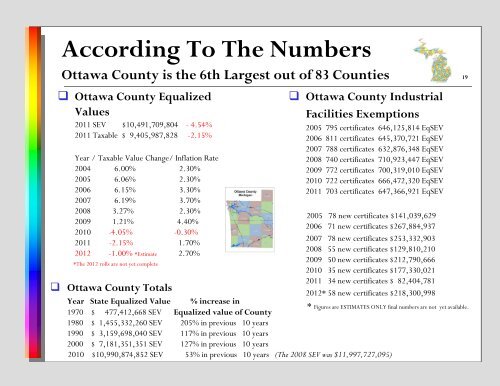
According To The Numbers<br />
<strong>Ottawa</strong> <strong>County</strong> is the 6th Largest out of 83 Counties 19<br />
<strong>Ottawa</strong> <strong>County</strong> Equalized<br />
Values<br />
<strong>2011</strong> SEV $10,491,709,804 - 4.54%<br />
<strong>2011</strong> Taxable $ 9,405,987,828 -2.15%<br />
Year / Taxable Value Change/ Inflation Rate<br />
2004 6.00% 2.30%<br />
2005 6.06% 2.30%<br />
2006 6.15% 3.30%<br />
2007 6.19% 3.70%<br />
2008 3.27% 2.30%<br />
2009 1.21% 4.40%<br />
2010 -4.05% -0.30%<br />
<strong>2011</strong> -2.15% 1.70%<br />
2012 -1.00% *Estimate 2.70%<br />
*The 2012 rolls are not yet complete<br />
<strong>Ottawa</strong> <strong>County</strong> Industrial<br />
Facilities Exemptions<br />
2005 795 certificates 646,125,814 EqSEV<br />
2006 811 certificates 645,370,721 EqSEV<br />
2007 788 certificates 632,876,348 EqSEV<br />
2008 740 certificates 710,923,447 EqSEV<br />
2009 772 certificates 700,319,010 EqSEV<br />
2010 722 certificates 666,472,320 EqSEV<br />
<strong>2011</strong> 703 certificates 647,366,921 EqSEV<br />
2005 78 new certificates $141,039,629<br />
2006 71 new certificates $267,884,937<br />
2007 78 new certificates $253,332,903<br />
2008 55 new certificates $129,810,210<br />
2009 50 new certificates $212,790,666<br />
2010 35 new certificates $177,330,021<br />
<strong>2011</strong> 34 new certificates $ 82,404,781<br />
2012* 58 new certificates $218,300,998<br />
* Figures are ESTIMATES ONLY final numbers are not yet available.<br />
<strong>Ottawa</strong> <strong>County</strong> Totals<br />
Year State Equalized Value % increase in<br />
1970 $ 477,412,668 SEV Equalized value of <strong>County</strong><br />
1980 $ 1,455,332,260 SEV 205% in previous 10 years<br />
1990 $ 3,159,698,040 SEV 117% in previous 10 years<br />
2000 $ 7,181,351,351 SEV 127% in previous 10 years<br />
2010 $10,990,874,852 SEV 53% in previous 10 years (The 2008 SEV was $11,997,727,095)