Ottawa County Equalization Department 2011 Annual Report
Ottawa County Equalization Department 2011 Annual Report
Ottawa County Equalization Department 2011 Annual Report

Create successful ePaper yourself
Turn your PDF publications into a flip-book with our unique Google optimized e-Paper software.
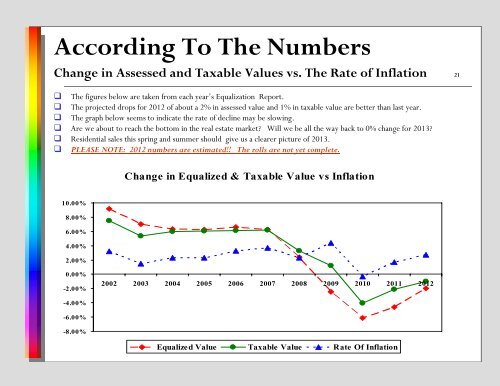
According To The Numbers<br />
Change in Assessed and Taxable Values vs. The Rate of Inflation 21<br />
The figures below are taken from each year’s <strong>Equalization</strong> <strong>Report</strong>.<br />
The projected drops for 2012 of about a 2% in assessed value and 1% in taxable value are better than last year.<br />
The graph below seems to indicate the rate of decline may be slowing.<br />
Are we about to reach the bottom in the real estate market Will we be all the way back to 0% change for 2013<br />
Residential sales this spring and summer should give us a clearer picture of 2013.<br />
PLEASE NOTE: 2012 numbers are estimated!! The rolls are not yet complete.<br />
Change in Equalized & Taxable Value vs Inflation<br />
10.00%<br />
8.00%<br />
6.00%<br />
4.00%<br />
2.00%<br />
0.00%<br />
-2.00%<br />
2002 2003 2004 2005 2006 2007 2008 2009 2010 <strong>2011</strong> 2012<br />
-4.00%<br />
-6.00%<br />
-8.00%<br />
Equalized Value Taxable Value Rate Of Inflation