

Elementary Education in India Elementary Education in India ... - DISE
Elementary Education in India Elementary Education in India ... - DISE
Elementary Education in India Elementary Education in India ... - DISE

Create successful ePaper yourself
Turn your PDF publications into a flip-book with our unique Google optimized e-Paper software.
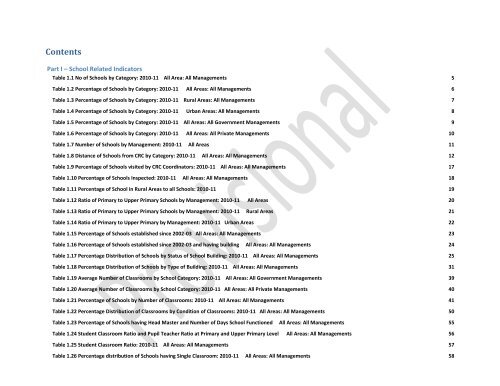
Contents<br />
Part I – School Related Indicators<br />
Table 1.1 No of Schools by Category: 2010-11 All Area: All Managements 5<br />
Table 1.2 Percentage of Schools by Category: 2010-11 All Areas: All Managements 6<br />
Table 1.3 Percentage of Schools by Category: 2010-11 Rural Areas: All Managements 7<br />
Table 1.4 Percentage of Schools by Category: 2010-11 Urban Areas: All Managements 8<br />
Table 1.5 Percentage of Schools by Category: 2010-11 All Areas: All Government Managements 9<br />
Table 1.6 Percentage of Schools by Category: 2010-11 All Areas: All Private Managements 10<br />
Table 1.7 Number of Schools by Management: 2010-11 All Areas 11<br />
Table 1.8 Distance of Schools from CRC by Category: 2010-11 All Areas: All Managements 12<br />
Table 1.9 Percentage of Schools visited by CRC Coord<strong>in</strong>ators: 2010-11 All Areas: All Managements 17<br />
Table 1.10 Percentage of Schools Inspected: 2010-11 All Areas: All Managements 18<br />
Table 1.11 Percentage of School <strong>in</strong> Rural Areas to all Schools: 2010-11 19<br />
Table 1.12 Ratio of Primary to Upper Primary Schools by Management: 2010-11 All Areas 20<br />
Table 1.13 Ratio of Primary to Upper Primary Schools by Management: 2010-11 Rural Areas 21<br />
Table 1.14 Ratio of Primary to Upper Primary by Management: 2010-11 Urban Areas 22<br />
Table 1.15 Percentage of Schools established s<strong>in</strong>ce 2002-03 All Areas: All Managements 23<br />
Table 1.16 Percentage of Schools established s<strong>in</strong>ce 2002-03 and hav<strong>in</strong>g build<strong>in</strong>g All Areas: All Managements 24<br />
Table 1.17 Percentage Distribution of Schools by Status of School Build<strong>in</strong>g: 2010-11 All Areas: All Managements 25<br />
Table 1.18 Percentage Distribution of Schools by Type of Build<strong>in</strong>g: 2010-11 All Areas: All Managements 31<br />
Table 1.19 Average Number of Classrooms by School Category: 2010-11 All Areas: All Government Managements 39<br />
Table 1.20 Average Number of Classrooms by School Category: 2010-11 All Areas: All Private Managements 40<br />
Table 1.21 Percentage of Schools by Number of Classrooms: 2010-11 All Areas: All Managements 41<br />
Table 1.22 Percentage Distribution of Classrooms by Condition of Classrooms: 2010-11 All Areas: All Managements 50<br />
Table 1.23 Percentage of Schools hav<strong>in</strong>g Head Master and Number of Days School Functioned All Areas: All Managements 55<br />
Table 1.24 Student Classroom Ratio and Pupil Teacher Ratio at Primary and Upper Primary Level All Areas: All Managements 56<br />
Table 1.25 Student Classroom Ratio: 2010-11 All Areas: All Managements 57<br />
Table 1.26 Percentage distribution of Schools hav<strong>in</strong>g S<strong>in</strong>gle Classroom: 2010-11 All Areas: All Managements 58


