

130 Elementary Education in India - Where do we stand ? - DISE
130 Elementary Education in India - Where do we stand ? - DISE
130 Elementary Education in India - Where do we stand ? - DISE
- No tags were found...

You also want an ePaper? Increase the reach of your titles
YUMPU automatically turns print PDFs into web optimized ePapers that Google loves.
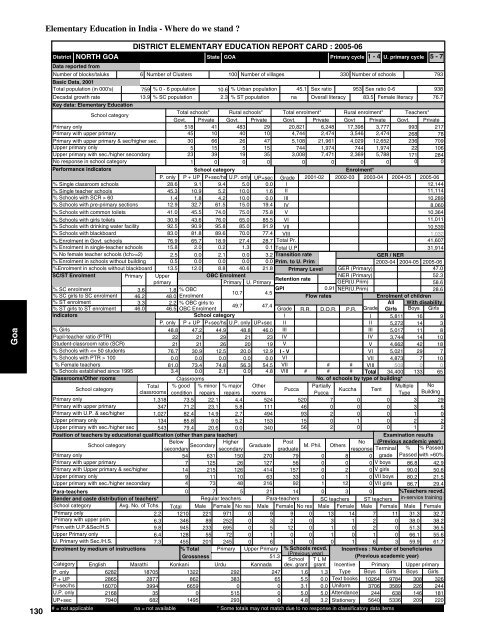
Goa<strong>130</strong><strong>Elementary</strong> <strong>Education</strong> <strong>in</strong> <strong>India</strong> - <strong>Where</strong> <strong>do</strong> <strong>we</strong> <strong>stand</strong> ?NORTH GOADistrictData reported fromNumber of blocks/taluksBasic Data, 2001Total population (<strong>in</strong> 000's)Decadal growth rateDISTRICT ELEMENTARY EDUCATION REPORT CARD : 2005-06State6 Number of Clusters 100 Number of villages330 Number of schools793759 % 0 - 6 population 10.6 % Urban population 45.1 Sex ratio 953 Sex ratio 0-693813.9 % SC population 2.3 % ST population na Overall literacy 83.5 Female literacy 76.7Primary cycle 1 - 4 U. primary cycle 5 - 7Key data: <strong>Elementary</strong> <strong>Education</strong>School categoryTotal schools* Rural schools* Total enrolment* Rural enrolment* Teachers*Govt. Private Govt. Private Govt. Private Govt Private Govt. PrivatePrimary only518 41 483 29 20,821 6,248 17,398 3,777 993 217Primary with upper primary45 10 40 10 4,744 2,474 3,546 2,474 268 78Primary with upper primary & sec/higher sec.30 66 26 47 5,108 21,961 4,029 12,652 236 709Upper primary only5 15 5 15 744 1,974 744 1,974 22 106Upper primary with sec./higher secondary23 39 19 35 3,008 7,471 2,369 5,788 171 284No response <strong>in</strong> school category1 0 0 0 0 0 0 0 0 0Performance <strong>in</strong>dicatorsSchool categoryEnrolment*P. only P + UP P+sec/hs U.P. only UP+sec Grade 2001-02 2002-03 2003-04 2004-05 2005-06% S<strong>in</strong>gle classroom schools28.6 9.1 9.4 5.0 0.0 I12,144% S<strong>in</strong>gle teacher schools45.3 10.9 5.2 10.0 1.6 II11,114% Schools with SCR > 601.4 1.8 4.2 10.0 0.0 III10,289% Schools with pre-primary sections 12.9 32.7 61.5 15.0 19.4 IV8,060% Schools with common toilets 41.0 45.5 74.0 75.0 75.8 V10,364% Schools with girls toilets 30.9 43.6 76.0 65.0 85.5 VI11,011% Schools with dr<strong>in</strong>k<strong>in</strong>g water facility 92.5 90.9 95.8 85.0 91.9 VII10,539% Schools with blackboard83.0 81.8 89.6 70.0 77.4 VIII1,032% Enrolment <strong>in</strong> Govt. schools 76.9 65.7 18.9 27.4 28.7 Total Pr.41,607% Enrolment <strong>in</strong> s<strong>in</strong>gle-teacher schools 15.8 2.0 0.2 1.3 0.1 Total U.P31,914% No female teacher schools (tch>=2) 2.5 0.0 2.1 0.0 3.2 Transition rateGER / NER% Enrolment <strong>in</strong> schools without build<strong>in</strong>g 0.5 0.0 0.0 0.0 0.0 Prim. to U. Prim2003-04 2004-05 2005-06%Enrolment <strong>in</strong> schools without blackboard 13.5 12.0 8.8 40.6 21.8 Primary Level GER (Primary)47.0SC/ST EnrolmentPrimary UpperOBC EnrolmentNER (Primary)52.3Retention rateprimaryPrimary U. PrimaryGER(U.Prim)58.6% SC enrolment3.6 1.8 % OBCGPI0.91 NER(U.Prim)28.610.7 4.5% SC girls to SC enrolment 46.2 48.0 EnrolmentFlow ratesEnrolment of children% ST enrolment3.3 2.2 % OBC girls toAll With disability49.7 47.4% ST girls to ST enrolment 46.0 46.5 OBC EnrolmentGrade R.R. D.O.R. P.R. Grade Girls Boys GirlsIndicatorsSchool categoryII 5,811 16 9P. only P + UP P+sec/hs U.P. only UP+sec IIII 5,272 14 3% Girls48.8 47.2 44.9 48.8 46.0 IIIIII 5,017 11 8Pupil-teacher ratio (PTR)22 21 29 21 23 IVIV 3,744 14 10Student-classroom ratio (SCR)21 21 26 20 19 VV 4,662 42 18% Schools with 1000.0 0.0 0.0 0.0 0.0 VIVII 4,873 7 10% Female teachers81.0 73.4 74.8 56.3 54.5 VII# # VIII 508 0 0% Schools established s<strong>in</strong>ce 19953.4 0.0 2.1 0.0 4.8 VIII # # # Total 34,400 133 65Classrooms/Other roomsClassroomsNo. of schools by type of build<strong>in</strong>g*School categoryTotal % good % m<strong>in</strong>or % major OtherPartiallyMultiple NoPuccaKuccha Tentclassrooms condition repairs repairs roomsPuccaType Build<strong>in</strong>gPrimary only1,318 73.5 22.1 4.4 524 520 7 0 0 3 29Primary with upper primary347 71.2 23.1 5.8 11146 0 0 0 3 6Primary with U.P. & sec/higher1,027 82.4 14.9 2.7 49493 2 0 0 1 0Upper primary only134 85.8 9.0 5.2 15315 0 1 0 2 2Upper primary with sec./higher sec 543 79.4 20.6 0.0 34056 2 0 0 1 2Position of teachers by educational qualification (other than para teacher)Exam<strong>in</strong>ation resultsSchool category BelowHigherPost(Previous academic year)M. Phil.secondarysecondarygraduateNoresponse Term<strong>in</strong>al % % Passed54 631 150 270 79 0 8 0 grade Passed with >60%V boysPrimary onlyPrimary with upper primaryPrimary with Upper primary & sec/higher7 125 26 127 56 0 0 086.8 42.914 215 126 414 157 0 2 0 V girls 90.0 50.6Upper primary only9 11 10 63 33 0 1 0 VII boys 80.2 21.5Upper primary with sec./higher secondary4 73 48 216 92 1 12 0 VII girls 86.7 29.4Para-teachers0 7 5 21 14 0 3 0%Teachers recvd.Gender and caste distribution of teachers*Regular teachers Para-teachers SC teachers ST teachers <strong>in</strong>-service tra<strong>in</strong><strong>in</strong>gSchool categoryAvg. No. of Tchs. Total Male Female No res Male Female No res Male Female Male Female Male FemalePrimary only2.2 1210 221 971 0 9 9 0 13 14 7 11 31.3 32.7Primary with upper prim.6.3 346 89 252 0 3 2 0 3 1 2 0 38.0 38.2Prim.with U.P.&Sec/H.S9.8 945 233 695 0 5 12 0 1 0 2 0 51.3 36.5Upper Primary only6.4 128 55 72 0 1 0 0 1 0 1 0 66.1 55.6U. Primary with Sec./H.S.7.3 455 201 245 0 6 3 0 0 1 6 3 59.9 61.7Enrolment by medium of <strong>in</strong>structions% Total Primary Upper Primary % Schools recvd. Incentives : Number of beneficiaries(Previous year)Grossness51.3(Previous academic year)School T L MCategory English Marathi Konkani Urdu Kannada dev. grant grantPrimary Upper primary6282Boys Girls Boys GirlsP. onlyP + UPP+sec/hsU.P. onlyUP+sec286516070216879401870528773994356821322862665901495GOA2923830515293247650001.65.53.15.04.81.30.00.05.03.2IncentiveTypeText booksUniformAttendanceStationery# = not applicable na = not available * Some totals may not match due to no response <strong>in</strong> classificatory data items1026437062445640978435896385336308226146209326244181220
SOUTH GOADistrictData reported fromNumber of blocks/taluksBasic Data, 2001Total population (<strong>in</strong> 000's)Decadal growth rateDISTRICT ELEMENTARY EDUCATION REPORT CARD : 2005-06State5 Number of Clusters 75 Number of villages279 Number of schools552589 % 0 - 6 population 11.2 % Urban population 55.8 Sex ratio 972 Sex ratio 0-693716.2 % SC population 1.1 % ST population na Overall literacy 80.1 Female literacy 73.7Primary cycle 1 - 4 U. primary cycle 5 - 7Key data: <strong>Elementary</strong> <strong>Education</strong>School categoryTotal schools* Rural schools* Total enrolment* Rural enrolment* Teachers*Govt. Private Govt. Private Govt. Private Govt Private Govt. PrivatePrimary only365 22 302 13 14,341 4,843 10,056 1,598 800 132Primary with upper primary23 14 19 7 2,268 4,400 1,548 2,198 164 124Primary with upper primary & sec/higher sec.13 56 8 30 2,002 24,371 1,128 11,176 76 687Upper primary only6 13 5 10 711 3,577 514 1,686 23 129Upper primary with sec./higher secondary22 18 19 12 2,881 4,081 2,123 1,755 133 149No response <strong>in</strong> school category0 0 0 0 0 0 0 0 0 0Performance <strong>in</strong>dicatorsSchool categoryEnrolment*P. only P + UP P+sec/hs U.P. only UP+sec Grade 2001-02 2002-03 2003-04 2004-05 2005-06% S<strong>in</strong>gle classroom schools36.2 5.4 4.3 5.3 2.5 I10,114% S<strong>in</strong>gle teacher schools39.3 2.7 1.4 10.5 2.5 II8,955% Schools with SCR > 600.8 0.0 11.6 0.0 0.0 III8,795% Schools with pre-primary sections 15.8 40.5 72.5 26.3 12.5 IV6,584% Schools with common toilets 37.0 67.6 66.7 68.4 75.0 V9,438% Schools with girls toilets 19.9 70.3 87.0 73.7 80.0 VI9,908% Schools with dr<strong>in</strong>k<strong>in</strong>g water facility 95.9 97.3 98.6 100.0 97.5 VII9,596% Schools with blackboard81.4 73.0 88.4 94.7 82.5 VIII85% Enrolment <strong>in</strong> Govt. schools 74.8 34.0 7.6 16.6 41.4 Total Pr.34,448% Enrolment <strong>in</strong> s<strong>in</strong>gle-teacher schools 10.8 0.1 0.0 6.0 0.2 Total U.P28,942% No female teacher schools (tch>=2) 1.6 5.4 4.3 0.0 2.5 Transition rateGER / NER% Enrolment <strong>in</strong> schools without build<strong>in</strong>g 0.0 0.0 0.0 0.0 0.0 Prim. to U. Prim2003-04 2004-05 2005-06%Enrolment <strong>in</strong> schools without blackboard 16.8 30.1 10.2 8.6 12.9 Primary Level GER (Primary)38.9SC/ST EnrolmentPrimary UpperOBC EnrolmentNER (Primary)44.0Retention rateprimaryPrimary U. PrimaryGER(U.Prim)53.2% SC enrolment3.2 0.698 % OBCGPI0.92 NER(U.Prim)25.37.1 3.0% SC girls to SC enrolment 49.2 47.5 EnrolmentFlow ratesEnrolment of children% ST enrolment11.6 5.6 % OBC girls toAll With disability48.1 49.3% ST girls to ST enrolment 45.4 50.0 OBC EnrolmentGrade R.R. D.O.R. P.R. Grade Girls Boys GirlsIndicatorsSchool categoryII 4,843 23 9P. only P + UP P+sec/hs U.P. only UP+sec IIII 4,325 22 12% Girls47.3 41.9 48.3 56.6 46.9 IIIIII 4,246 7 6Pupil-teacher ratio (PTR)21 23 35 28 25 IVIV 3,099 12 12Student-classroom ratio (SCR)21 30 35 23 20 VV 4,378 15 5% Schools with 1000.0 0.0 0.0 5.3 0.0 VIVII 4,653 7 6% Female teachers82.2 79.2 85.6 77.6 70.6 VII# # VIII 39 0 0% Schools established s<strong>in</strong>ce 19955.4 0.0 2.9 5.3 2.5 VIII # # # Total30,248 96 59Classrooms/Other roomsClassroomsNo. of schools by type of build<strong>in</strong>g*School categoryTotal % good % m<strong>in</strong>or % major OtherPartiallyMultiple NoPuccaKuccha Tentclassrooms condition repairs repairs roomsPuccaType Build<strong>in</strong>gPrimary only926 50.9 42.7 6.5 303 372 6 1 0 4 4Primary with upper primary224 64.3 35.3 0.4 11636 1 0 0 0 0Primary with U.P. & sec/higher758 82.7 15.3 2.0 32965 1 1 0 1 1Upper primary only183 92.3 7.7 0.0 9318 0 1 0 0 0Upper primary with sec./higher sec 349 62.5 30.1 7.4 21738 2 0 0 0 0Position of teachers by educational qualification (other than para teacher)Exam<strong>in</strong>ation resultsSchool category BelowHigherPost(Previous academic year)M. Phil.secondarysecondarygraduateNoresponse Term<strong>in</strong>al % % Passed62 564 104 154 39 3 1 2 grade Passed with >60%V boysPrimary onlyPrimary with upper primaryPrimary with Upper primary & sec/higher15 123 43 87 17 1 0 089.8 44.925 215 117 317 65 10 3 0 V girls 91.2 45.5Upper primary only3 42 8 74 21 1 1 0 VII boys 85.9 27.1Upper primary with sec./higher secondary9 66 22 117 53 0 14 0 VII girls 88.1 30.8Para-teachers0 4 1 8 1 5 0 0%Teachers recvd.Gender and caste distribution of teachers*Regular teachers Para-teachers SC teachers ST teachers <strong>in</strong>-service tra<strong>in</strong><strong>in</strong>gSchool categoryAvg. No. of Tchs. Total Male Female No res Male Female No res Male Female Male Female Male FemalePrimary only2.4 932 164 763 2 0 3 0 7 11 24 5 36.0 35.2Primary with upper prim.7.8 288 60 226 0 0 2 0 1 1 0 1 41.7 48.2Prim.with U.P.&Sec/H.S11.1 763 107 645 0 3 8 0 0 2 3 0 43.6 41.5Upper Primary only8.0 152 32 118 0 2 0 0 0 0 1 1 17.6 38.1U. Primary with Sec./H.S.7.1 282 82 199 0 1 0 0 0 0 6 1 53.0 46.2Enrolment by medium of <strong>in</strong>structions% Total Primary Upper Primary % Schools recvd. Incentives : Number of beneficiaries(Previous year)Grossness52.4(Previous academic year)School T L MCategory English Konkani Marathi Kannada Others dev. grant grantPrimary Upper primary4998Boys Girls Boys GirlsP. onlyP + UPP+sec/hsU.P. onlyUP+sec38431377426945868236520601039706169142583833209217GOA1521182188121174<strong>Elementary</strong> <strong>Education</strong>: Report Card - SOUTH GOA9200126400.30.02.95.32.50.30.00.00.00.0IncentiveTypeText booksUniformAttendanceStationery# = not applicable na = not available * Some totals may not match due to no response <strong>in</strong> classificatory data items667724623683422630523156423221318150188229263137204236131Goa


