

Jammu & Kashmir - DISE
Jammu & Kashmir - DISE
Jammu & Kashmir - DISE
- No tags were found...

Create successful ePaper yourself
Turn your PDF publications into a flip-book with our unique Google optimized e-Paper software.
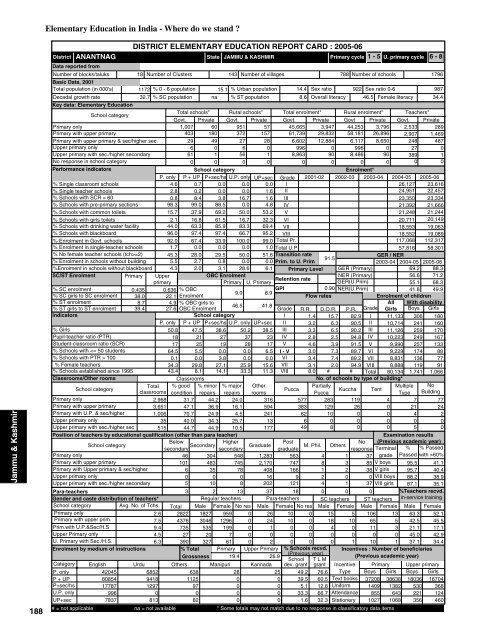
<strong>Jammu</strong> & <strong>Kashmir</strong>188Elementary Education in India - Where do we stand ?ANANTNAGDistrictData reported fromNumber of blocks/taluksBasic Data, 2001Total population (in 000's)Decadal growth rateDISTRICT ELEMENTARY EDUCATION REPORT CARD : 2005-06State18 Number of Clusters 143 Number of villages788 Number of schools17961172 % 0 - 6 population 15.1 % Urban population 14.4 Sex ratio 922 Sex ratio 0-698732.7 % SC population na % ST population8.6 Overall literacy 46.5 Female literacy 34.4Primary cycle 1 - 5 U. primary cycle 6 - 8Key data: Elementary EducationSchool categoryTotal schools* Rural schools* Total enrolment* Rural enrolment* Teachers*Govt. Private Govt. Private Govt. Private Govt Private Govt. PrivatePrimary only1,007 60 951 57 45,665 3,947 44,253 3,796 2,533 289Primary with upper primary403 180 372 157 61,739 29,832 58,181 26,896 2,907 1,469Primary with upper primary & sec/higher sec.29 49 27 28 6,602 12,884 6,117 8,650 248 487Upper primary only6 0 6 0 996 0 996 0 27 0Upper primary with sec./higher secondary61 1 56 1 8,863 90 8,486 90 389 1No response in school category0 0 0 0 0 0 0 0 0 0Performance indicatorsSchool categoryEnrolment*P. only P + UP P+sec/hs U.P. only UP+sec Grade 2001-02 2002-03 2003-04 2004-05 2005-06% Single classroom schools4.6 0.7 0.0 0.0 0.0 I26,127 23,616% Single teacher schools2.8 0.2 0.0 0.0 1.6 II24,951 22,457% Schools with SCR > 600.8 8.4 3.8 16.7 1.6 III23,350 23,334% Schools with pre-primary sections 98.3 99.0 88.5 0.0 4.8 IV21,392 21,666% Schools with common toilets 15.7 37.9 69.2 50.0 53.2 V21,248 21,244% Schools with girls toilets 2.1 16.8 61.5 16.7 32.3 VI20,711 20,149% Schools with drinking water facility 44.0 63.3 85.9 83.3 69.4 VII18,553 19,063% Schools with blackboard96.0 97.4 97.4 66.7 95.2 VIII 18,552 19,089% Enrolment in Govt. schools 92.0 67.4 33.9 100.0 99.0 Total Pr. 117,068 112,317% Enrolment in single-teacher schools1.7 0.0 0.0 0.0 1.0 Total U.P57,816 58,301% No female teacher schools (tch>=2) 45.3 28.0 29.5 50.0 51.6 Transition rateGER / NER91.5% Enrolment in schools without building 5.5 2.7 0.8 0.0 0.0 Prim. to U. Prim2003-04 2004-05 2005-06%Enrolment in schools without blackboard 4.3 2.0 3.1 28.6 6.1 Primary Level GER (Primary)69.2 88.3SC/ST EnrolmentPrimary UpperOBC EnrolmentNER (Primary)56.6 71.2Retention rateprimaryPrimary U. PrimaryGER(U.Prim)55.1 68.3% SC enrolment0.435 0.636 % OBCGPI0.90 NER(U.Prim)41.8 49.99.0 8.9% SC girls to SC enrolment 38.0 22.1 EnrolmentFlow ratesEnrolment of children% ST enrolment8.7 4.9 % OBC girls toAll With disability46.5 41.8% ST girls to ST enrolment 39.4 27.6 OBC EnrolmentGrade R.R. D.O.R. P.R. Grade Girls Boys GirlsIndicatorsSchool categoryI 1.4 15.7 82.9 I 11,133 306 180P. only P + UP P+sec/hs U.P. only UP+sec II 3.2 6.3 90.5 II 10,714 241 160% Girls50.8 47.5 38.6 50.2 38.5 III 3.3 6.5 90.2 III 11,126 259 170Pupil-teacher ratio (PTR)18 21 27 37 23 IV 2.8 2.5 94.8 IV 10,223 249 167Student-classroom ratio (SCR)17 25 19 28 17 V 4.6 3.9 91.5 V 9,990 257 133% Schools with 1000.1 0.0 3.8 0.0 0.0 VI 3.4 7.4 89.2 VII 8,831 136 77% Female teachers34.3 29.8 27.1 25.9 15.6 VII 3.1 2.0 94.9 VIII 8,888 119 91% Schools established since 199543.4 8.1 14.1 33.3 11.3 VIII 8.0 # # Total 80,134 1,741 1,066Classrooms/Other roomsClassroomsNo. of schools by type of building*School categoryTotal % good % minor % major OtherPartiallyMultiple NoPuccaKuccha Tentclassrooms condition repairs repairs roomsPuccaType BuildingPrimary only2,968 31.7 44.2 24.0 316 577 283 119 4 7 77Primary with upper primary3,651 47.1 36.9 16.1 594 383 129 26 0 21 24Primary with U.P. & sec/higher1,006 70.7 24.9 4.5 24162 10 0 0 4 2Upper primary only35 40.0 34.3 25.7 136 0 0 0 0 0Upper primary with sec./higher sec 515 44.7 44.9 10.5 17749 8 0 0 5 0Position of teachers by educational qualification (other than para teacher)Examination resultsSchool category BelowHigherPost(Previous academic year)M. Phil.secondarysecondarygraduateNoresponse Terminal % % Passed46 304 548 1,283 563 4 1 37 grade Passed with >60%V boysPrimary onlyPrimary with upper primaryPrimary with Upper primary & sec/higher101 483 745 2,170 747 8 3 8595.5 41.16 35 78 408 166 1 2 38 V girls 95.7 40.4Upper primary only0 0 0 16 9 2 0 0 VIII boys 88.2 38.9Upper primary with sec./higher secondary5 10 8 202 121 4 1 37 VIII girls 87.1 35.1Para-teachers3 2 13 37 18 0 0 0%Teachers recvd.Gender and caste distribution of teachers*Regular teachers Para-teachers SC teachers ST teachers in-service trainingSchool categoryAvg. No. of Tchs. Total Male Female No res Male Female No res Male Female Male Female Male FemalePrimary only2.6 2822 1827 959 0 26 10 0 15 5 106 13 63.3 52.1Primary with upper prim.7.5 4376 3046 1296 0 24 10 0 18 10 65 5 42.5 45.5Prim.with U.P.&Sec/H.S9.4 735 535 199 0 1 0 0 4 0 11 3 21.1 17.1Upper Primary only4.5 27 20 7 0 0 0 0 0 0 0 0 45.0 42.9U. Primary with Sec./H.S.6.3 390 327 61 0 2 0 0 0 1 10 1 37.1 34.4Enrolment by medium of instructions% Total Primary Upper Primary % Schools recvd. Incentives : Number of beneficiaries(Previous year)Grossness 19.4 26.9(Previous academic year)School T L MCategory English Urdu Others Manipuri Kannada dev. grant grantPrimary Upper primary42045Boys Girls Boys GirlsP. onlyP + UPP+sec/hsU.P. onlyUP+sec808541778799678376852941812970813638112597082JAMMU & KASHMIR28000025000049.239.55.133.31.676.660.512.866.732.3IncentiveTypeText booksUniformAttendanceStationery# = not applicable na = not available * Some totals may not match due to no response in classificatory data items372081409855102738638138264310681803653022135616704368124460
<strong>Jammu</strong> & <strong>Kashmir</strong>190Elementary Education in India - Where do we stand ?BARAMULADistrictData reported fromNumber of blocks/taluksBasic Data, 2001Total population (in 000's)Decadal growth rateDISTRICT ELEMENTARY EDUCATION REPORT CARD : 2005-06State22 Number of Clusters 183 Number of villages855 Number of schools19871170 % 0 - 6 population 15.8 % Urban population 16.8 Sex ratio 903 Sex ratio 0-696331.2 % SC population na % ST population7.2 Overall literacy 45.4 Female literacy 48.1Primary cycle 1 - 5 U. primary cycle 6 - 8Key data: Elementary EducationSchool categoryTotal schools* Rural schools* Total enrolment* Rural enrolment* Teachers*Govt. Private Govt. Private Govt. Private Govt Private Govt. PrivatePrimary only1,116 83 1,029 74 39,449 5,430 37,000 4,870 2,533 323Primary with upper primary490 126 459 101 62,638 23,702 59,057 18,161 3,324 735Primary with upper primary & sec/higher sec.65 35 61 23 12,973 12,031 12,124 6,814 593 253Upper primary only6 0 3 0 751 0 460 0 37 0Upper primary with sec./higher secondary49 0 42 0 6,947 0 6,283 0 345 0No response in school category17 0 0 0 0 0 0 0 0 0Performance indicatorsSchool categoryEnrolment*P. only P + UP P+sec/hs U.P. only UP+sec Grade 2001-02 2002-03 2003-04 2004-05 2005-06% Single classroom schools8.2 0.2 0.0 0.0 0.0 I23,829 24,785% Single teacher schools8.9 0.0 0.0 0.0 0.0 II23,812 21,398% Schools with SCR > 600.2 4.1 6.0 0.0 4.1 III20,826 22,698% Schools with pre-primary sections 93.4 94.5 75.0 0.0 2.0 IV20,104 20,409% Schools with common toilets 19.0 47.9 66.0 16.7 55.1 V19,144 19,951% Schools with girls toilets 3.0 16.7 48.0 0.0 38.8 VI18,252 18,840% Schools with drinking water facility 36.8 53.9 76.0 50.0 69.4 VII17,348 18,425% Schools with blackboard90.2 93.5 89.0 100.0 87.8 VIII 16,441 17,415% Enrolment in Govt. schools 87.9 72.5 51.9 100.0 100.0 Total Pr. 107,715 109,241% Enrolment in single-teacher schools6.9 0.0 0.0 0.0 0.0 Total U.P52,041 54,680% No female teacher schools (tch>=2) 45.5 28.4 36.0 50.0 34.7 Transition rateGER / NER94.6% Enrolment in schools without building 1.1 0.2 0.0 0.0 0.0 Prim. to U. Prim2003-04 2004-05 2005-06%Enrolment in schools without blackboard 8.6 6.3 15.6 0.0 13.9 Primary Level GER (Primary)64.1 86.1SC/ST EnrolmentPrimary UpperOBC EnrolmentNER (Primary)51.3 67.7Retention rateprimaryPrimary U. PrimaryGER(U.Prim)90.0 64.2% SC enrolment0.407 0.657 % OBCGPI0.89 NER(U.Prim)37.1 48.06.9 5.3% SC girls to SC enrolment 43.6 49.3 EnrolmentFlow ratesEnrolment of children% ST enrolment7.3 5.6 % OBC girls toAll With disability46.4 43.7% ST girls to ST enrolment 40.8 33.2 OBC EnrolmentGrade R.R. D.O.R. P.R. Grade Girls Boys GirlsIndicatorsSchool categoryI 2.0 11.1 86.9 I 11,848 401 196P. only P + UP P+sec/hs U.P. only UP+sec II 2.9 4.7 92.5 II 10,162 396 204% Girls49.0 46.7 43.0 0.1 50.0 III 3.3 1.5 95.2 III 10,809 415 238Pupil-teacher ratio (PTR)16 21 30 20 20 IV 2.9 1.3 95.8 IV 9,404 366 195Student-classroom ratio (SCR)15 24 24 21 17 V 3.6 1.9 94.6 V 9,151 368 216% Schools with 1000.0 0.0 4.0 0.0 2.0 VI 4.0VII 8,464 211 133% Female teachers32.9 31.2 26.8 27.0 30.4 VII 3.8 2.6 93.5 VIII 7,942 180 96% Schools established since 199547.8 6.0 7.0 16.7 0.0 VIII 7.2 # # Total 76,493 2,595 1,427Classrooms/Other roomsClassroomsNo. of schools by type of building*School categoryTotal % good % minor % major OtherPartiallyMultiple NoPuccaKuccha Tentclassrooms condition repairs repairs roomsPuccaType BuildingPrimary only3,004 22.1 53.3 24.6 352 559 440 94 1 14 87Primary with upper primary3,608 33.6 47.0 19.4 691 334 191 25 0 53 12Primary with U.P. & sec/higher1,057 44.7 40.2 15.1 32356 22 0 0 20 2Upper primary only35 28.6 60.0 11.4 193 1 1 0 1 0Upper primary with sec./higher sec 417 32.6 43.6 23.7 16430 10 1 0 8 0Position of teachers by educational qualification (other than para teacher)Examination resultsSchool category BelowHigherPost(Previous academic year)M. Phil.secondarysecondarygraduateNoresponse Terminal % % Passed54 327 749 1,234 452 7 3 29 grade Passed with >60%V boysPrimary onlyPrimary with upper primaryPrimary with Upper primary & sec/higher46 433 894 1,890 695 10 12 7994.5 41.812 72 119 421 202 1 2 17 V girls 94.0 39.5Upper primary only0 1 6 13 17 0 0 0 VIII boys 85.7 31.6Upper primary with sec./higher secondary1 22 24 193 103 1 0 1 VIII girls 85.5 31.1Para-teachers0 0 0 1 0 0 0 0%Teachers recvd.Gender and caste distribution of teachers*Regular teachers Para-teachers SC teachers ST teachers in-service trainingSchool categoryAvg. No. of Tchs. Total Male Female No res Male Female No res Male Female Male Female Male FemalePrimary only2.4 2856 1916 939 0 1 0 0 11 4 135 36 60.1 51.0Primary with upper prim.6.6 4059 2791 1268 0 0 0 0 14 7 202 42 44.4 44.2Prim.with U.P.&Sec/H.S8.5 846 619 227 0 0 0 0 1 3 48 11 32.1 26.4Upper Primary only6.2 37 27 10 0 0 0 0 0 0 0 0 63.0 40.0U. Primary with Sec./H.S.7.0 345 240 105 0 0 0 0 1 1 15 5 32.1 45.7Enrolment by medium of instructions% Total Primary Upper Primary % Schools recvd. Incentives : Number of beneficiaries(Previous year)Grossness 21.4 25.3(Previous academic year)School T L MCategory English Urdu Others Gujaratidev. grant grantPrimary Upper primary44000Boys Girls Boys GirlsP. onlyP + UPP+sec/hsU.P. onlyUP+sec8457724706751679036611812980157428582000JAMMU & KASHMIR50000037.436.08.033.310.277.276.136.083.330.6IncentiveTypeText booksUniformAttendanceStationery# = not applicable na = not available * Some totals may not match due to no response in classificatory data items3719894816842436437782178402188711951112381697811783271
DODADistrictData reported fromNumber of blocks/taluksBasic Data, 2001Total population (in 000's)Decadal growth rateDISTRICT ELEMENTARY EDUCATION REPORT CARD : 2005-06StateJAMMU & KASHMIR22 Number of Clusters 177 Number of villages616 Number of schools1870692 % 0 - 6 population 17.2 % Urban population 6.9 Sex ratio 903 Sex ratio 0-696426.8 % SC population 9.1 % ST population11.5 Overall literacy 47.9 Female literacy 29.9Primary cycle 1 - 5 U. primary cycle 6 - 8Key data: Elementary EducationSchool categoryTotal schools* Rural schools* Total enrolment* Rural enrolment* Teachers*Govt. Private Govt. Private Govt. Private Govt Private Govt. PrivatePrimary only1,222 41 1,205 34 40,998 1,807 40,661 1,422 2,686 178Primary with upper primary396 45 383 35 41,047 6,508 39,433 4,981 2,514 313Primary with upper primary & sec/higher sec.114 16 110 11 17,240 4,331 16,643 2,539 945 114Upper primary only0 0 0 0 0 0 0 0 0 0Upper primary with sec./higher secondary8 0 8 0 1,070 0 1,070 0 57 0No response in school category28 0 0 0 0 0 0 0 0 0Performance indicatorsSchool categoryEnrolment*P. only P + UP P+sec/hs U.P. only UP+sec Grade 2001-02 2002-03 2003-04 2004-05 2005-06% Single classroom schools23.0 12.5 1.5 0.0 0.0 I18,971 19,338% Single teacher schools14.9 0.5 0.0 0.0 0.0 II13,994 16,104% Schools with SCR > 602.1 17.5 17.7 0.0 12.5 III11,181 15,290% Schools with pre-primary sections 16.9 18.6 6.2 0.0 0.0 IV10,814 13,168% Schools with common toilets 1.3 5.7 13.1 0.0 12.5 V10,438 12,793% Schools with girls toilets 0.5 2.5 6.2 0.0 12.5 VI9,535 12,511% Schools with drinking water facility 20.0 26.1 37.7 0.0 37.5 VII7,864 12,028% Schools with blackboard78.5 86.6 85.4 0.0 62.5 VIII 8,871 11,769% Enrolment in Govt. schools 95.8 86.3 79.9 0.0 100.0 Total Pr. 65,398 76,693% Enrolment in single-teacher schools 12.0 0.3 0.0 0.0 0.0 Total U.P26,270 36,308% No female teacher schools (tch>=2) 42.9 31.5 40.8 0.0 37.5 Transition rateGER / NER100.0% Enrolment in schools without building 0.6 0.2 0.0 0.0 0.0 Prim. to U. Prim2003-04 2004-05 2005-06%Enrolment in schools without blackboard 19.9 14.6 11.4 0.0 38.2 Primary Level GER (Primary)66.7 102.2SC/ST EnrolmentPrimary UpperOBC EnrolmentNER (Primary)56.8 81.4Retention rateprimaryPrimary U. PrimaryGER(U.Prim)43.2 72.0% SC enrolment10.2 11.4 % OBCGPI0.75 NER(U.Prim)35.2 52.35.3 6.5% SC girls to SC enrolment 45.7 42.8 EnrolmentFlow ratesEnrolment of children% ST enrolment12.8 7.6 % OBC girls toAll With disability41.0 37.7% ST girls to ST enrolment 35.4 30.6 OBC EnrolmentGrade R.R. D.O.R. P.R. Grade Girls Boys GirlsIndicatorsSchool categoryI 3.4 13.4 83.3 I 8,729 230 115P. only P + UP P+sec/hs U.P. only UP+sec II 2.2II 7,244 224 119% Girls44.2 39.7 40.7 0.0 33.3 III 1.6III 6,446 217 103Pupil-teacher ratio (PTR)15 17 20 0 19 IV 1.3IV 5,264 167 109Student-classroom ratio (SCR)16 33 32 0 20 V 1.2V 5,101 119 73% Schools with 1000.0 0.2 0.0 0.0 0.0 VI 3.0VII 4,790 157 67% Female teachers29.7 36.3 27.2 0.0 22.8 VII 2.2VIII 4,434 108 51% Schools established since 199543.2 9.3 3.8 0.0 0.0 VIII 7.6 # # Total 46,961 1,336 727Classrooms/Other roomsClassroomsNo. of schools by type of building*School categoryTotal % good % minor % major OtherPartiallyMultiple NoPuccaKuccha Tentclassrooms condition repairs repairs roomsPuccaType BuildingPrimary only2,750 50.3 39.6 10.1 273 588 522 113 1 14 25Primary with upper primary1,428 50.8 39.2 9.9 274 193 182 27 0 33 6Primary with U.P. & sec/higher667 49.2 42.7 8.1 15962 49 5 0 13 0Upper primary only0 0.0 0.0 0.000 0 0 0 0 0Upper primary with sec./higher sec54 46.3 38.9 14.8 863 2 1 0 2 0Position of teachers by educational qualification (other than para teacher)Examination resultsSchool category BelowHigherPost(Previous academic year)M. Phil.secondarysecondarygraduateNoresponse Terminal % % Passed78 453 995 950 259 2 1 57 grade Passed with >60%V boysPrimary onlyPrimary with upper primaryPrimary with Upper primary & sec/higherUpper primary onlyUpper primary with sec./higher secondaryPara-teachersGender and caste distribution of teachers*School categoryAvg. No. of Tchs.Primary only2.3 2864 1961Primary with upper prim.6.4 2827 1751 1004 5 44Prim.with U.P.&Sec/H.S8.1 1059 767 288 0 4Upper Primary only0.0 0 0 0 0 0U. Primary with Sec./H.S.7.1 57 44 13 0 0Enrolment by medium of instructions% Total Primary Upper PrimaryGrossness 20.3 27.3Category Urdu Hindi English OthersP. only310248972270440P + UP296821102068470P+sec/hs12039487746550U.P. only0000UP+sec912115430Elementary Education: Report Card - DODA48 494 893 975 300 3 1 4625 188 162 437 213 1 0 29 V girls0 0 0 0 0 0 0 0 VIII boys0 12 6 20 19 0 0 0 VIII girls1 6 64 52 15 0 0 0Regular teachers Para-teachers SC teachers ST teachersTotal Male Female No res Male Female No res Male Female Male Female825 9 44 25 0 137 55 108 2423000001156105317091330Male Female69.0 50.849.6 31.730.1 18.40.0 0.00 0 2 0 0 1 13.6 0.0% Schools recvd. Incentives : Number of beneficiaries(Previous year)(Previous academic year)School T L Mdev. grant grant Incentive Primary Upper primary68.7 67.5 Type Boys Girls Boys Girls73.0 79.1 Text books 35058 26289 18473 1078451.5 73.8 Uniform 60 30 75 400.0 0.0 Attendance 441 285 207 11212.5 62.5 Stationery 301 191 173 90# = not applicable na = not available * Some totals may not match due to no response in classificatory data items142096.8 43.197.1 42.087.1 24.890.4 26.3%Teachers recvd.in-service training191<strong>Jammu</strong> & <strong>Kashmir</strong>
<strong>Jammu</strong> & <strong>Kashmir</strong>192Elementary Education in India - Where do we stand ?JAMMUDistrictData reported fromNumber of blocks/taluksBasic Data, 2001Total population (in 000's)Decadal growth rateDISTRICT ELEMENTARY EDUCATION REPORT CARD : 2005-06StateJAMMU & KASHMIR18 Number of Clusters 146 Number of villages1037 Number of schools24371589 % 0 - 6 population 12.5 % Urban population 44.1 Sex ratio 868 Sex ratio 0-681628.4 % SC population 24.9 % ST population3.4 Overall literacy 77.0 Female literacy 68.5Primary cycle 1 - 5 U. primary cycle 6 - 8Key data: Elementary EducationSchool categoryTotal schools* Rural schools* Total enrolment* Rural enrolment* Teachers*Govt. Private Govt. Private Govt. Private Govt Private Govt. PrivatePrimary only989 170 909 129 28,294 10,371 25,504 7,724 2,293 1,013Primary with upper primary361 368 303 263 39,854 44,979 31,369 32,613 2,286 3,167Primary with upper primary & sec/higher sec.137 392 107 184 29,751 100,662 20,893 45,630 1,504 4,042Upper primary only2 0 2 0 151 0 151 0 15 0Upper primary with sec./higher secondary18 0 13 0 2,023 0 1,631 0 161 0No response in school category0 0 0 0 0 0 0 0 0 0Performance indicatorsSchool categoryEnrolment*P. only P + UP P+sec/hs U.P. only UP+sec Grade 2001-02 2002-03 2003-04 2004-05 2005-06% Single classroom schools9.7 1.1 0.2 0.0 0.0 I35,551 34,749% Single teacher schools8.4 0.3 0.0 0.0 0.0 II30,183 32,006% Schools with SCR > 600.3 2.5 0.9 50.0 0.0 III29,167 31,885% Schools with pre-primary sections 62.6 69.1 73.3 0.0 0.0 IV29,035 31,046% Schools with common toilets 22.8 67.6 77.7 100.0 61.1 V29,516 31,328% Schools with girls toilets 12.5 57.8 87.1 0.0 61.1 VI29,268 31,129% Schools with drinking water facility 65.0 91.4 95.8 50.0 100.0 VII28,999 31,204% Schools with blackboard79.8 87.8 91.9 100.0 88.9 VIII 29,923 32,738% Enrolment in Govt. schools 73.2 47.0 22.8 100.0 100.0 Total Pr. 153,452 161,014% Enrolment in single-teacher schools5.8 0.1 0.0 0.0 0.0 Total U.P88,190 95,071% No female teacher schools (tch>=2) 16.9 4.4 2.3 0.0 11.1 Transition rateGER / NER100.0% Enrolment in schools without building 8.7 0.0 0.0 0.0 0.0 Prim. to U. Prim2003-04 2004-05 2005-06%Enrolment in schools without blackboard 16.3 13.8 9.3 0.0 15.3 Primary Level GER (Primary)67.8 93.5SC/ST EnrolmentPrimary UpperOBC EnrolmentNER (Primary)53.0 75.1Retention rateprimaryPrimary U. PrimaryGER(U.Prim)62.8 82.1% SC enrolment29.0 30.3 % OBCGPI0.83 NER(U.Prim)46.3 60.15.4 5.6% SC girls to SC enrolment 46.7 47.9 EnrolmentFlow ratesEnrolment of children% ST enrolment6.2 4.9 % OBC girls toAll With disability46.0 48.7% ST girls to ST enrolment 44.8 41.4 OBC EnrolmentGrade R.R. D.O.R. P.R. Grade Girls Boys GirlsIndicatorsSchool categoryI 1.9 8.8 89.3 I 15,520 147 91P. only P + UP P+sec/hs U.P. only UP+sec II 0.8II 14,354 99 76% Girls48.3 46.4 44.7 88.7 34.7 III 0.6III 14,453 126 72Pupil-teacher ratio (PTR)12 16 24 10 13 IV 0.5IV 14,273 102 75Student-classroom ratio (SCR)13 17 17 19 14 V 0.8V 14,334 120 74% Schools with 1000.1 0.0 0.0 0.0 0.0 VI 2.3VII 14,522 78 51% Female teachers56.9 63.1 65.9 80.0 40.4 VII 2.3VIII 15,309 98 73% Schools established since 199533.6 12.5 10.4 50.0 5.6 VIII 13.1 # # Total 117,088 871 576Classrooms/Other roomsClassroomsNo. of schools by type of building*School categoryTotal % good % minor % major OtherPartiallyMultiple NoPuccaKuccha Tentclassrooms condition repairs repairs roomsPuccaType BuildingPrimary only2,888 70.0 21.9 8.1 1,133 951 6 3 0 28 171Primary with upper primary4,970 82.0 12.7 5.3 1,513 700 4 0 0 20 5Primary with U.P. & sec/higher7,855 91.5 6.2 2.3 2,550 505 2 0 0 22 0Upper primary only8 25.0 75.0 0.042 0 0 0 0 0Upper primary with sec./higher sec 148 56.1 26.4 17.6 9217 0 0 0 1 0Position of teachers by educational qualification (other than para teacher)Examination resultsSchool category BelowHigherPost(Previous academic year)M. Phil.secondarysecondarygraduateNoresponse Terminal % % Passed55 403 788 1,326 654 22 2 18 grade Passed with >60%V boysPrimary onlyPrimary with upper primaryPrimary with Upper primary & sec/higherUpper primary onlyUpper primary with sec./higher secondaryPara-teachersGender and caste distribution of teachers*School categoryAvg. No. of Tchs.Primary only2.9 3306 1406Primary with upper prim.7.5 5453 2004 3426 0 10Prim.with U.P.&Sec/H.S10.5 5546 1877 3625 0 16Upper Primary only7.5 15 3 12 0 0U. Primary with Sec./H.S.8.9 161 96 64 0 0Enrolment by medium of instructions% Total Primary Upper PrimaryGrossness 19.6 26.8Category English Hindi Urdu Others ManipuriP. only8511270693006720P + UP3397548625222580P+sec/hs974913115716731379U.P. only01341700UP+sec467138116015071 469 1,195 2,479 1,127 30 12 4732 258 512 2,945 1,638 48 10 59 V girls0 4 0 5 5 1 0 0 VIII boys4 17 4 66 62 1 0 6 VIII girls2 8 9 35 36 0 1 0Regular teachers Para-teachers SC teachers ST teachersTotal Male Female No res Male Female No res Male Female Male Female1862 0 20 18 0 335 291 103 481328000043025304252661733005932088.3 42.8%Teachers recvd.in-service trainingMale Female66.8 47.632.0 23.214.6 6.233.3 50.01 0 8 3 3 1 31.3 26.2% Schools recvd. Incentives : Number of beneficiaries(Previous year)(Previous academic year)School T L Mdev. grant grant Incentive Primary Upper primary78.1 79.3 Type Boys Girls Boys Girls48.0 48.6 Text books 26692 27333 16812 1803719.5 21.9 Uniform 1157 992 330 309100.0 100.0 Attendance 3513 3356 3775 349166.7 83.3 Stationery 578 543 408 435# = not applicable na = not available * Some totals may not match due to no response in classificatory data items99.7 62.499.7 64.087.6 44.1
KARGILDistrictData reported fromNumber of blocks/taluksBasic Data, 2001Total population (in 000's)Decadal growth rateDISTRICT ELEMENTARY EDUCATION REPORT CARD : 2005-06State7 Number of Clusters 54 Number of villages126 Number of schools503119 % 0 - 6 population 16.2 % Urban population 8.9 Sex ratio 837 Sex ratio 0-698031.4 % SC population 0.1 % ST population88.3 Overall literacy 60.8 Female literacy 42.4Primary cycle 1 - 5 U. primary cycle 6 - 8Key data: Elementary EducationSchool categoryTotal schools* Rural schools* Total enrolment* Rural enrolment* Teachers*Govt. Private Govt. Private Govt. Private Govt Private Govt. PrivatePrimary only300 25 284 22 5,416 962 5,137 707 595 105Primary with upper primary106 19 102 15 6,449 1,544 6,067 1,136 577 134Primary with upper primary & sec/higher sec.13 12 12 7 1,008 2,134 923 836 74 94Upper primary only2 0 2 0 150 0 150 0 12 0Upper primary with sec./higher secondary22 1 21 0 1,541 144 1,481 0 105 5No response in school category3 0 0 0 0 0 0 0 0 0Performance indicatorsSchool categoryEnrolment*P. only P + UP P+sec/hs U.P. only UP+sec Grade 2001-02 2002-03 2003-04 2004-05 2005-06% Single classroom schools16.3 1.6 0.0 0.0 0.0 I2,022 3,088% Single teacher schools24.9 0.0 0.0 0.0 0.0 II1,704 2,563% Schools with SCR > 600.3 0.0 0.0 0.0 0.0 III1,584 2,584% Schools with pre-primary sections 91.7 68.8 64.0 0.0 0.0 IV1,631 2,406% Schools with common toilets 45.8 74.4 88.0 100.0 91.3 V1,616 2,355% Schools with girls toilets 4.9 22.4 60.0 0.0 47.8 VI1,207 2,147% Schools with drinking water facility 42.5 61.6 96.0 50.0 73.9 VII1,180 2,142% Schools with blackboard98.5 99.2 100.0 100.0 100.0 VIII 970 2,063% Enrolment in Govt. schools 84.9 80.7 32.1 100.0 91.5 Total Pr. 8,557 12,996% Enrolment in single-teacher schools 14.8 0.0 0.0 0.0 0.0 Total U.P3,357 6,352% No female teacher schools (tch>=2) 35.1 40.0 32.0 0.0 52.2 Transition rateGER / NER100.0% Enrolment in schools without building 0.8 0.0 0.0 0.0 0.0 Prim. to U. Prim2003-04 2004-05 2005-06%Enrolment in schools without blackboard 1.3 0.8 0.0 0.0 0.0 Primary Level GER (Primary)49.9 100.4SC/ST EnrolmentPrimary UpperOBC EnrolmentNER (Primary)37.4 94.0Retention rateprimaryPrimary U. PrimaryGER(U.Prim)31.6 73.1% SC enrolment1.1 1.1 % OBCGPI0.94 NER(U.Prim)20.8 60.50.000 0.000% SC girls to SC enrolment 39.9 51.4 EnrolmentFlow ratesEnrolment of children% ST enrolment98.6 98.8 % OBC girls toAll With disability0.0 0.0% ST girls to ST enrolment 48.7 48.6 OBC EnrolmentGrade R.R. D.O.R. P.R. Grade Girls Boys GirlsIndicatorsSchool categoryI 0.1I 1,463 43 26P. only P + UP P+sec/hs U.P. only UP+sec IIII 1,203 43 37% Girls52.2 52.0 34.1 18.7 48.0 IIIIII 1,308 50 38Pupil-teacher ratio (PTR)9 11 19 13 15 IVIV 1,148 44 28Student-classroom ratio (SCR)9 14 13 25 12 V 0.1V 1,190 56 25% Schools with 1000.0 0.0 0.0 0.0 0.0 VIVII 1,041 31 12% Female teachers30.3 24.6 26.8 16.7 12.7 VIIVIII 1,043 31 24% Schools established since 199538.2 18.4 16.0 0.0 0.0 VIII# # Total 9,400 336 205Classrooms/Other roomsClassroomsNo. of schools by type of building*School categoryTotal % good % minor % major OtherPartiallyMultiple NoPuccaKuccha Tentclassrooms condition repairs repairs roomsPuccaType BuildingPrimary only713 57.8 33.5 8.7 201 173 46 103 0 0 3Primary with upper primary561 63.8 25.8 10.3 19993 19 12 0 1 0Primary with U.P. & sec/higher247 85.4 5.7 8.9 10721 3 1 0 0 0Upper primary only6 0.0 50.0 50.051 0 1 0 0 0Upper primary with sec./higher sec 136 58.8 27.9 13.2 12823 0 0 0 0 0Position of teachers by educational qualification (other than para teacher)Examination resultsSchool category BelowHigherPost(Previous academic year)M. Phil.secondarysecondarygraduateNoresponse Terminal % % Passed21 280 338 54 2 0 0 0 grade Passed with >60%V boysPrimary onlyPrimary with upper primaryPrimary with Upper primary & sec/higher32 217 315 126 19 0 0 098.1 35.15 31 74 50 8 0 0 0 V girls 95.7 28.7Upper primary only0 5 4 1 1 0 0 0 VIII boys 95.2 35.5Upper primary with sec./higher secondary4 31 33 20 20 0 0 0 VIII girls 92.6 26.7Para-teachers0 0 8 2 0 0 0 0%Teachers recvd.Gender and caste distribution of teachers*Regular teachers Para-teachers SC teachers ST teachers in-service trainingSchool categoryAvg. No. of Tchs. Total Male Female No res Male Female No res Male Female Male Female Male FemalePrimary only2.2 700 483 212 0 5 0 0 5 1 466 199 76.2 67.9Primary with upper prim.5.7 711 535 174 0 1 1 0 2 0 494 169 55.8 55.4Prim.with U.P.&Sec/H.S6.7 168 123 45 0 0 0 0 2 0 102 28 36.6 15.6Upper Primary only6.0 12 10 1 0 0 1 0 0 0 8 1 60.0 50.0U. Primary with Sec./H.S.4.8 110 94 14 0 2 0 0 4 0 75 14 36.5 57.1Enrolment by medium of instructions% Total Primary Upper Primary % Schools recvd. Incentives : Number of beneficiaries(Previous year)Grossness 6.4 17.1(Previous academic year)School T L MCategory Urdu English Manipuri Gujaratidev. grant grantPrimary Upper primary4999Boys Girls Boys GirlsP. onlyP + UPP+sec/hsU.P. onlyUP+sec56618761501326126023322067035981019900JAMMU & KASHMIR200000Elementary Education: Report Card - KARGIL79.178.416.050.00.081.880.032.050.013.0IncentiveTypeText booksUniformAttendanceStationery# = not applicable na = not available * Some totals may not match due to no response in classificatory data items33643229140469146854697515695410791670340249461193<strong>Jammu</strong> & <strong>Kashmir</strong>
<strong>Jammu</strong> & <strong>Kashmir</strong>194Elementary Education in India - Where do we stand ?KATHUADistrictData reported fromNumber of blocks/taluksBasic Data, 2001Total population (in 000's)Decadal growth rateDISTRICT ELEMENTARY EDUCATION REPORT CARD : 2005-06StateJAMMU & KASHMIR13 Number of Clusters 105 Number of villages525 Number of schools1468550 % 0 - 6 population 14.8 % Urban population 14.3 Sex ratio 901 Sex ratio 0-684120.9 % SC population 23.2 % ST population6.2 Overall literacy 65.6 Female literacy 54.4Primary cycle 1 - 5 U. primary cycle 6 - 8Key data: Elementary EducationSchool categoryTotal schools* Rural schools* Total enrolment* Rural enrolment* Teachers*Govt. Private Govt. Private Govt. Private Govt Private Govt. PrivatePrimary only759 110 738 96 19,821 4,705 18,958 4,081 1,718 532Primary with upper primary328 111 314 95 31,355 11,754 28,907 9,790 1,992 769Primary with upper primary & sec/higher sec.83 76 78 44 12,614 16,896 11,108 9,406 650 608Upper primary only0 0 0 0 0 0 0 0 0 0Upper primary with sec./higher secondary1 0 1 0 244 0 244 0 8 0No response in school category0 0 0 0 0 0 0 0 0 0Performance indicatorsSchool categoryEnrolment*P. only P + UP P+sec/hs U.P. only UP+sec Grade 2001-02 2002-03 2003-04 2004-05 2005-06% Single classroom schools15.2 3.4 0.0 0.0 0.0 I13,584% Single teacher schools10.1 0.0 0.0 0.0 0.0 II12,264% Schools with SCR > 600.3 3.6 1.9 0.0 0.0 III12,924% Schools with pre-primary sections 78.8 74.0 78.0 0.0 0.0 IV11,843% Schools with common toilets 28.4 56.5 73.0 0.0 0.0 V11,989% Schools with girls toilets 11.4 35.1 73.0 0.0 0.0 VI11,868% Schools with drinking water facility 84.2 91.8 95.0 0.0 100.0 VII11,255% Schools with blackboard87.1 97.7 99.4 0.0 0.0 VIII 11,662% Enrolment in Govt. schools 80.8 72.7 42.7 0.0 100.0 Total Pr. 62,604% Enrolment in single-teacher schools8.1 0.0 0.0 0.0 0.0 Total U.P34,785% No female teacher schools (tch>=2) 29.6 15.3 13.8 0.0 0.0 Transition rateGER / NER% Enrolment in schools without building 9.3 0.0 0.0 0.0 0.0 Prim. to U. Prim2003-04 2004-05 2005-06%Enrolment in schools without blackboard 9.6 1.6 0.4 0.0 100.0 Primary Level GER (Primary)104.9SC/ST EnrolmentPrimary UpperOBC EnrolmentNER (Primary)85.3Retention rateprimaryPrimary U. PrimaryGER(U.Prim)86.8% SC enrolment25.0 25.5 % OBCGPI0.78 NER(U.Prim)61.16.5 8.5% SC girls to SC enrolment 45.6 44.2 EnrolmentFlow ratesEnrolment of children% ST enrolment8.8 5.2 % OBC girls toAll With disability45.3 44.4% ST girls to ST enrolment 39.0 33.8 OBC EnrolmentGrade R.R. D.O.R. P.R. Grade Girls Boys GirlsIndicatorsSchool categoryII 5,900 104 60P. only P + UP P+sec/hs U.P. only UP+sec IIII 5,349 67 51% Girls48.5 44.2 38.8 0.0 32.8 IIIIII 5,696 88 49Pupil-teacher ratio (PTR)11 16 23 0 31 IVIV 5,224 73 58Student-classroom ratio (SCR)14 19 17 0 35 VV 5,218 91 53% Schools with 1000.0 0.0 0.0 0.0 0.0 VIVII 4,908 61 34% Female teachers45.4 43.6 43.0 0.0 12.5 VIIVIII 5,036 51 35% Schools established since 199540.5 9.8 6.9 0.0 0.0 VIII# # Total 42,471 603 366Classrooms/Other roomsClassroomsNo. of schools by type of building*School categoryTotal % good % minor % major OtherPartiallyMultiple NoPuccaKuccha Tentclassrooms condition repairs repairs roomsPuccaType BuildingPrimary only1,804 69.0 19.9 11.1 537 552 74 38 0 62 143Primary with upper primary2,241 66.8 21.5 11.8 743 296 37 3 0 100 1Primary with U.P. & sec/higher1,747 79.9 11.9 8.2 671 117 2 0 0 39 1Upper primary only0 0.0 0.0 0.000 0 0 0 0 0Upper primary with sec./higher sec7 0.0 57.1 42.921 0 0 0 0 0Position of teachers by educational qualification (other than para teacher)Examination resultsSchool category BelowHigherPost(Previous academic year)M. Phil.secondarysecondarygraduateNoresponse Terminal % % Passed23 229 494 977 486 19 1 2 grade Passed with >60%V boysPrimary onlyPrimary with upper primaryPrimary with Upper primary & sec/higherUpper primary onlyUpper primary with sec./higher secondaryPara-teachersGender and caste distribution of teachers*School categoryAvg. No. of Tchs.Primary only2.6 2250 1222Primary with upper prim.6.3 2761 1539 1195 0 18Prim.with U.P.&Sec/H.S7.9 1258 717 541 0 0Upper Primary only0.0 0 0 0 0 0U. Primary with Sec./H.S.8.0 8 7 1 0 0Enrolment by medium of instructions% Total Primary Upper PrimaryGrossness 18.7 29.7Category Hindi English Urdu Malayalam OthersP. only16172350948161811P + UP290908742527700P+sec/hs929716895331800U.P. only00000UP+sec244000032 292 503 1,232 648 25 1 15 70 108 681 384 8 0 2 V girls0 0 0 0 0 0 0 0 VIII boys0 1 0 5 2 0 0 0 VIII girls0 0 15 18 11 2 0 0Regular teachers Para-teachers SC teachers ST teachersTotal Male Female No res Male Female No res Male Female Male Female1009 0 6 13 0 173 75 122 259000001766708831095510Male Female39.6 27.118.2 10.65.3 1.80.0 0.00 0 1 0 1 0 0.0 0.0% Schools recvd. Incentives : Number of beneficiaries(Previous year)(Previous academic year)School T L Mdev. grant grant Incentive Primary Upper primary59.4 68.2 Type Boys Girls Boys Girls63.1 67.9 Text books 20359 17906 12137 1029530.2 23.3 Uniform 515 391 25 300.0 0.0 Attendance 149 92 136 1500.0 0.0 Stationery 51 57 4 0# = not applicable na = not available * Some totals may not match due to no response in classificatory data items225097.7 48.797.8 49.485.0 22.386.1 24.0%Teachers recvd.in-service training
KUPWARADistrictData reported fromNumber of blocks/taluksBasic Data, 2001Total population (in 000's)Decadal growth rateDISTRICT ELEMENTARY EDUCATION REPORT CARD : 2005-06State13 Number of Clusters 104 Number of villages387 Number of schools1422650 % 0 - 6 population 17.3 % Urban population 3.9 Sex ratio 906 Sex ratio 0-6102138.6 % SC population na % ST population8.0 Overall literacy 43.2 Female literacy 28.7Primary cycle 1 - 5 U. primary cycle 6 - 8Key data: Elementary EducationSchool categoryTotal schools* Rural schools* Total enrolment* Rural enrolment* Teachers*Govt. Private Govt. Private Govt. Private Govt Private Govt. PrivatePrimary only875 68 852 63 28,457 4,638 28,016 4,375 2,000 329Primary with upper primary313 68 307 65 38,075 12,597 37,272 12,113 1,979 540Primary with upper primary & sec/higher sec.3 11 3 5 563 2,454 563 959 18 101Upper primary only4 0 3 0 716 0 642 0 21 0Upper primary with sec./higher secondary49 0 49 0 6,042 0 6,042 0 276 0No response in school category31 0 0 0 0 0 0 0 0 0Performance indicatorsSchool categoryEnrolment*P. only P + UP P+sec/hs U.P. only UP+sec Grade 2001-02 2002-03 2003-04 2004-05 2005-06% Single classroom schools13.9 0.8 0.0 25.0 0.0 I13,604 15,210% Single teacher schools7.2 0.0 0.0 0.0 0.0 II13,411 12,952% Schools with SCR > 600.2 5.0 7.1 50.0 2.0 III11,715 13,577% Schools with pre-primary sections 88.7 92.4 85.7 0.0 0.0 IV10,825 11,945% Schools with common toilets 9.4 35.7 71.4 0.0 51.0 V10,360 11,305% Schools with girls toilets 2.3 11.5 64.3 0.0 16.3 VI9,617 9,956% Schools with drinking water facility 39.2 57.2 92.9 0.0 57.1 VII8,540 9,374% Schools with blackboard83.2 92.4 92.9 75.0 77.6 VIII 8,827 9,223% Enrolment in Govt. schools 86.0 75.1 18.7 100.0 100.0 Total Pr. 59,915 64,989% Enrolment in single-teacher schools4.9 0.0 0.0 0.0 0.0 Total U.P26,984 28,553% No female teacher schools (tch>=2) 52.4 39.4 50.0 25.0 69.4 Transition rateGER / NER95.2% Enrolment in schools without building 0.3 0.0 0.0 0.0 0.0 Prim. to U. Prim2003-04 2004-05 2005-06%Enrolment in schools without blackboard 12.4 7.7 7.4 22.8 18.9 Primary Level GER (Primary)62.8 92.1SC/ST EnrolmentPrimary UpperOBC EnrolmentNER (Primary)50.3 71.4Retention rateprimaryPrimary U. PrimaryGER(U.Prim)45.6 60.3% SC enrolment0.254 0.088 % OBCGPI0.86 NER(U.Prim)32.5 46.09.2 7.7% SC girls to SC enrolment 47.9 36.0 EnrolmentFlow ratesEnrolment of children% ST enrolment7.7 5.9 % OBC girls toAll With disability46.5 38.4% ST girls to ST enrolment 39.6 28.4 OBC EnrolmentGrade R.R. D.O.R. P.R. Grade Girls Boys GirlsIndicatorsSchool categoryI 0.3 5.0 94.7 I 7,107 268 119P. only P + UP P+sec/hs U.P. only UP+sec II 0.5II 6,074 244 153% Girls47.0 44.8 40.5 45.5 43.8 III 0.5III 6,288 255 181Pupil-teacher ratio (PTR)14 20 25 34 22 IV 0.4IV 5,422 203 127Student-classroom ratio (SCR)13 26 31 55 18 V 1.4 3.4 95.2 V 5,093 167 102% Schools with 1000.0 0.0 0.0 0.0 0.0 VI 1.0 2.2 96.8 VII 4,091 121 80% Female teachers22.9 19.2 11.8 23.8 8.7 VII 0.7VIII 3,909 102 56% Schools established since 199558.0 10.0 21.4 100.0 4.1 VIII 3.9 # # Total 42,442 1,486 929Classrooms/Other roomsClassroomsNo. of schools by type of building*School categoryTotal % good % minor % major OtherPartiallyMultiple NoPuccaKuccha Tentclassrooms condition repairs repairs roomsPuccaType BuildingPrimary only2,468 32.8 50.8 16.5 213 674 183 38 3 9 36Primary with upper primary1,913 30.6 49.6 19.8 323 231 90 10 0 33 17Primary with U.P. & sec/higher97 60.8 34.0 5.2811 1 0 0 1 1Upper primary only13 30.8 69.2 0.012 1 1 0 0 0Upper primary with sec./higher sec 344 37.8 45.6 16.6 11540 3 0 0 6 0Position of teachers by educational qualification (other than para teacher)Examination resultsSchool category BelowHigherPost(Previous academic year)M. Phil.secondarysecondarygraduateNoresponse Terminal % % Passed64 235 760 1,011 148 1 1 92 grade Passed with >60%V boysPrimary onlyPrimary with upper primaryPrimary with Upper primary & sec/higher34 251 728 1,136 217 2 5 13895.2 43.40 15 33 62 9 0 0 0 V girls 95.7 40.4Upper primary only0 1 6 7 5 0 0 0 VIII boys 87.5 34.8Upper primary with sec./higher secondary4 19 16 158 56 1 2 20 VIII girls 86.0 33.6Para-teachers2 3 8 9 4 0 0 0%Teachers recvd.Gender and caste distribution of teachers*Regular teachers Para-teachers SC teachers ST teachers in-service trainingSchool categoryAvg. No. of Tchs. Total Male Female No res Male Female No res Male Female Male Female Male FemalePrimary only2.5 2329 1782 530 0 14 3 0 19 1 73 13 57.2 62.7Primary with upper prim.6.6 2519 2030 481 0 6 2 0 13 5 50 15 53.0 61.3Prim.with U.P.&Sec/H.S8.5 119 105 14 0 0 0 0 0 0 1 0 8.6 28.6Upper Primary only5.3 21 15 4 0 1 1 0 0 0 0 0 93.8 100.0U. Primary with Sec./H.S.5.6 276 252 24 0 0 0 0 1 0 5 4 69.4 70.8Enrolment by medium of instructions% Total Primary Upper Primary % Schools recvd. Incentives : Number of beneficiaries(Previous year)Grossness 22.5 23.7(Previous academic year)School T L MCategory English Others Urdudev. grant grantPrimary Upper primary32958Boys Girls Boys GirlsP. onlyP + UPP+sec/hsU.P. onlyUP+sec4990930177166042996120003827000JAMMU & KASHMIRElementary Education: Report Card - KUPWARA39.750.17.125.00.061.462.514.3100.030.6IncentiveTypeText booksUniformAttendanceStationery# = not applicable na = not available * Some totals may not match due to no response in classificatory data items240555803792922027149524434092341157211778087152108195<strong>Jammu</strong> & <strong>Kashmir</strong>
<strong>Jammu</strong> & <strong>Kashmir</strong>196Elementary Education in India - Where do we stand ?LEH (LADAKH)DistrictData reported fromNumber of blocks/taluksBasic Data, 2001Total population (in 000's)Decadal growth ratePara-teachersGender and caste distribution of teachers*School categoryAvg. No. of Tchs.Primary only2.7Primary with upper prim.8.4Prim.with U.P.&Sec/H.S11.3Upper Primary only0.0U. Primary with Sec./H.S.10.3Enrolment by medium of instructionsDISTRICT ELEMENTARY EDUCATION REPORT CARD : 2005-06State6 Number of Clusters 48 Number of villages100 Number of schools330117 % 0 - 6 population 10.9 % Urban population 24.4 Sex ratio 823 Sex ratio 0-695530.4 % SC population 0.5 % ST population82.0 Overall literacy 65.3 Female literacy 52.7Primary cycle 1 - 5 U. primary cycle 6 - 8Key data: Elementary EducationSchool categoryTotal schools* Rural schools* Total enrolment* Rural enrolment* Teachers*Govt. Private Govt. Private Govt. Private Govt Private Govt. PrivatePrimary only218 11 214 9 2,955 509 2,858 475 578 45Primary with upper primary53 12 50 11 3,200 1,530 2,651 1,042 444 100Primary with upper primary & sec/higher sec.28 5 28 2 2,672 2,470 2,672 431 305 69Upper primary only0 0 0 0 0 0 0 0 0 0Upper primary with sec./higher secondary3 0 2 0 445 0 213 0 31 0No response in school category0 0 0 0 0 0 0 0 0 0Performance indicatorsSchool categoryEnrolment*P. only P + UP P+sec/hs U.P. only UP+sec Grade 2001-02 2002-03 2003-04 2004-05 2005-06% Single classroom schools9.6 0.0 0.0 0.0 0.0 I2,027% Single teacher schools7.0 0.0 0.0 0.0 0.0 II1,766% Schools with SCR > 600.0 0.0 0.0 0.0 0.0 III1,812% Schools with pre-primary sections 67.7 75.4 69.7 0.0 0.0 IV1,688% Schools with common toilets 63.3 72.3 78.8 0.0 100.0 V1,686% Schools with girls toilets 31.0 55.4 60.6 0.0 100.0 VI1,608% Schools with drinking water facility 52.0 75.4 87.9 0.0 100.0 VII1,440% Schools with blackboard91.3 96.9 97.0 0.0 100.0 VIII 1,754% Enrolment in Govt. schools 85.3 67.7 52.0 0.0 100.0 Total Pr. 8,979% Enrolment in single-teacher schools4.5 0.0 0.0 0.0 0.0 Total U.P4,802% No female teacher schools (tch>=2) 14.4 3.1 3.0 0.0 33.3 Transition rateGER / NER% Enrolment in schools without building 2.0 0.0 0.0 0.0 0.0 Prim. to U. Prim2003-04 2004-05 2005-06%Enrolment in schools without blackboard 14.5 12.0 0.9 0.0 0.0 Primary Level GER (Primary)70.6SC/ST EnrolmentPrimary UpperOBC EnrolmentNER (Primary)54.8Retention rateprimaryPrimary U. PrimaryGER(U.Prim)56.2% SC enrolment0.947 0.000 % OBCGPI1.02 NER(U.Prim)36.60.089 0.021% SC girls to SC enrolment 60.0 0.0 EnrolmentFlow ratesEnrolment of children% ST enrolment88.3 87.0 % OBC girls toAll With disability25.0 0.0% ST girls to ST enrolment 51.0 51.7 OBC EnrolmentGrade R.R. D.O.R. P.R. Grade Girls Boys GirlsIndicatorsSchool categoryII 989 22 12P. only P + UP P+sec/hs U.P. only UP+sec IIII 860 16 5% Girls52.0 51.9 49.0 0.0 49.0 IIIIII 937 5 15Pupil-teacher ratio (PTR)6 9 14 0 14 IVIV 864 5 9Student-classroom ratio (SCR)6 11 13 0 9 VV 893 17 14% Schools with 1000.0 0.0 0.0 0.0 0.0 VIVII 801 6 16% Female teachers61.6 65.3 51.9 0.0 16.1 VIIVIII 909 3 8% Schools established since 199528.4 21.5 6.1 0.0 0.0 VIII# # Total 6,997 86 99Classrooms/Other roomsClassroomsNo. of schools by type of building*School categoryTotal % good % minor % major OtherPartiallyMultiple NoPuccaKuccha Tentclassrooms condition repairs repairs roomsPuccaType BuildingPrimary only590 35.9 49.7 14.4 333 39 97 72 2 5 14Primary with upper primary441 45.6 44.9 9.5 21916 30 14 0 5 0Primary with U.P. & sec/higher395 48.6 44.1 7.3 17712 13 0 0 8 0Upper primary only0 0.0 0.0 0.000 0 0 0 0 0Upper primary with sec./higher sec49 53.1 0.0 46.9 111 1 0 0 1 0Position of teachers by educational qualification (other than para teacher)Examination resultsSchool category BelowHigherPost(Previous academic year)M. Phil.secondarysecondarygraduateNoresponse Terminal % % Passed67 241 156 131 18 2 0 0 grade Passed with >60%V boysPrimary onlyPrimary with upper primaryPrimary with Upper primary & sec/higherUpper primary onlyUpper primary with sec./higher secondaryCategoryP. onlyP + UPP+sec/hsU.P. onlyUP+secEnglish3456473051420445Others80000JAMMU & KASHMIR33 164 117 181 43 1 0 089.5 21.621 95 43 168 43 1 1 0 V girls 87.6 23.30 0 0 0 0 0 0 0 VIII boys 78.6 22.50 3 1 27 0 0 0 0 VIII girls 85.5 23.91 1 9 4 0 0 0 0%Teachers recvd.Regular teachers Para-teachers SC teachers ST teachers in-service trainingTotal Male Female No res Male Female No res Male Female Male Female Male Female623 236 379 0 3 5 0 0 2 213 363 38.9 38.5544 189 350 0 0 5 0 0 0 147 313 28.6 17.5374 179 193 0 1 1 0 3 2 109 165 21.1 28.40 0 0 0 0 0 0 0 0 0 0 0.0 0.031 26 5 0 0 0 0 1 0 16 5 3.8 0.0% Total Primary Upper Primary % Schools recvd. Incentives : Number of beneficiaries(Previous year)Grossness 22.3 35.0(Previous academic year)School T L Mdev. grant grantPrimary Upper primaryBoys Girls Boys Girls43.240.060.60.033.338.043.160.60.00.0IncentiveTypeText booksUniformAttendanceStationery# = not applicable na = not available * Some totals may not match due to no response in classificatory data items211437122118246340937110113918010381305149631
PULWAMADistrictData reported fromNumber of blocks/taluksBasic Data, 2001Total population (in 000's)Decadal growth rateDISTRICT ELEMENTARY EDUCATION REPORT CARD : 2005-06State12 Number of Clusters 97 Number of villages615 Number of schools1211653 % 0 - 6 population 13.0 % Urban population 10.5 Sex ratio 945 Sex ratio 0-6103324.5 % SC population na % ST population3.3 Overall literacy 49.6 Female literacy 32.3Primary cycle 1 - 5 U. primary cycle 6 - 8Key data: Elementary EducationSchool categoryTotal schools* Rural schools* Total enrolment* Rural enrolment* Teachers*Govt. Private Govt. Private Govt. Private Govt Private Govt. PrivatePrimary only660 54 624 48 25,620 3,584 24,882 3,079 1,612 313Primary with upper primary254 127 239 114 31,289 22,825 29,692 20,262 1,765 1,189Primary with upper primary & sec/higher sec.46 45 43 32 8,871 13,155 7,921 7,483 439 462Upper primary only6 0 5 0 768 0 719 0 34 0Upper primary with sec./higher secondary19 0 19 0 1,969 0 1,969 0 162 0No response in school category0 0 0 0 0 0 0 0 0 0Performance indicatorsSchool categoryEnrolment*P. only P + UP P+sec/hs U.P. only UP+sec Grade 2001-02 2002-03 2003-04 2004-05 2005-06% Single classroom schools5.7 0.5 0.0 0.0 0.0 I18,487 15,413% Single teacher schools6.7 0.0 0.0 0.0 0.0 II15,880 14,199% Schools with SCR > 600.4 3.7 1.1 0.0 0.0 III14,915 15,249% Schools with pre-primary sections 93.3 93.7 79.1 0.0 0.0 IV13,888 13,981% Schools with common toilets 12.0 44.9 69.2 50.0 63.2 V13,178 13,231% Schools with girls toilets 3.6 24.4 51.6 16.7 47.4 VI12,194 11,918% Schools with drinking water facility 49.0 70.1 85.7 100.0 73.7 VII11,677 11,922% Schools with blackboard89.4 89.8 81.3 100.0 84.2 VIII 10,832 12,168% Enrolment in Govt. schools 87.7 57.8 40.3 100.0 100.0 Total Pr. 76,348 72,073% Enrolment in single-teacher schools4.5 0.0 0.0 0.0 0.0 Total U.P34,703 36,008% No female teacher schools (tch>=2) 45.1 32.8 38.5 16.7 42.1 Transition rateGER / NER88.1% Enrolment in schools without building 5.1 2.9 0.0 12.8 13.3 Prim. to U. Prim2003-04 2004-05 2005-06%Enrolment in schools without blackboard 10.8 8.8 16.2 0.0 23.6 Primary Level GER (Primary)83.1 101.8SC/ST EnrolmentPrimary UpperOBC EnrolmentNER (Primary)65.8 79.3Retention rateprimaryPrimary U. PrimaryGER(U.Prim)60.9 75.7% SC enrolment0.000 0.000 % OBCGPI0.93 NER(U.Prim)45.2 54.67.7 6.2% SC girls to SC enrolment 0.0 0.0 EnrolmentFlow ratesEnrolment of children% ST enrolment5.2 2.4 % OBC girls toAll With disability47.5 46.4% ST girls to ST enrolment 40.2 33.5 OBC EnrolmentGrade R.R. D.O.R. P.R. Grade Girls Boys GirlsIndicatorsSchool categoryI 0.6 24.0 75.4 I 7,423 204 146P. only P + UP P+sec/hs U.P. only UP+sec II 1.7 4.2 94.2 II 6,796 188 129% Girls53.0 48.2 43.0 45.8 52.7 III 2.0 5.6 92.4 III 7,359 164 112Pupil-teacher ratio (PTR)15 18 24 23 12 IV 1.4 5.4 93.2 IV 6,815 166 87Student-classroom ratio (SCR)16 22 18 31 15 V 2.2 9.8 88.1 V 6,364 159 113% Schools with 1000.1 0.0 0.0 0.0 0.0 VI 2.6 1.4 96.1 VII 5,887 87 65% Female teachers29.9 24.6 23.0 26.5 15.4 VII 1.8VIII 5,939 80 51% Schools established since 199540.6 8.7 12.1 16.7 10.5 VIII 4.5 # # Total 52,399 1,149 758Classrooms/Other roomsClassroomsNo. of schools by type of building*School categoryTotal % good % minor % major OtherPartiallyMultiple NoPuccaKuccha Tentclassrooms condition repairs repairs roomsPuccaType BuildingPrimary only1,847 34.9 46.8 18.3 203 441 136 44 0 6 87Primary with upper primary2,446 49.6 36.3 14.1 415 275 62 7 0 12 24Primary with U.P. & sec/higher1,195 75.1 18.7 6.3 22076 4 1 0 4 5Upper primary only25 24.0 52.0 24.054 1 0 0 0 1Upper primary with sec./higher sec 129 36.4 29.5 34.1 4012 4 0 0 2 1Position of teachers by educational qualification (other than para teacher)Examination resultsSchool category BelowHigherPost(Previous academic year)M. Phil.secondarysecondarygraduateNoresponse Terminal % % Passed25 215 365 949 342 4 0 25 grade Passed with >60%V boysPrimary onlyPrimary with upper primaryPrimary with Upper primary & sec/higher46 256 590 1,533 508 8 2 1192.7 49.12 41 98 550 196 1 1 12 V girls 96.4 46.6Upper primary only1 4 5 15 8 0 0 1 VIII boys 90.0 41.7Upper primary with sec./higher secondary1 6 7 90 58 0 0 0 VIII girls 86.1 40.2Para-teachers0 0 0 0 0 0 0 0%Teachers recvd.Gender and caste distribution of teachers*Regular teachers Para-teachers SC teachers ST teachers in-service trainingSchool categoryAvg. No. of Tchs. Total Male Female No res Male Female No res Male Female Male Female Male FemalePrimary only2.7 1925 1349 576 0 0 0 0 0 0 33 5 68.8 63.7Primary with upper prim.7.8 2954 2227 727 0 0 0 0 0 0 23 3 44.7 49.2Prim.with U.P.&Sec/H.S9.9 901 694 207 0 0 0 0 0 0 20 0 26.7 17.4Upper Primary only5.7 34 25 9 0 0 0 0 0 0 3 0 80.0 77.8U. Primary with Sec./H.S.8.5 162 137 25 0 0 0 0 0 0 0 0 65.7 60.0Enrolment by medium of instructions% Total Primary Upper Primary % Schools recvd. Incentives : Number of beneficiaries(Previous year)Grossness 22.1 27.9(Previous academic year)School T L MCategory English Urdu Others Marathi <strong>Kashmir</strong>i dev. grant grantPrimary Upper primary23125Boys Girls Boys GirlsP. onlyP + UPP+sec/hsU.P. onlyUP+sec458491946176814915839820718710478875846700JAMMU & KASHMIR0016500Elementary Education: Report Card - PULWAMA31000056.742.58.833.310.585.961.428.683.373.7IncentiveTypeText booksUniformAttendanceStationery# = not applicable na = not available * Some totals may not match due to no response in classificatory data items20030154153482209761282244738954115337797988169109197<strong>Jammu</strong> & <strong>Kashmir</strong>
<strong>Jammu</strong> & <strong>Kashmir</strong>198Elementary Education in India - Where do we stand ?PUNCHDistrictData reported fromNumber of blocks/taluksBasic Data, 2001Total population (in 000's)Decadal growth rateDISTRICT ELEMENTARY EDUCATION REPORT CARD : 2005-06State11 Number of Clusters 87 Number of villages187 Number of schools1070373 % 0 - 6 population 18.0 % Urban population 6.4 Sex ratio 919 Sex ratio 0-695928.1 % SC population 0.3 % ST population40.0 Overall literacy 51.2 Female literacy 36.0Primary cycle 1 - 5 U. primary cycle 6 - 8Key data: Elementary EducationSchool categoryTotal schools* Rural schools* Total enrolment* Rural enrolment* Teachers*Govt. Private Govt. Private Govt. Private Govt Private Govt. PrivatePrimary only646 41 622 37 23,893 1,782 23,413 1,577 1,631 142Primary with upper primary249 48 239 42 25,998 6,261 25,411 5,727 1,563 191Primary with upper primary & sec/higher sec.42 15 42 7 6,162 5,195 6,162 2,216 306 82Upper primary only2 1 1 1 249 104 120 104 17 14Upper primary with sec./higher secondary7 0 7 0 883 0 883 0 38 0No response in school category19 0 0 0 0 0 0 0 0 0Performance indicatorsSchool categoryEnrolment*P. only P + UP P+sec/hs U.P. only UP+sec Grade 2001-02 2002-03 2003-04 2004-05 2005-06% Single classroom schools28.8 13.1 0.0 0.0 0.0 I13,696 10,974% Single teacher schools6.3 0.7 0.0 0.0 0.0 II11,524 10,432% Schools with SCR > 603.8 11.8 5.3 0.0 0.0 III10,197 10,561% Schools with pre-primary sections 47.7 42.4 42.1 0.0 0.0 IV8,551 9,592% Schools with common toilets 6.0 25.9 38.6 33.3 42.9 V7,726 8,401% Schools with girls toilets 1.5 9.8 24.6 33.3 14.3 VI6,507 7,304% Schools with drinking water facility 50.5 55.9 61.4 33.3 71.4 VII6,012 6,593% Schools with blackboard82.5 93.3 93.0 100.0 100.0 VIII 5,847 6,670% Enrolment in Govt. schools 93.1 80.6 54.3 70.5 100.0 Total Pr. 51,694 49,960% Enrolment in single-teacher schools5.8 0.2 0.0 0.0 0.0 Total U.P18,366 20,567% No female teacher schools (tch>=2) 39.2 22.9 38.6 0.0 28.6 Transition rateGER / NER92.7% Enrolment in schools without building 8.9 1.6 0.0 0.0 0.0 Prim. to U. Prim2003-04 2004-05 2005-06%Enrolment in schools without blackboard 15.7 6.2 5.1 0.0 0.0 Primary Level GER (Primary)97.5 123.6SC/ST EnrolmentPrimary UpperOBC EnrolmentNER (Primary)72.4 96.5Retention rateprimaryPrimary U. PrimaryGER(U.Prim)55.9 75.8% SC enrolment0.224 0.190 % OBCGPI0.85 NER(U.Prim)38.2 52.19.5 10.6% SC girls to SC enrolment 37.5 35.9 EnrolmentFlow ratesEnrolment of children% ST enrolment47.0 38.9 % OBC girls toAll With disability44.5 42.1% ST girls to ST enrolment 46.2 36.4 OBC EnrolmentGrade R.R. D.O.R. P.R. Grade Girls Boys GirlsIndicatorsSchool categoryI 2.2 22.9 74.9 I 5,182 76 37P. only P + UP P+sec/hs U.P. only UP+sec II 1.5 7.9 90.7 II 4,905 81 30% Girls47.5 42.7 41.5 18.1 24.0 III 1.1 5.5 93.4 III 4,887 77 50Pupil-teacher ratio (PTR)14 18 29 11 23 IV 0.9 2.4 96.7 IV 4,270 93 36Student-classroom ratio (SCR)22 29 24 14 21 V 1.7 5.6 92.7 V 3,654 71 30% Schools with 1000.0 0.3 7.0 0.0 0.0 VI 2.1VII 2,635 39 15% Female teachers34.3 36.5 28.1 48.4 26.3 VII 2.0VIII 2,416 30 11% Schools established since 199531.9 10.4 5.3 0.0 0.0 VIII 5.4 # # Total 30,964 518 228Classrooms/Other roomsClassroomsNo. of schools by type of building*School categoryTotal % good % minor % major OtherPartiallyMultiple NoPuccaKuccha Tentclassrooms condition repairs repairs roomsPuccaType BuildingPrimary only1,168 52.7 29.0 18.3 233 245 212 98 0 36 96Primary with upper primary1,108 48.5 29.9 21.7 291 106 106 9 0 65 11Primary with U.P. & sec/higher465 71.2 14.4 14.4 17624 19 0 0 14 0Upper primary only25 68.0 20.0 12.030 1 0 0 1 1Upper primary with sec./higher sec43 25.6 32.6 41.9 241 1 0 0 5 0Position of teachers by educational qualification (other than para teacher)Examination resultsSchool category BelowHigherPost(Previous academic year)M. Phil.secondarysecondarygraduateNoresponse Terminal % % Passed30 215 432 644 415 4 2 30 grade Passed with >60%V boysPrimary onlyPrimary with upper primaryPrimary with Upper primary & sec/higher24 208 430 617 447 1 2 1498.6 43.110 46 72 139 116 2 1 2 V girls 97.6 39.7Upper primary only2 2 3 7 17 0 0 0 VIII boys 89.5 31.1Upper primary with sec./higher secondary0 4 8 10 14 2 0 0 VIII girls 92.2 32.6Para-teachers0 0 2 7 3 0 0 0%Teachers recvd.Gender and caste distribution of teachers*Regular teachers Para-teachers SC teachers ST teachers in-service trainingSchool categoryAvg. No. of Tchs. Total Male Female No res Male Female No res Male Female Male Female Male FemalePrimary only2.6 1773 1165 607 0 0 1 0 10 12 365 111 70.7 66.1Primary with upper prim.5.9 1754 1105 638 0 8 3 0 7 20 240 76 50.5 47.9Prim.with U.P.&Sec/H.S6.8 388 279 109 0 0 0 0 4 0 64 12 20.1 14.7Upper Primary only10.3 31 16 15 0 0 0 0 0 0 2 0 31.3 73.3U. Primary with Sec./H.S.5.4 38 28 10 0 0 0 0 0 0 2 1 10.7 0.0Enrolment by medium of instructions% Total Primary Upper Primary % Schools recvd. Incentives : Number of beneficiaries(Previous year)Grossness 22.0 31.2(Previous academic year)School T L MCategory Urdu English Hindi Others Gujarati dev. grant grantPrimary Upper primary16780Boys Girls Boys GirlsP. onlyP + UPP+sec/hsU.P. onlyUP+sec229308687249883861489232217104011830334300JAMMU & KASHMIR155541100084900035.836.75.30.00.054.746.817.533.328.6IncentiveTypeText booksUniformAttendanceStationery# = not applicable na = not available * Some totals may not match due to no response in classificatory data items2100520267442431896022760041768494852122102570746134957
RAJAURIDistrictData reported fromNumber of blocks/taluksBasic Data, 2001Total population (in 000's)Decadal growth rateDISTRICT ELEMENTARY EDUCATION REPORT CARD : 2005-06StateJAMMU & KASHMIR15 Number of Clusters 121 Number of villages379 Number of schools1373483 % 0 - 6 population 16.4 % Urban population 7.0 Sex ratio 878 Sex ratio 0-690525.2 % SC population 8.0 % ST population33.1 Overall literacy 58.0 Female literacy 44.5Primary cycle 1 - 5 U. primary cycle 6 - 8Key data: Elementary EducationSchool categoryTotal schools* Rural schools* Total enrolment* Rural enrolment* Teachers*Govt. Private Govt. Private Govt. Private Govt Private Govt. PrivatePrimary only749 56 735 47 26,925 3,055 26,541 2,480 1,848 211Primary with upper primary347 79 332 63 33,752 11,202 32,025 8,930 2,050 480Primary with upper primary & sec/higher sec.92 36 88 24 13,766 10,612 12,783 5,930 585 260Upper primary only1 0 1 0 64 0 64 0 4 0Upper primary with sec./higher secondary7 1 7 1 961 54 961 54 35 3No response in school category5 0 0 0 0 0 0 0 0 0Performance indicatorsSchool categoryEnrolment*P. only P + UP P+sec/hs U.P. only UP+sec Grade 2001-02 2002-03 2003-04 2004-05 2005-06% Single classroom schools20.1 6.8 0.8 0.0 0.0 I18,108 16,467% Single teacher schools9.6 1.4 0.0 0.0 0.0 II14,657 14,782% Schools with SCR > 602.7 9.4 1.6 0.0 0.0 III12,351 13,553% Schools with pre-primary sections 58.9 56.8 48.4 0.0 0.0 IV11,213 12,360% Schools with common toilets 7.0 31.5 68.0 0.0 50.0 V11,225 11,718% Schools with girls toilets 4.0 19.7 52.3 0.0 12.5 VI9,634 11,241% Schools with drinking water facility 89.4 87.8 91.4 100.0 100.0 VII8,807 9,824% Schools with blackboard83.5 96.0 95.3 100.0 100.0 VIII 9,466 10,446% Enrolment in Govt. schools 89.8 75.1 56.5 100.0 94.7 Total Pr. 67,554 68,880% Enrolment in single-teacher schools8.1 0.8 0.0 0.0 0.0 Total U.P27,907 31,511% No female teacher schools (tch>=2) 33.2 18.5 23.4 0.0 50.0 Transition rateGER / NER98.0% Enrolment in schools without building 13.7 1.0 0.0 0.0 0.0 Prim. to U. Prim2003-04 2004-05 2005-06%Enrolment in schools without blackboard 13.9 3.2 4.4 0.0 0.0 Primary Level GER (Primary)99.1 131.4SC/ST EnrolmentPrimary UpperOBC EnrolmentNER (Primary)74.5 100.0Retention rateprimaryPrimary U. PrimaryGER(U.Prim)66.0 89.5% SC enrolment7.4 9.2 % OBCGPI0.82 NER(U.Prim)47.5 65.53.2 3.9% SC girls to SC enrolment 47.2 44.2 EnrolmentFlow ratesEnrolment of children% ST enrolment43.9 33.6 % OBC girls toAll With disability48.9 46.1% ST girls to ST enrolment 45.6 35.9 OBC EnrolmentGrade R.R. D.O.R. P.R. Grade Girls Boys GirlsIndicatorsSchool categoryI 0.7 18.0 81.2 I 7,687 74 49P. only P + UP P+sec/hs U.P. only UP+sec II 0.5 7.4 92.2 II 6,793 88 53% Girls48.1 42.6 40.4 0.0 36.0 III 0.4III 6,081 90 51Pupil-teacher ratio (PTR)15 18 29 16 27 IV 0.4IV 5,475 73 38Student-classroom ratio (SCR)20 25 22 32 16 V 0.6 1.4 98.0 V 5,086 77 25% Schools with 1000.0 0.2 0.0 0.0 0.0 VI 2.6VII 4,027 42 28% Female teachers38.9 37.5 35.3 50.0 26.3 VII 2.4VIII 4,039 50 16% Schools established since 199535.5 11.0 6.3 0.0 0.0 VIII 12.7 # # Total 43,820 546 284Classrooms/Other roomsClassroomsNo. of schools by type of building*School categoryTotal % good % minor % major OtherPartiallyMultiple NoPuccaKuccha Tentclassrooms condition repairs repairs roomsPuccaType BuildingPrimary only1,464 62.4 19.7 18.0 246 544 61 38 0 28 134Primary with upper primary1,785 60.0 21.5 18.5 443 310 31 9 0 70 6Primary with U.P. & sec/higher1,105 68.4 16.4 15.2 33897 4 0 0 27 0Upper primary only2 100.0 0.0 0.001 0 0 0 0 0Upper primary with sec./higher sec64 50.0 23.4 26.6 184 0 0 0 4 0Position of teachers by educational qualification (other than para teacher)Examination resultsSchool category BelowHigherPost(Previous academic year)M. Phil.secondarysecondarygraduateNoresponse Terminal % % Passed7 344 520 772 406 10 0 0 grade Passed with >60%V boysPrimary onlyPrimary with upper primaryPrimary with Upper primary & sec/higherUpper primary onlyUpper primary with sec./higher secondaryPara-teachersGender and caste distribution of teachers*School categoryAvg. No. of Tchs.Primary only2.6 2059 1259Primary with upper prim.5.9 2530 1581 949 0 0Prim.with U.P.&Sec/H.S6.6 845 547 298 0 0Upper Primary only4.0 4 2 2 0 0U. Primary with Sec./H.S.4.8 38 28 10 0 0Enrolment by medium of instructions% Total Primary Upper PrimaryGrossness 18.7 26.8Category Urdu English Hindi Others AssameseP. only170749037386801P + UP19162187816931800P+sec/hs641014814315400U.P. only4302100UP+sec5199040600Elementary Education: Report Card - RAJAURI10 315 634 1,020 544 7 0 02 89 104 359 285 6 0 0 V girls0 0 1 1 2 0 0 0 VIII boys0 4 2 13 19 0 0 0 VIII girls0 0 0 0 0 0 0 0Regular teachers Para-teachers SC teachers ST teachersTotal Male Female No res Male Female No res Male Female Male Female800 0 0 0 0 74 47 360 9800000010152053150345860Male Female56.4 51.040.1 28.526.9 16.450.0 50.00 0 1 1 6 0 14.3 30.0% Schools recvd. Incentives : Number of beneficiaries(Previous year)(Previous academic year)School T L Mdev. grant grant Incentive Primary Upper primary39.8 72.8 Type Boys Girls Boys Girls44.4 71.6 Text books 24953 22580 11690 855210.2 51.6 Uniform 23 13 134 61100.0 100.0 Attendance 5861 5005 2146 12810.0 12.5 Stationery 25 16 134 61# = not applicable na = not available * Some totals may not match due to no response in classificatory data items639099.6 41.099.5 42.877.5 24.882.1 25.8%Teachers recvd.in-service training199<strong>Jammu</strong> & <strong>Kashmir</strong>
<strong>Jammu</strong> & <strong>Kashmir</strong>200Elementary Education in India - Where do we stand ?SRINAGARDistrictData reported fromNumber of blocks/taluksBasic Data, 2001Total population (in 000's)Decadal growth ratePara-teachersGender and caste distribution of teachers*School categoryAvg. No. of Tchs.Primary only3.3Primary with upper prim.9.6Prim.with U.P.&Sec/H.S14.3Upper Primary only0.0U. Primary with Sec./H.S.9.1Enrolment by medium of instructionsDISTRICT ELEMENTARY EDUCATION REPORT CARD : 2005-06State12 Number of Clusters 78 Number of villages219 Number of schools10811202 % 0 - 6 population 10.7 % Urban population 78.7 Sex ratio 851 Sex ratio 0-694931.5 % SC population 0.1 % ST population3.8 Overall literacy 59.8 Female literacy 30.6Primary cycle 1 - 5 U. primary cycle 6 - 8Key data: Elementary EducationSchool categoryTotal schools* Rural schools* Total enrolment* Rural enrolment* Teachers*Govt. Private Govt. Private Govt. Private Govt Private Govt. PrivatePrimary only390 61 210 18 13,568 5,907 8,226 1,608 992 503Primary with upper primary220 173 96 47 24,606 27,211 13,120 8,452 1,811 1,943Primary with upper primary & sec/higher sec.69 152 20 12 9,829 52,496 3,325 3,594 798 2,366Upper primary only0 0 0 0 0 0 0 0 0 0Upper primary with sec./higher secondary13 1 4 0 1,244 4 662 0 112 15No response in school category2 0 0 0 0 0 0 0 0 0Performance indicatorsSchool categoryEnrolment*P. only P + UP P+sec/hs U.P. only UP+sec Grade 2001-02 2002-03 2003-04 2004-05 2005-06% Single classroom schools13.3 1.3 0.0 0.0 0.0 I14,342 18,956% Single teacher schools6.2 0.0 0.0 0.0 0.0 II13,506 17,279% Schools with SCR > 600.0 2.3 0.0 0.0 7.1 III13,224 18,072% Schools with pre-primary sections 93.3 94.4 87.8 0.0 7.1 IV12,568 17,412% Schools with common toilets 38.1 67.9 71.0 0.0 64.3 V11,684 17,186% Schools with girls toilets 14.6 41.2 67.9 0.0 21.4 VI10,981 15,610% Schools with drinking water facility 67.0 83.7 91.9 0.0 100.0 VII10,313 15,186% Schools with blackboard90.5 94.4 97.3 0.0 92.9 VIII 10,011 15,164% Enrolment in Govt. schools 69.7 47.5 15.8 0.0 99.7 Total Pr. 65,324 88,905% Enrolment in single-teacher schools2.6 0.0 0.0 0.0 0.0 Total U.P31,305 45,960% No female teacher schools (tch>=2) 31.9 13.0 1.8 0.0 7.1 Transition rateGER / NER100.0% Enrolment in schools without building 0.8 0.3 0.0 0.0 0.0 Prim. to U. Prim2003-04 2004-05 2005-06%Enrolment in schools without blackboard 8.6 4.7 1.9 0.0 4.8 Primary Level GER (Primary)37.8 68.2SC/ST EnrolmentPrimary UpperOBC EnrolmentNER (Primary)31.8 57.3Retention rateprimaryPrimary U. PrimaryGER(U.Prim)29.2 52.5% SC enrolment0.000 0.000 % OBCGPI0.93 NER(U.Prim)23.8 41.24.2 3.8% SC girls to SC enrolment 0.0 0.0 EnrolmentFlow ratesEnrolment of children% ST enrolment6.9 4.6 % OBC girls toAll With disability47.4 41.7% ST girls to ST enrolment 43.2 35.4 OBC EnrolmentGrade R.R. D.O.R. P.R. Grade Girls Boys GirlsIndicatorsSchool categoryII 9,180 163 99P. only P + UP P+sec/hs U.P. only UP+sec IIII 8,345 119 85% Girls50.1 46.0 49.0 0.0 36.0 IIIIII 8,680 147 82Pupil-teacher ratio (PTR)13 14 20 0 10 IVIV 8,306 108 68Student-classroom ratio (SCR)14 17 21 0 12 VV 8,231 99 60% Schools with 1000.0 0.0 0.0 0.0 0.0 VIVII 7,264 81 73% Female teachers53.4 63.1 73.2 0.0 58.3 VIIVIII 7,262 81 53% Schools established since 199553.4 15.5 7.7 0.0 0.0 VIII# # Total 64,579 882 568Classrooms/Other roomsClassroomsNo. of schools by type of building*School categoryTotal % good % minor % major OtherPartiallyMultiple NoPuccaKuccha Tentclassrooms condition repairs repairs roomsPuccaType BuildingPrimary only1,417 57.7 25.9 16.4 212 372 55 16 0 0 8Primary with upper primary2,987 60.0 27.3 12.7 664 334 32 11 0 12 4Primary with U.P. & sec/higher2,951 78.2 17.5 4.3 1,004 204 9 1 0 6 0Upper primary only0 0.0 0.0 0.000 0 0 0 0 0Upper primary with sec./higher sec 103 38.8 43.7 17.5 5513 0 1 0 0 0Position of teachers by educational qualification (other than para teacher)Examination resultsSchool category BelowHigherPost(Previous academic year)M. Phil.secondarysecondarygraduateNoresponse Terminal % % Passed15 204 504 586 177 6 3 0 grade Passed with >60%V boysPrimary onlyPrimary with upper primaryPrimary with Upper primary & sec/higherUpper primary onlyUpper primary with sec./higher secondaryCategoryP. onlyP + UPP+sec/hsU.P. onlyUP+secEnglish19470518176209101227Others50234021JAMMU & KASHMIR52 641 950 1,666 416 10 16 097.8 57.218 180 300 1,945 684 12 20 0 V girls 98.2 58.60 0 0 0 0 0 0 0 VIII boys 92.0 56.50 14 5 51 55 1 1 0 VIII girls 92.3 57.90 0 0 5 2 0 1 0%Teachers recvd.Regular teachers Para-teachers SC teachers ST teachers in-service trainingTotal Male Female No res Male Female No res Male Female Male Female Male Female1495 697 798 0 0 0 0 0 0 41 6 58.5 34.83754 1385 2366 0 1 2 0 0 0 60 10 38.0 27.03164 844 2315 0 3 2 0 0 0 10 4 13.6 10.80 0 0 0 0 0 0 0 0 0 0 0.0 0.0127 53 74 0 0 0 0 0 0 1 0 37.7 18.9% Total Primary Upper Primary % Schools recvd. Incentives : Number of beneficiaries(Previous year)Grossness 15.9 21.5(Previous academic year)School T L Mdev. grant grantPrimary Upper primaryBoys Girls Boys Girls32.226.03.20.00.080.954.525.80.057.1IncentiveTypeText booksUniformAttendanceStationery# = not applicable na = not available * Some totals may not match due to no response in classificatory data items156508293437921579480222966478495151293687102577117483
UDHAMPURDistrictData reported fromNumber of blocks/taluksBasic Data, 2001Total population (in 000's)Decadal growth rateDISTRICT ELEMENTARY EDUCATION REPORT CARD : 2005-06StateJAMMU & KASHMIR18 Number of Clusters 142 Number of villages579 Number of schools1814744 % 0 - 6 population 16.3 % Urban population 15.7 Sex ratio 860 Sex ratio 0-693127.0 % SC population 19.1 % ST population14.8 Overall literacy 55.2 Female literacy 41.2Primary cycle 1 - 5 U. primary cycle 6 - 8Key data: Elementary EducationSchool categoryTotal schools* Rural schools* Total enrolment* Rural enrolment* Teachers*Govt. Private Govt. Private Govt. Private Govt Private Govt. PrivatePrimary only1,047 71 1,025 63 34,297 3,831 33,612 3,194 2,337 381Primary with upper primary420 82 407 65 43,976 11,471 41,517 9,092 2,407 710Primary with upper primary & sec/higher sec.126 54 120 27 26,442 14,968 25,294 6,203 1,036 658Upper primary only1 0 1 0 155 0 155 0 10 0Upper primary with sec./higher secondary1 0 0 0 80 0 0 0 14 0No response in school category12 0 0 0 0 0 0 0 0 0Performance indicatorsSchool categoryEnrolment*P. only P + UP P+sec/hs U.P. only UP+sec Grade 2001-02 2002-03 2003-04 2004-05 2005-06% Single classroom schools49.9 9.6 1.1 0.0 0.0 I21,908 18,648% Single teacher schools12.3 1.0 0.0 0.0 0.0 II19,507 19,780% Schools with SCR > 601.3 12.2 4.4 0.0 0.0 III16,943 19,483% Schools with pre-primary sections 93.4 93.2 85.6 0.0 0.0 IV15,417 17,547% Schools with common toilets 12.5 38.6 65.0 100.0 100.0 V14,291 16,162% Schools with girls toilets 6.2 25.3 56.7 100.0 100.0 VI14,042 15,448% Schools with drinking water facility 83.5 90.6 95.0 100.0 100.0 VII11,913 14,284% Schools with blackboard82.9 93.8 95.0 100.0 100.0 VIII 11,952 13,868% Enrolment in Govt. schools 90.0 79.3 63.9 100.0 100.0 Total Pr. 88,066 91,620% Enrolment in single-teacher schools 12.6 0.4 0.0 0.0 0.0 Total U.P37,907 43,600% No female teacher schools (tch>=2) 33.1 19.7 17.8 0.0 0.0 Transition rateGER / NER100.0% Enrolment in schools without building 0.3 0.0 0.0 0.0 0.0 Prim. to U. Prim2003-04 2004-05 2005-06%Enrolment in schools without blackboard 13.0 5.8 4.5 0.0 0.0 Primary Level GER (Primary)83.5 113.6SC/ST EnrolmentPrimary UpperOBC EnrolmentNER (Primary)78.7 93.2Retention rateprimaryPrimary U. PrimaryGER(U.Prim)58.0 80.5% SC enrolment20.2 18.3 % OBCGPI0.77 NER(U.Prim)52.0 57.73.7 4.5% SC girls to SC enrolment 43.6 40.7 EnrolmentFlow ratesEnrolment of children% ST enrolment16.0 11.6 % OBC girls toAll With disability43.5 42.5% ST girls to ST enrolment 40.2 31.9 OBC EnrolmentGrade R.R. D.O.R. P.R. Grade Girls Boys GirlsIndicatorsSchool categoryI 3.8 7.5 88.7 I 8,295 128 69P. only P + UP P+sec/hs U.P. only UP+sec II 1.8II 8,799 169 78% Girls44.5 41.5 42.8 33.5 100.0 III 1.8III 8,531 151 62Pupil-teacher ratio (PTR)14 18 24 16 6 IV 1.4IV 7,406 148 42Student-classroom ratio (SCR)19 27 23 9 13 V 1.3V 6,865 111 53% Schools with 1000.3 0.0 0.6 0.0 0.0 VI 5.5VII 5,878 59 33% Female teachers39.8 44.1 47.6 40.0 64.3 VII 5.0VIII 5,649 78 36% Schools established since 199542.6 8.6 2.2 0.0 0.0 VIII 13.5 # # Total 57,822 929 413Classrooms/Other roomsClassroomsNo. of schools by type of building*School categoryTotal % good % minor % major OtherPartiallyMultiple NoPuccaKuccha Tentclassrooms condition repairs repairs roomsPuccaType BuildingPrimary only2,000 60.5 27.2 12.4 370 377 318 340 0 62 21Primary with upper primary2,030 61.1 25.2 13.6 535 206 150 19 0 127 0Primary with U.P. & sec/higher1,785 74.1 17.1 8.8 63288 28 0 0 64 0Upper primary only18 100.0 0.0 0.081 0 0 0 0 0Upper primary with sec./higher sec6 0.0 100.0 0.041 0 0 0 0 0Position of teachers by educational qualification (other than para teacher)Examination resultsSchool category BelowHigherPost(Previous academic year)M. Phil.secondarysecondarygraduateNoresponse Terminal % % Passed35 421 882 1,063 311 0 0 6 grade Passed with >60%V boysPrimary onlyPrimary with upper primaryPrimary with Upper primary & sec/higherUpper primary onlyUpper primary with sec./higher secondaryPara-teachersGender and caste distribution of teachers*School categoryAvg. No. of Tchs.Primary only2.4 2718 1635Primary with upper prim.6.2 3117 1742 1375 0 0Prim.with U.P.&Sec/H.S9.4 1694 888 806 0 0Upper Primary only10.0 10 6 4 0 0U. Primary with Sec./H.S.14.0 14 5 9 0 0Enrolment by medium of instructions% Total Primary Upper PrimaryGrossness 18.0 28.3Category Hindi Urdu English OthersP. only20591141013310100P + UP3007217294801665P+sec/hs188938280 1416770U.P. only001550UP+sec80000Elementary Education: Report Card - UDHAMPUR13 418 1,050 1,187 438 6 0 55 187 214 859 419 9 0 1 V girls0 0 1 4 5 0 0 0 VIII boys0 0 0 10 4 0 0 0 VIII girls0 0 0 0 0 0 0 0Regular teachers Para-teachers SC teachers ST teachersTotal Male Female No res Male Female No res Male Female Male Female1083 0 0 0 0 204 103 201 490000002139001194701365404211087.0 27.0%Teachers recvd.in-service trainingMale Female37.6 29.130.9 18.013.2 4.20.0 0.00 0 0 0 0 0 0.0 11.1% Schools recvd. Incentives : Number of beneficiaries(Previous year)(Previous academic year)School T L Mdev. grant grant Incentive Primary Upper primary59.6 77.2 Type Boys Girls Boys Girls69.3 81.3 Text books 41005 30793 18512 1277254.4 66.1 Uniform 1644 760 312 1500.0 0.0 Attendance 3869 2467 2847 1683100.0 100.0 Stationery 226 142 138 91# = not applicable na = not available * Some totals may not match due to no response in classificatory data items98.7 42.899.0 47.584.6 27.3201<strong>Jammu</strong> & <strong>Kashmir</strong>


