

Jammu & Kashmir - DISE
Jammu & Kashmir - DISE
Jammu & Kashmir - DISE
- No tags were found...

You also want an ePaper? Increase the reach of your titles
YUMPU automatically turns print PDFs into web optimized ePapers that Google loves.
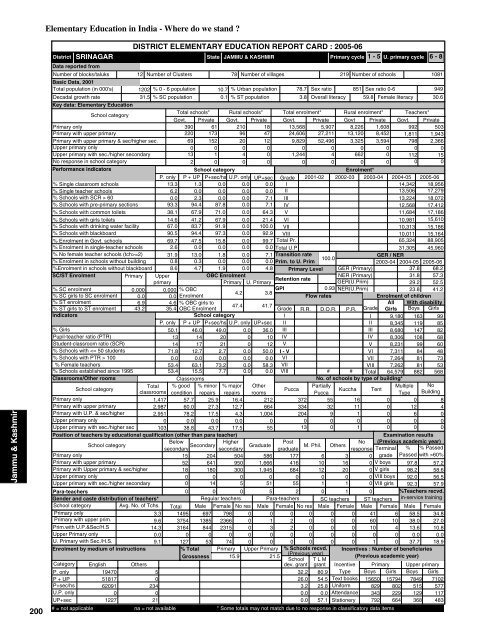
<strong>Jammu</strong> & <strong>Kashmir</strong>200Elementary Education in India - Where do we stand ?SRINAGARDistrictData reported fromNumber of blocks/taluksBasic Data, 2001Total population (in 000's)Decadal growth ratePara-teachersGender and caste distribution of teachers*School categoryAvg. No. of Tchs.Primary only3.3Primary with upper prim.9.6Prim.with U.P.&Sec/H.S14.3Upper Primary only0.0U. Primary with Sec./H.S.9.1Enrolment by medium of instructionsDISTRICT ELEMENTARY EDUCATION REPORT CARD : 2005-06State12 Number of Clusters 78 Number of villages219 Number of schools10811202 % 0 - 6 population 10.7 % Urban population 78.7 Sex ratio 851 Sex ratio 0-694931.5 % SC population 0.1 % ST population3.8 Overall literacy 59.8 Female literacy 30.6Primary cycle 1 - 5 U. primary cycle 6 - 8Key data: Elementary EducationSchool categoryTotal schools* Rural schools* Total enrolment* Rural enrolment* Teachers*Govt. Private Govt. Private Govt. Private Govt Private Govt. PrivatePrimary only390 61 210 18 13,568 5,907 8,226 1,608 992 503Primary with upper primary220 173 96 47 24,606 27,211 13,120 8,452 1,811 1,943Primary with upper primary & sec/higher sec.69 152 20 12 9,829 52,496 3,325 3,594 798 2,366Upper primary only0 0 0 0 0 0 0 0 0 0Upper primary with sec./higher secondary13 1 4 0 1,244 4 662 0 112 15No response in school category2 0 0 0 0 0 0 0 0 0Performance indicatorsSchool categoryEnrolment*P. only P + UP P+sec/hs U.P. only UP+sec Grade 2001-02 2002-03 2003-04 2004-05 2005-06% Single classroom schools13.3 1.3 0.0 0.0 0.0 I14,342 18,956% Single teacher schools6.2 0.0 0.0 0.0 0.0 II13,506 17,279% Schools with SCR > 600.0 2.3 0.0 0.0 7.1 III13,224 18,072% Schools with pre-primary sections 93.3 94.4 87.8 0.0 7.1 IV12,568 17,412% Schools with common toilets 38.1 67.9 71.0 0.0 64.3 V11,684 17,186% Schools with girls toilets 14.6 41.2 67.9 0.0 21.4 VI10,981 15,610% Schools with drinking water facility 67.0 83.7 91.9 0.0 100.0 VII10,313 15,186% Schools with blackboard90.5 94.4 97.3 0.0 92.9 VIII 10,011 15,164% Enrolment in Govt. schools 69.7 47.5 15.8 0.0 99.7 Total Pr. 65,324 88,905% Enrolment in single-teacher schools2.6 0.0 0.0 0.0 0.0 Total U.P31,305 45,960% No female teacher schools (tch>=2) 31.9 13.0 1.8 0.0 7.1 Transition rateGER / NER100.0% Enrolment in schools without building 0.8 0.3 0.0 0.0 0.0 Prim. to U. Prim2003-04 2004-05 2005-06%Enrolment in schools without blackboard 8.6 4.7 1.9 0.0 4.8 Primary Level GER (Primary)37.8 68.2SC/ST EnrolmentPrimary UpperOBC EnrolmentNER (Primary)31.8 57.3Retention rateprimaryPrimary U. PrimaryGER(U.Prim)29.2 52.5% SC enrolment0.000 0.000 % OBCGPI0.93 NER(U.Prim)23.8 41.24.2 3.8% SC girls to SC enrolment 0.0 0.0 EnrolmentFlow ratesEnrolment of children% ST enrolment6.9 4.6 % OBC girls toAll With disability47.4 41.7% ST girls to ST enrolment 43.2 35.4 OBC EnrolmentGrade R.R. D.O.R. P.R. Grade Girls Boys GirlsIndicatorsSchool categoryII 9,180 163 99P. only P + UP P+sec/hs U.P. only UP+sec IIII 8,345 119 85% Girls50.1 46.0 49.0 0.0 36.0 IIIIII 8,680 147 82Pupil-teacher ratio (PTR)13 14 20 0 10 IVIV 8,306 108 68Student-classroom ratio (SCR)14 17 21 0 12 VV 8,231 99 60% Schools with 1000.0 0.0 0.0 0.0 0.0 VIVII 7,264 81 73% Female teachers53.4 63.1 73.2 0.0 58.3 VIIVIII 7,262 81 53% Schools established since 199553.4 15.5 7.7 0.0 0.0 VIII# # Total 64,579 882 568Classrooms/Other roomsClassroomsNo. of schools by type of building*School categoryTotal % good % minor % major OtherPartiallyMultiple NoPuccaKuccha Tentclassrooms condition repairs repairs roomsPuccaType BuildingPrimary only1,417 57.7 25.9 16.4 212 372 55 16 0 0 8Primary with upper primary2,987 60.0 27.3 12.7 664 334 32 11 0 12 4Primary with U.P. & sec/higher2,951 78.2 17.5 4.3 1,004 204 9 1 0 6 0Upper primary only0 0.0 0.0 0.000 0 0 0 0 0Upper primary with sec./higher sec 103 38.8 43.7 17.5 5513 0 1 0 0 0Position of teachers by educational qualification (other than para teacher)Examination resultsSchool category BelowHigherPost(Previous academic year)M. Phil.secondarysecondarygraduateNoresponse Terminal % % Passed15 204 504 586 177 6 3 0 grade Passed with >60%V boysPrimary onlyPrimary with upper primaryPrimary with Upper primary & sec/higherUpper primary onlyUpper primary with sec./higher secondaryCategoryP. onlyP + UPP+sec/hsU.P. onlyUP+secEnglish19470518176209101227Others50234021JAMMU & KASHMIR52 641 950 1,666 416 10 16 097.8 57.218 180 300 1,945 684 12 20 0 V girls 98.2 58.60 0 0 0 0 0 0 0 VIII boys 92.0 56.50 14 5 51 55 1 1 0 VIII girls 92.3 57.90 0 0 5 2 0 1 0%Teachers recvd.Regular teachers Para-teachers SC teachers ST teachers in-service trainingTotal Male Female No res Male Female No res Male Female Male Female Male Female1495 697 798 0 0 0 0 0 0 41 6 58.5 34.83754 1385 2366 0 1 2 0 0 0 60 10 38.0 27.03164 844 2315 0 3 2 0 0 0 10 4 13.6 10.80 0 0 0 0 0 0 0 0 0 0 0.0 0.0127 53 74 0 0 0 0 0 0 1 0 37.7 18.9% Total Primary Upper Primary % Schools recvd. Incentives : Number of beneficiaries(Previous year)Grossness 15.9 21.5(Previous academic year)School T L Mdev. grant grantPrimary Upper primaryBoys Girls Boys Girls32.226.03.20.00.080.954.525.80.057.1IncentiveTypeText booksUniformAttendanceStationery# = not applicable na = not available * Some totals may not match due to no response in classificatory data items156508293437921579480222966478495151293687102577117483


