Assessment of Nutritional Status of under-five year rural children in ...
Assessment of Nutritional Status of under-five year rural children in ...
Assessment of Nutritional Status of under-five year rural children in ...

You also want an ePaper? Increase the reach of your titles
YUMPU automatically turns print PDFs into web optimized ePapers that Google loves.
<strong>Assessment</strong> <strong>of</strong> <strong>Nutritional</strong> <strong>Status</strong> <strong>of</strong><br />
<strong>under</strong>-<strong>five</strong> <strong>year</strong> <strong>rural</strong> <strong>children</strong> <strong>in</strong> the Districts <strong>of</strong><br />
Madhya Pradesh State<br />
District: MORENA<br />
Morena<br />
Bh<strong>in</strong>d<br />
Sheopur<br />
Gwalior<br />
Datia<br />
Shivpuri<br />
Neemuch<br />
Mandsaur<br />
Ratlam Ujja<strong>in</strong><br />
Jhabua<br />
Indore<br />
Dhar<br />
Alirajpur<br />
Rajgarh<br />
Shajapur<br />
Dewas<br />
Sehore<br />
Guna<br />
Harda<br />
Bhopal<br />
Ashok<br />
Nagar<br />
Vidisha<br />
Raisen<br />
Hoshangabad<br />
Tikamgarh<br />
Sagar<br />
Narsimhapur<br />
Chh<strong>in</strong>dwara<br />
Chhatarpur<br />
Panna<br />
Damoh<br />
Seoni<br />
Jabalpur<br />
Katni<br />
Mandla<br />
Satna<br />
Umaria<br />
D<strong>in</strong>dori<br />
Rewa<br />
Shahdol<br />
Sidhi<br />
Anuppur<br />
S<strong>in</strong>grauli<br />
Barwani<br />
Khargone<br />
Khandwa<br />
Betul<br />
Balaghat<br />
Burhanpur<br />
NATIONAL INSTITUTE OF NUTRITION<br />
Indian Council <strong>of</strong> Medical Research<br />
Hyderabad – 500 007<br />
2011
<strong>Assessment</strong> <strong>of</strong> <strong>Nutritional</strong> <strong>Status</strong> <strong>of</strong> <strong>under</strong><br />
Five <strong>year</strong> Rural <strong>children</strong> <strong>in</strong> the Districts <strong>of</strong><br />
Madhya Pradesh State<br />
- Morena District<br />
G.N.V.Brahmam<br />
K.Venkaiah<br />
A.Laxmaiah<br />
I.I.Meshram<br />
K.Mallikharjuna Rao<br />
Ch.Gal Reddy<br />
Sharad Kumar<br />
M.Rav<strong>in</strong>dranath<br />
K.Sreerama Krishna<br />
National Institute <strong>of</strong> Nutrition<br />
Indian Council <strong>of</strong> Medical Research<br />
Hyderabad – 500 007<br />
2011
CONTENTS<br />
Page No.<br />
ACKNOWLEDGEMENTS<br />
PROJECT STAFF<br />
RESULTS AT GLANCE<br />
EXECUTIVE SUMMARY<br />
i - iii<br />
1. INTRODUCTION 1 - 3<br />
1.1 Pr<strong>of</strong>ile <strong>of</strong> Morena District 3<br />
2. OBJECTIVES 3<br />
2.1 General Objective 3<br />
2.2 Specific objectives 4<br />
3. METHODOLOGY 4 - 6<br />
3.1 Sampl<strong>in</strong>g Design 4<br />
3.1.1 Sample size 4<br />
3.1.2 Selection <strong>of</strong> Villages 4<br />
3.1.3 Selection <strong>of</strong> Households 4<br />
3.2 Investigations 4<br />
3.2.1 Household socioeconomic and demographic Particulars 5<br />
3.2.2 Anthropometry 4<br />
3.2.3 Cl<strong>in</strong>ical exam<strong>in</strong>ation 5<br />
3.2.4 History <strong>of</strong> Morbidity 5<br />
3.2.5 Maternal Particulars 5<br />
3.2.6 Infant and Young child feed<strong>in</strong>g practices 5<br />
3.2.7 Coverage <strong>of</strong> <strong>children</strong> <strong>under</strong> various health & nutrition<br />
<strong>in</strong>tervention Programmes 6<br />
3.2.8 Spot test<strong>in</strong>g <strong>of</strong> household cook<strong>in</strong>g salt for Iod<strong>in</strong>e 6<br />
3.3 Recruitment, tra<strong>in</strong><strong>in</strong>g, standardization <strong>of</strong> field Investigators and<br />
data collection<br />
3.4 Quality Control 6<br />
3.5 Data Analysis 6<br />
4. RESULTS 6 - 16<br />
4.1 Coverage 6<br />
4.2 Household Socio-economic and Demographic particulars 7<br />
4.2.1 Community 7<br />
4.2.2 Type <strong>of</strong> family 7<br />
4.2.3 Family size 7<br />
4.2.4 Literacy status <strong>of</strong> father 7<br />
4.2.5 Literacy status <strong>of</strong> mother 7<br />
6<br />
<strong>Nutritional</strong> <strong>Status</strong> <strong>of</strong>
4.2.6 Household landhold<strong>in</strong>g 7<br />
4.2.7 Major occupation <strong>of</strong> Father 7<br />
4.2.8 Major occupation <strong>of</strong> Mother 7<br />
4.2.9 Per capita monthly <strong>in</strong>come 8<br />
4.3 Household Physical facilities 8<br />
4.3.1 Type <strong>of</strong> house 8<br />
4.3.2 Household amenities 8<br />
4.4 Iod<strong>in</strong>e content <strong>of</strong> Cook<strong>in</strong>g salt 8<br />
4.5 Maternal characteristics 8<br />
4.5.1 Age and parity <strong>of</strong> mother 8<br />
4.5.2 Particulars <strong>of</strong> last Pregnancy (mothers <strong>of</strong>
ACKNOWLEDGEMENTS<br />
We express our s<strong>in</strong>cere thanks to Mr. B.R. Naidu, I.A.S, Pr<strong>in</strong>cipal Secretary,<br />
and Smt. T<strong>in</strong>oo Joshi, I.A.S, and Dr. Loveleen Kacker, I.A.S, past Pr<strong>in</strong>cipal<br />
Secretaries, Women and Child Development & Social Justice Department,<br />
Government <strong>of</strong> Madhya Pradesh for provid<strong>in</strong>g us an opportunity to carry out this<br />
study.<br />
Our thanks are due to Ms. Kam<strong>in</strong>i Chauhan I.A.S, Deputy Secretary, Dr.<br />
Anupam Rajan, Director and Shri. Akshaya Srivatsav, Jo<strong>in</strong>t Director, Women and<br />
Child Development Department, Government <strong>of</strong> Madhya Pradesh for their support<br />
dur<strong>in</strong>g the study.<br />
We are also thanksful to Shri. Gulshan Bamra, former Director, and Sri Praveen<br />
Kumar Gangrade, former Jt. Director, Women and Child Development Department,<br />
Government <strong>of</strong> Madhya Pradesh, and their colleagues for extend<strong>in</strong>g their cooperation and<br />
help <strong>in</strong> the execution <strong>of</strong> this study.<br />
The <strong>in</strong>frastructural & logistic support extended by Pr<strong>of</strong>. S.K. Trivedi,<br />
Executive Director, Mr. Gokul pal, Research Officer and their colleagues at Indian<br />
Institute <strong>of</strong> Development Management (IIDM), Bhopal is gratefully acknowledged.<br />
Our thanks are also due to UNICEF-Madhya Pradesh and UNICEF-New Delhi<br />
for their support by provid<strong>in</strong>g anthropometric equipment for use <strong>in</strong> this study.<br />
The help and support provided by the Districts Project Officers, Child<br />
Development Project Officers, Supervisors, Anganwadi Workers (AWWs) and<br />
ASHA worker (Health functionaries) <strong>of</strong> the concerned districts <strong>in</strong> the execution <strong>of</strong><br />
the survey, is gratefully acknowledged.<br />
Our s<strong>in</strong>cere thanks to the entire field staff for their commitment and<br />
s<strong>in</strong>cere efforts <strong>in</strong> the collection <strong>of</strong> data.<br />
We grateful to Dr. B. Sesikeran, Director, N.I.N and Dr. Vishwa Mohan<br />
Katoch, Director-general, I.C.M.R, and Secretary, Department <strong>of</strong> Health Research,<br />
M<strong>in</strong>istry <strong>of</strong> Health and Family Welfare, GoI, for their constant support and<br />
encouragement.<br />
We also thank Mr. G.Manohar Reddy, Research Officer, Mr. R. Raghunath<br />
Babu, Technical Assistant, Mrs. G.Madhavi, Technician, Ms. D.Sarala & G.Madhavi<br />
Tabulators, NNMB-CRL, and Ms. D. Balamani, Ms. D. Saritha & Ms. M. Venkata<br />
Ramanamma, Punch Operators, and Mrs. L. Rajeswari & Mr. M. Shashi Kumar Reddy,<br />
Data Entry Operators for their technical help.<br />
We are also thankful to Mr. G. Hanumantha Rao, and Mrs. G. Prashanthi,<br />
Personal Assistants for their secretarial assistance.<br />
Last but not least, we are extremely grateful to the community for their<br />
unst<strong>in</strong>t<strong>in</strong>g cooperation, without which the study would not have been completed<br />
successfully.<br />
Authors
PROJECT STAFF<br />
RESEARCH ASSISTANTS<br />
Sl.No.<br />
Name<br />
2. Mr. PUSHPENDRA KUMAR SINGH<br />
4. Mr. AMOL KUMAR UKE<br />
FIELD INVESTIGATORS<br />
Sl.No.<br />
1.<br />
2.<br />
Name<br />
Mr. DILEEP PATEL<br />
Mr. NIKHIL SHARMA<br />
<strong>Nutritional</strong> <strong>Status</strong> <strong>of</strong>
RESULTS AT GLANCE
RESULTS AT A GLANCE<br />
DISTRICT PROFILE<br />
Total population (2001 Census) 15,87,264<br />
Sex Ratio 822<br />
Population density (per sq km) 318<br />
Percent <strong>of</strong> Schedule caste 21.1<br />
Percent <strong>of</strong> Schedule Tribes 8.0<br />
Literacy status (%) 65.6<br />
Female literacy (%) 46.8<br />
SAMPLE CHARACTERISTICS<br />
HHs surveyed (n) 400<br />
Average Family size (n) 942<br />
Average per capita monthly <strong>in</strong>come (Rs) 6.6<br />
COMMUNITY (%)<br />
Scheduled Caste 18.5<br />
Scheduled Tribe 7.5<br />
TYPE OF FAMILY (%)<br />
Nuclear 44.7<br />
Extended Nuclear 21.3<br />
Jo<strong>in</strong>t 34.0<br />
LITERACY STATUS (%)<br />
Father 83.2<br />
Mother 55.4<br />
LAND HOLDING (% HHs)<br />
Land less Families 41.4<br />
Marg<strong>in</strong>al Farmers 23.5<br />
Small Farmers 25.3<br />
Large Farmers 9.8<br />
.<br />
(Contd… 2)<br />
Nutr. Staust. <strong>of</strong> < 5 <strong>year</strong> Children<br />
Morena Dt.- Madhya Pradesh
RESULTS AT A GLANCE (Contd…2)<br />
MAJOR OCCUPATION OF HOUSEHOLD<br />
Percent<br />
Labourers 32.3<br />
Cultivators 41.6<br />
Land Lords -<br />
Artisans 4.3<br />
Service 13.5<br />
Bus<strong>in</strong>ess 7.3<br />
TYPE OF HOUSE<br />
Kutcha 21.3<br />
Semi-Pucca 55.4<br />
Pucca 23.3<br />
SOURCE OF DRINKING WATER<br />
Open well 4.0<br />
Tube well 96.0<br />
Tap -<br />
HOUSEHOLD ELECTRICITY 18.0<br />
PRESENT AND USING SANITARY LATRINE 15.8<br />
IODINE CONTENT OF COOKING SALT<br />
0 ppm 45.2<br />
Delivery conducted by<br />
RESULTS AT A GLANCE (Contd…3)<br />
PARTICULARS<br />
Percent<br />
M.O. PHC 65.3<br />
ANM/LHV 28.7<br />
Pvt. Doctor 5.0<br />
Untra<strong>in</strong>ed Dai/Others 1.0<br />
Low birth weight (% <strong>in</strong>fants) 10.0<br />
BREAST FEEDING AND COMPLEMENTARY FEEDING<br />
Initiate <strong>of</strong> Breast feed<strong>in</strong>g (hours)<br />
Age <strong>of</strong> <strong>in</strong>itiation <strong>of</strong> complementary Feed<strong>in</strong>g<br />
Immunization ( 12-24 months <strong>children</strong>)<br />
EXECUTIVE SUMMARY
Executive Summary<br />
Undernutrition cont<strong>in</strong>ues to be a major public health problem <strong>in</strong> the develop<strong>in</strong>g<br />
countries, <strong>in</strong>clud<strong>in</strong>g India, the most vulnerable groups be<strong>in</strong>g women and young<br />
<strong>children</strong>. Proper nutrition is necessary for adequate growth and development <strong>of</strong><br />
<strong>children</strong>. Undernutrition is <strong>of</strong> multi-factorial aetiology, which <strong>in</strong>clude both food and<br />
non-food factors.<br />
Accord<strong>in</strong>g to the recent reports <strong>of</strong> NFHS-3 (2005-06), the prevalence <strong>of</strong><br />
<strong>under</strong>weight among <strong>under</strong> <strong>five</strong> <strong>year</strong> <strong>children</strong> <strong>in</strong> the state <strong>of</strong> Madhya Pradesh was 60%,<br />
stunt<strong>in</strong>g was 50% and wast<strong>in</strong>g was 35%, while accord<strong>in</strong>g to NNMB surveys carried out<br />
dur<strong>in</strong>g the same period (2005-06), the prevalence <strong>of</strong> <strong>under</strong>weight and wast<strong>in</strong>g was lower<br />
(46% and 24% respectively) and that <strong>of</strong> stunt<strong>in</strong>g was more (59%). The prevalence <strong>of</strong><br />
<strong>under</strong>nutrition especially among <strong>under</strong> <strong>five</strong> <strong>year</strong> <strong>children</strong> may vary geographically.<br />
Therefore, for the development <strong>of</strong> area specific <strong>in</strong>tervention strategies, assessment <strong>of</strong><br />
district level prevalence <strong>of</strong> <strong>under</strong>nutrition is very essential. At the request <strong>of</strong> DWCD,<br />
Government <strong>of</strong> Madhya Pradesh, the National Institute <strong>of</strong> Nutrition, Hyderabad<br />
therefore carried out the present study to estimate the prevalence <strong>of</strong> <strong>under</strong>nutrition<br />
among <strong>under</strong> <strong>five</strong> <strong>year</strong> <strong>rural</strong> <strong>children</strong> and <strong>in</strong>fant and young child feed<strong>in</strong>g practices. It<br />
was a cross sectional study carried out us<strong>in</strong>g multi-stage random sampl<strong>in</strong>g<br />
procedure. A total <strong>of</strong> 400 HHs from 20 randomly selected villages, <strong>in</strong>clud<strong>in</strong>g 410<br />
<strong>children</strong> were covered for the present study.<br />
A majority <strong>of</strong> the HHs covered <strong>in</strong> the present survey belonged to backward<br />
communities (42.5%) followed by others (31.5%) and Scheduled Caste (18.5%).<br />
About 45% <strong>of</strong> the HHs were nuclear families. About 45% <strong>of</strong> the mothers were<br />
illiterate, two fifth <strong>of</strong> the HHs (41%) did not possess any agricultural land and about<br />
one third (32%) were engaged <strong>in</strong> either agricultural or other labours. Majority (80%)<br />
<strong>of</strong> the women were housewives. About a half <strong>of</strong> HHs (55%) lived <strong>in</strong> semi pucca<br />
houses and 21% <strong>in</strong> kutcha. Majority (96%) <strong>of</strong> the HHs were us<strong>in</strong>g bore well water.<br />
Only 16% were us<strong>in</strong>g sanitary latr<strong>in</strong>e. Majority (97%) <strong>of</strong> HHs were us<strong>in</strong>g firewood for<br />
cook<strong>in</strong>g purpose and only 18% HHs had electricity. Only about 15% <strong>of</strong> HHs were<br />
us<strong>in</strong>g adequately iodized salt (≥15 ppm).<br />
<strong>Nutritional</strong> <strong>Status</strong> <strong>of</strong>
About two thirds (69%) <strong>of</strong> pregnant women had <strong>under</strong>gone Antenatal check-up<br />
(ANC) <strong>of</strong> which about 19% had ≥3 ANCs. Half (50%) <strong>of</strong> the pregnant women were<br />
registered for ANC before 16 weeks <strong>of</strong> gestation. About 81% <strong>of</strong> pregnant women<br />
received IFA tablets dur<strong>in</strong>g pregnancy, 27% received more than 90 tablets and all <strong>of</strong><br />
them reportedly consumed ≥90 tablets. About 99% deliveries were <strong>in</strong>stitutional<br />
deliveries, either <strong>in</strong> government or private hospitals. Majority (70%) <strong>of</strong> deliveries were<br />
conducted by a medical doctor. Birth weights were reportedly recorded <strong>in</strong> case <strong>of</strong> 69%<br />
<strong>in</strong>fants, and records were available for all <strong>in</strong>fants measured. The overall prevalence <strong>of</strong><br />
low birth weight was 10%.<br />
Most <strong>of</strong> the mothers (99%) fed colostrum to their newborns. About half<br />
(53.5%) <strong>of</strong> mothers <strong>in</strong>itiated breastfeed<strong>in</strong>g with<strong>in</strong> 1hour and 45% did so with<strong>in</strong> 1-3<br />
hours <strong>of</strong> delivery. None <strong>of</strong> the <strong>in</strong>fants were given pre-lacteal feeds such as<br />
glucose/sugar water, honey, etc.<br />
Among 6-11 months <strong>children</strong>, complementary feed<strong>in</strong>g was <strong>in</strong>itiated at 6<br />
months <strong>of</strong> age <strong>in</strong> about 13%, while 33% <strong>children</strong> received the same dur<strong>in</strong>g 7-11<br />
months <strong>of</strong> age. About 43% <strong>of</strong> <strong>children</strong> did not receive complementary feed<strong>in</strong>g.<br />
Of the 6-11 months <strong>in</strong>fants, about 53% each were receiv<strong>in</strong>g cow/buffalo milk<br />
and 44% home made semisolids/solids, about 44% were receiv<strong>in</strong>g such foods at<br />
least 3 times a day. Among 12-35 months <strong>children</strong>, about two thirds (69%) received<br />
complementary feed<strong>in</strong>g <strong>in</strong> addition to breast milk. Majority were receiv<strong>in</strong>g home<br />
made solids and cow/buffalo milk and 72% were receiv<strong>in</strong>g such foods at least 3<br />
times a day.<br />
Majority <strong>of</strong> <strong>children</strong> (92%) were completely immunized, while about 6% did not<br />
receive any immunization. About 97% <strong>of</strong> 9-59 months <strong>children</strong> received at least one<br />
dose <strong>of</strong> Vitam<strong>in</strong> A dur<strong>in</strong>g the preced<strong>in</strong>g <strong>year</strong>. About 98% <strong>of</strong> 18-59 months <strong>children</strong><br />
received the stipulated two doses.<br />
About 9% <strong>of</strong> 12-59 months <strong>children</strong> received ≥90 IFA tablets, while none <strong>of</strong><br />
the <strong>children</strong> consumed ≥90 tablets.<br />
None <strong>of</strong> the <strong>in</strong>fants exhibited the cl<strong>in</strong>ical signs <strong>of</strong> nutritional deficiency, while<br />
0.3% <strong>of</strong> 12-59 months <strong>children</strong> exhibited the signs <strong>of</strong> vitam<strong>in</strong> A deficiency (Bitot spot).<br />
<strong>Nutritional</strong> <strong>Status</strong> <strong>of</strong>
About 21% <strong>of</strong> <strong>children</strong> reportedly had one or more morbidities such as fever,<br />
ARI and diarrhoea dur<strong>in</strong>g the preced<strong>in</strong>g fortnight. The prevalence was relatively<br />
higher among 6-11 months <strong>children</strong>, which tended to decrease with <strong>in</strong>crease <strong>in</strong> age.<br />
About 77% <strong>of</strong> the mothers reported that they generally consult private practitioner,<br />
while 23% went to PHC, to seek treatment for their sick <strong>children</strong>.<br />
The overall prevalence <strong>of</strong> <strong>under</strong>nutrition (
1. INTRODUCTION<br />
India, <strong>in</strong> the past few decades, has witnessed rapid progress <strong>in</strong> terms <strong>of</strong><br />
<strong>in</strong>dustrialization and agricultural production. Yet malnutrition, especially <strong>under</strong>nutrition<br />
cont<strong>in</strong>ues to be a major problem <strong>of</strong> public health significance <strong>in</strong> the country. It is a major<br />
contributor to high rates <strong>of</strong> childhood mortality, maternal mortality and morbidities <strong>in</strong> the<br />
community 1 . Though, poverty is a major <strong>under</strong>ly<strong>in</strong>g cause, scores <strong>of</strong> other factors such<br />
as socio-demographic, socio-cultural and lifestyle practices contribute significantly to the<br />
problem <strong>of</strong> malnutrition.<br />
Prevalence <strong>of</strong> low birth weight, ma<strong>in</strong>ly due to <strong>in</strong>trauter<strong>in</strong>e growth retardation<br />
cont<strong>in</strong>ues to be high, which is attributable to maternal <strong>under</strong>nutrition. This is further<br />
aggravated by <strong>in</strong>appropriate <strong>in</strong>fant and young child feed<strong>in</strong>g practices, such as discard<strong>in</strong>g<br />
<strong>of</strong> colostrum, delayed <strong>in</strong>itiation <strong>of</strong> breast feed<strong>in</strong>g, early or delayed <strong>in</strong>itiation <strong>of</strong><br />
complementary feed<strong>in</strong>g, and sub-optimal complementary feed<strong>in</strong>g practices <strong>in</strong> terms <strong>of</strong><br />
type <strong>of</strong> feed, quantity, and frequency.<br />
It has been found that non-exclusive breast feed<strong>in</strong>g <strong>in</strong> the first six months <strong>of</strong> life<br />
results <strong>in</strong> 1.4 million deaths and 10% <strong>of</strong> the disease burden among <strong>in</strong>fants and young<br />
<strong>children</strong> every <strong>year</strong> <strong>in</strong> the develop<strong>in</strong>g countries 2 . It is also estimated that about 10-15% <strong>of</strong><br />
<strong>under</strong> <strong>five</strong> <strong>year</strong> deaths <strong>in</strong> resource poor countries could be prevented by achiev<strong>in</strong>g 90%<br />
<strong>of</strong> exclusive breast feed<strong>in</strong>g alone 3 and 22% <strong>of</strong> neonatal deaths could be prevented if<br />
breast feed<strong>in</strong>g is <strong>in</strong>itiated with<strong>in</strong> the first hour <strong>of</strong> birth 4 .<br />
About 21% <strong>of</strong> global deaths and DALYs (Disability Adjusted Life Years) <strong>in</strong> <strong>children</strong><br />
younger than 5 <strong>year</strong>s are attributed to stunt<strong>in</strong>g, severe wast<strong>in</strong>g, and <strong>in</strong>trauter<strong>in</strong>e growth<br />
retardation. Long term consequences <strong>of</strong> <strong>under</strong>nutrition dur<strong>in</strong>g the early stages <strong>of</strong> child<br />
growth and development <strong>in</strong>clude likelihood <strong>of</strong> short stature <strong>in</strong> adult life, low educational<br />
achievements, giv<strong>in</strong>g birth to smaller <strong>children</strong>, lower economic status and reduced<br />
physical work capacity and productivity <strong>in</strong> adulthood 5 .<br />
Further, the country is pass<strong>in</strong>g through a phase <strong>of</strong> rapid socio-economic transition<br />
lead<strong>in</strong>g to over nutrition <strong>in</strong> certa<strong>in</strong> segments <strong>of</strong> the population, especially <strong>in</strong> the urban<br />
communities. Chang<strong>in</strong>g lifestyles and dietary habits are contribut<strong>in</strong>g to <strong>in</strong>crease <strong>in</strong> the<br />
prevalence <strong>of</strong> overweight/obesity among <strong>children</strong> and young adults expos<strong>in</strong>g them to the<br />
risk <strong>of</strong> chronic degenerative disorders such as hypertension, Type 2 diabetes, coronary<br />
artery disease, stroke, cancers etc <strong>in</strong> the later part <strong>of</strong> life. More over <strong>under</strong>nutrition dur<strong>in</strong>g<br />
early childhood can lead to overweight/obesity <strong>in</strong> adulthood, a risk factor for diet related<br />
chronic diseases 6 .<br />
The major nutritional problems <strong>of</strong> public health significance <strong>in</strong> the country are,<br />
prote<strong>in</strong> energy malnutrition (PEM), vitam<strong>in</strong> A deficiency (VAD), iron deficiency anaemia<br />
(IDA), and iod<strong>in</strong>e deficiency disorders (IDD). Preschool <strong>children</strong>, adolescent girls, women<br />
<strong>Nutritional</strong> <strong>Status</strong> <strong>of</strong>
<strong>of</strong> reproductive age group, elderly, those belong<strong>in</strong>g to socio-economically backward<br />
groups such as scheduled caste and schedule tribe communities, communities resid<strong>in</strong>g<br />
<strong>in</strong> chronically drought affected <strong>rural</strong> areas are nutritionally the most vulnerable segments<br />
<strong>of</strong> the populations.<br />
Several nutrition programmes have been designed and are be<strong>in</strong>g implemented <strong>in</strong><br />
India, through respective State Governments, dur<strong>in</strong>g the past few decades for the<br />
prevention and control <strong>of</strong> both macro and micronutrient malnutrition <strong>in</strong> the population.<br />
They <strong>in</strong>clude supplementary feed<strong>in</strong>g through ICDS, distribution <strong>of</strong> iron and folic acid<br />
tablets, massive dose vitam<strong>in</strong> A supplementation, Mid-day meal programme etc. Also,<br />
several poverty alleviation and developmental programmes are be<strong>in</strong>g implemented by<br />
central and State governments, for the overall socioeconomic development <strong>of</strong> the<br />
communities. In addition, Public Distribution System and TPDS are striv<strong>in</strong>g to provide<br />
essential commodities at affordable price, especially to those below poverty l<strong>in</strong>e<br />
throughout the <strong>year</strong>, all over the country, to ensure household food security.<br />
Children, who are subjected to socio-economic and dietary constra<strong>in</strong>ts dur<strong>in</strong>g their<br />
critical <strong>year</strong>s <strong>of</strong> growth and development, end up as adults with small body size. Such<br />
adults may be apparently healthy, but there is evidence to suggest that their productivity<br />
and earn<strong>in</strong>g capacity are impaired (Satyanarayana and Naidu, 1977 7 ). Repeat surveys by<br />
National Nutrition Monitor<strong>in</strong>g Bureau (1999 8 ) <strong>in</strong> eight States revealed that, despite very<br />
little or no change <strong>in</strong> the dietary <strong>in</strong>takes <strong>of</strong> <strong>rural</strong> population over a period <strong>of</strong> time, there was<br />
a decrease <strong>in</strong> the prevalence <strong>of</strong> severe forms <strong>of</strong> <strong>under</strong>nutrition among young <strong>children</strong> with<br />
concomitant <strong>in</strong>crease <strong>in</strong> normal grades. However, the proportion <strong>of</strong> <strong>children</strong> with mild to<br />
moderate <strong>under</strong>nutrition rema<strong>in</strong>ed similar. Recent survey carried out by NNMB (2006 9 ) <strong>in</strong><br />
the <strong>rural</strong> areas <strong>of</strong> n<strong>in</strong>e States revealed that about 40% <strong>under</strong> 5 <strong>year</strong> <strong>children</strong> were<br />
<strong>under</strong>weight, 45% were stunted and 20% were wasted. The correspond<strong>in</strong>g figures for the<br />
State <strong>of</strong> Madhya Pradesh were, 46%, 59% and 24% respectively.<br />
Accord<strong>in</strong>g to NFHS-3 10 , <strong>in</strong> the State <strong>of</strong> Madhya Pradesh, 60% <strong>of</strong>
and nutrition status <strong>of</strong> the community, the prevalence <strong>of</strong> <strong>under</strong>nutrition cont<strong>in</strong>ues to be<br />
significantly high.<br />
The type and magnitude <strong>of</strong> <strong>under</strong>nutrition may vary from district to district,<br />
depend<strong>in</strong>g on geographical and agro-climatic conditions and therefore, warrant regionspecific<br />
<strong>in</strong>terventions. In order to devise and implement area specific <strong>in</strong>tervention<br />
strategies and to monitor their impact over a period, it is necessary to generate data<br />
base at district level.<br />
In this context, the Government <strong>of</strong> Madhya Pradesh is contemplat<strong>in</strong>g to develop<br />
State Nutrition Policy and develop plan <strong>of</strong> action for implementation, <strong>in</strong> order to improve<br />
the nutritional status <strong>of</strong> the communities. Therefore, at the request <strong>of</strong> the Department <strong>of</strong><br />
Women & Child Development, Government <strong>of</strong> Madhya Pradesh, the National Institute <strong>of</strong><br />
Nutrition carried out survey <strong>in</strong> all the follow<strong>in</strong>g 50 districts <strong>of</strong> the State, to assess the<br />
nutritional status <strong>of</strong> <strong>under</strong> 5 <strong>year</strong> <strong>children</strong> and <strong>in</strong>fant and young child feed<strong>in</strong>g practices.<br />
Sl.<br />
No.<br />
District<br />
Sl.<br />
N<br />
o<br />
District<br />
Sl.<br />
No.<br />
District<br />
Sl.<br />
No<br />
District<br />
Sl.<br />
No<br />
District<br />
1 Alirajpur 11 Ch<strong>in</strong>dwara 21 Indore 31 Neemuch 41 Shadol<br />
2 Anuppur 12 Damoh 22 Jabalpur 32 Panna 42 Shajapur<br />
3 Ashokngar 13 Datia 23 Jhabua 33 Raisen 43 Sheopur<br />
4 Balaghat 14 Dewas 24 Katni 34 Rajgarh 44 Sidhi<br />
5 Barwani 15 Dhar 25 Khandwa 35 Ratlam 45 S<strong>in</strong>grauli<br />
6 Betul 16 D<strong>in</strong>dori 26 Khargone 36 Rewa 46 Shivpuri<br />
7 Bh<strong>in</strong>d 17 Guna 27 Mandla 37 Sagar 47 Tikamgarh<br />
8 Bhopal 18 Gwalior 28 Mandsaur 38 Sathna 48 Ujja<strong>in</strong><br />
9 Burhanpur 19 Harda 29 Morena 39 Sehore 49 Umaria<br />
10 Chhatarpur 20 Hoshangabad 30 Narasimhapur 40 Seoni 50 Vidisha<br />
The results <strong>of</strong> the study carried out <strong>in</strong> Morena district <strong>of</strong> Madhya Pradesh State<br />
dur<strong>in</strong>g February-August 2010, is presented <strong>in</strong> this report.<br />
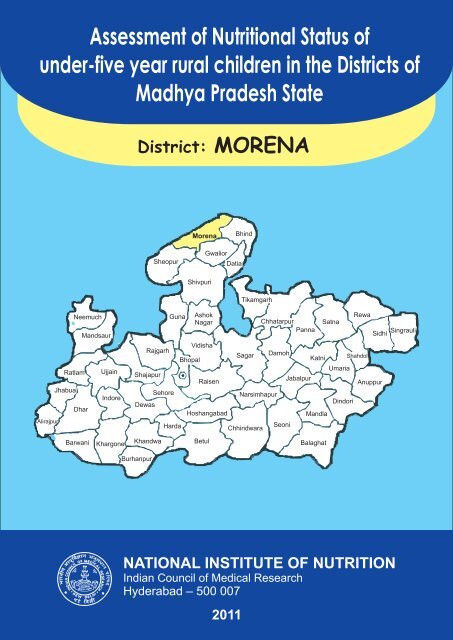
1.1 Pr<strong>of</strong>ile <strong>of</strong> Morena District<br />
The Morena district is surrounded by Dholpur district <strong>of</strong> Rajasthan <strong>in</strong> north-west,<br />
P<strong>in</strong>ahat district (Uttar Pradesh) <strong>in</strong> north-east, Bh<strong>in</strong>d district <strong>in</strong> the east and Sheopur and<br />
Gwalior <strong>in</strong> the south. The total population <strong>of</strong> the district is 15,87,264 (2001 census), with<br />
a population density <strong>of</strong> 318/sq.km. About 78% <strong>of</strong> the population was <strong>rural</strong> and 22% was<br />
urban. The proportion <strong>of</strong> Scheduled Caste population was 21.1%, while that <strong>of</strong><br />
Scheduled Tribe was 8%. The district has a sex ratio <strong>of</strong> 822. The overall literacy rate is<br />
65.6% with 81% for males and 46.8% for females.<br />
2. OBJECTIVES<br />
2.1 General Objective<br />
The general objective <strong>of</strong> the study was to assess the health and nutritional status<br />
<strong>of</strong>
2.2 Specific objectives<br />
The specific objectives <strong>of</strong> the study were,<br />
1. To assess the nutritional status <strong>of</strong>
3.2.1 Household demographic and socioeconomic particulars<br />
Information on household demographic and socio-economic particulars were<br />
collected <strong>in</strong> all the 20 households selected for survey, us<strong>in</strong>g a pre-coded and pre tested<br />
questionnaire.<br />
3.2.2 Anthropometry<br />
Height (up to nearest 1mm) and weight (up to nearest 100g) <strong>of</strong> the <strong>children</strong> were<br />
measured us<strong>in</strong>g standard anthropometric equipment and procedures 13 . The nutritional<br />
status <strong>of</strong> <strong>children</strong> was assessed accord<strong>in</strong>g to SD classification 14 us<strong>in</strong>g WHO growth<br />
standards (2006) 15 .<br />
Standard Deviation Classification<br />
<strong>Nutritional</strong> status <strong>of</strong> preschool <strong>children</strong> was assessed accord<strong>in</strong>g to weight for age,<br />
height for age and weight for height, by Standard Deviation classification recommended<br />
by WHO, as given below:<br />
Cut-<strong>of</strong>f level<br />
<strong>Nutritional</strong> grade<br />
Weight for Age Height for Age Weight for Height<br />
≥ Median –2SD Normal Normal Normal<br />
< Median –2SD to
3.2.7 Coverage <strong>of</strong> <strong>children</strong> <strong>under</strong> various health & nutrition <strong>in</strong>tervention<br />
Programmes.<br />
Particulars <strong>of</strong> coverage <strong>of</strong> <strong>children</strong> for all the immunizations such as BCG, DPT,<br />
Polio and measles dur<strong>in</strong>g first <strong>year</strong> <strong>of</strong> life was collected for <strong>children</strong> aged 12-24 months.<br />
In addition, the coverage <strong>of</strong> 9-59 months <strong>children</strong> for supplementation <strong>of</strong> massive dose<br />
vitam<strong>in</strong> A was collected. The coverage <strong>of</strong> 1-5 <strong>year</strong> <strong>children</strong> for distribution <strong>of</strong> Iron & Folic<br />
acid (IFA) tablets/syrup was also collected. Information on participation <strong>of</strong> 6-59 months<br />
<strong>children</strong> <strong>in</strong> the ICDS supplementary feed<strong>in</strong>g programme was also collected.<br />
3.2.8 Spot test<strong>in</strong>g <strong>of</strong> household cook<strong>in</strong>g salt for Iod<strong>in</strong>e<br />
Cook<strong>in</strong>g salt samples collected from the households were tested for iod<strong>in</strong>e<br />
content by us<strong>in</strong>g spot test<strong>in</strong>g kits, supplied by UNICEF, Madhya Pradesh.<br />
3.3 Recruitment, tra<strong>in</strong><strong>in</strong>g, standardization <strong>of</strong> field Investigators and data collection<br />
Ten teams, each consist<strong>in</strong>g <strong>of</strong> two post graduate Research Assistants<br />
(Nutritionist/Anthropologist/Social worker) and one graduate Field Investigator hav<strong>in</strong>g<br />
pr<strong>of</strong>iciency <strong>in</strong> local language were recruited, tra<strong>in</strong>ed and standardized <strong>in</strong> various survey<br />
methodologies, by the scientists from the National Institute <strong>of</strong> Nutrition. All the survey<br />
<strong>in</strong>struments (pr<strong>of</strong>ormae) were developed, translated <strong>in</strong>to h<strong>in</strong>di vernacular and pre-tested<br />
before be<strong>in</strong>g used <strong>in</strong> the survey. Data was collected <strong>in</strong> each district by two teams.<br />
3.4 Quality Control<br />
Random checks were carried out by scientists from NIN, periodically by revisit<strong>in</strong>g<br />
the households surveyed by the field staff, to ensure quality <strong>of</strong> data collection.<br />
3.5 Data Analysis<br />
The data was scrut<strong>in</strong>ized and entered <strong>in</strong>to the computers as soon as it was<br />
received at NIN. The data clean<strong>in</strong>g was done by carry<strong>in</strong>g out range and consistency<br />
checks. Descriptive and analytical statistics <strong>of</strong> the data were carried out us<strong>in</strong>g SPSS<br />
W<strong>in</strong>dows version 15.0. Appropriate statistical tools were used wherever needed.<br />
4. RESULTS<br />
4.1 Coverage<br />
A total <strong>of</strong> 400 households from 20 villages were covered for the study (Table 1). A<br />
total <strong>of</strong> 410 <strong>children</strong> (Boys:240; Girls:170)
addition, cook<strong>in</strong>g salt samples from all the households surveyed were tested for iod<strong>in</strong>e<br />
content, by us<strong>in</strong>g spot test<strong>in</strong>g kits.<br />
4.2 Household Socio-economic and Demographic particulars<br />
The demographic and socio-economic particulars <strong>of</strong> the households (HHs)<br />
covered for the survey is provided <strong>in</strong> Table 2.<br />
4.2.1 Community<br />
About 43% <strong>of</strong> households covered for the survey belonged to backward<br />
communities, while 32% belonged to other communities. Scheduled Caste and<br />
Scheduled Tribe communities accounted for 19% and 8% respectively.<br />
4.2.2 Type <strong>of</strong> family<br />
About 45% <strong>of</strong> the HHS were nuclear families and 34% were jo<strong>in</strong>t, while the<br />
rema<strong>in</strong><strong>in</strong>g 21% were extended nuclear families.<br />
4.2.3 Family size<br />
The average family size was 6.6. About 27% <strong>of</strong> the HHs had family size <strong>of</strong> ≤ 4<br />
members, 56% <strong>of</strong> HHs had 5-9 and 17% <strong>of</strong> HHs had ≥10 members.<br />
4.2.4 Literacy status <strong>of</strong> father<br />
About 83% <strong>of</strong> the fathers <strong>of</strong> the <strong>in</strong>dex <strong>children</strong> were literates. About 14% had an<br />
education level <strong>of</strong> 1-5 th class, about 40% had school<strong>in</strong>g <strong>of</strong> 6 th -10 th class, 18% were<br />
studied up to <strong>in</strong>termediate and 12% had graduation or above .<br />
4.2.5 Literacy status <strong>of</strong> mother<br />
About 55% <strong>of</strong> the mothers <strong>of</strong> the <strong>in</strong>dex <strong>children</strong> were literates. About 21% <strong>of</strong> them<br />
had an education level <strong>of</strong> 1-5 th class, 23% were educated up to 6 th -10 th class, while about<br />
12% had education level <strong>of</strong> <strong>in</strong>termediate or above.<br />
4.2.6 Household landhold<strong>in</strong>g<br />
About 41% <strong>of</strong> households did not posses any agricultural land, about 25% were<br />
small farmers (2.5 - 5 acres), 24% were marg<strong>in</strong>al farmers (
4.2.9 Per capita monthly <strong>in</strong>come<br />
The average monthly per capita <strong>in</strong>come (PCI) <strong>of</strong> HHs was Rs 942. About 8% <strong>of</strong><br />
the HHs had average PCI <strong>of</strong> < Rs. 300, 31% had Rs.300-600 and 26% had Rs. 600-900,<br />
while about 36% had monthly PCI <strong>of</strong> ≥ Rs.900.<br />
4.3 Household Physical facilities<br />
4.3.1 Type <strong>of</strong> house<br />
About 55% percent <strong>of</strong> the houses were semi-pucca <strong>in</strong> nature, 21% were kutcha<br />
and 23% were pucca (Table 3).<br />
4.3.2 Household amenities<br />
The major source <strong>of</strong> dr<strong>in</strong>k<strong>in</strong>g water was from tube well (96%), followed by open<br />
well (4%). Only about 3% <strong>of</strong> the HHs were us<strong>in</strong>g LPG or bio-gas for cook<strong>in</strong>g purposes,<br />
while 97% <strong>of</strong> HHs were us<strong>in</strong>g firewood. About 18% <strong>of</strong> the houses were electrified. About<br />
16% <strong>of</strong> the HHs were us<strong>in</strong>g sanitary latr<strong>in</strong>e. About 36% <strong>of</strong> HHs had provision <strong>of</strong> separate<br />
kitchen.<br />
4.4 Iod<strong>in</strong>e content <strong>of</strong> Cook<strong>in</strong>g salt<br />
The distribution <strong>of</strong> HHs accord<strong>in</strong>g to iod<strong>in</strong>e content <strong>of</strong> cook<strong>in</strong>g salt as estimated by<br />
spot test<strong>in</strong>g kit is presented <strong>in</strong> Table 4. It was observed that about half <strong>of</strong> the HHs<br />
(46.2%) were us<strong>in</strong>g powdered salt, while only 18% were us<strong>in</strong>g free flow<strong>in</strong>g salt. Only<br />
15% <strong>of</strong> HHs were us<strong>in</strong>g adequately iodized (≥15 ppm) salt, 40% samples had
consume more green leafy vegetables and fruits, attend ANCs regularly and consume IFA<br />
tablets dur<strong>in</strong>g pregnancy.<br />
About 81% <strong>of</strong> pregnant women received IFA tablets. While about 27% received and<br />
consumed ≥90 tablets dur<strong>in</strong>g the pregnancy. The IFA tablets were received mostly from<br />
AWW (57.8%). Nearly 89% <strong>of</strong> the mothers reportedly received two doses <strong>of</strong> TT<br />
immunization.<br />
4.5.3 Particulars <strong>of</strong> last Delivery (Mothers hav<strong>in</strong>g
%<br />
Fig.1 Distribution (%) <strong>of</strong> 0-11 months Children accord<strong>in</strong>g to<br />
Time <strong>of</strong> Initiation <strong>of</strong> Breastfeed<strong>in</strong>g (BF)<br />
70<br />
60<br />
50<br />
40<br />
53.5<br />
45.5<br />
30<br />
20<br />
10<br />
0<br />
<strong>in</strong>cluded cow/buffalo milk (53.3%), followed by home made solids (44%) and home made<br />
semi-solids (26.7%) (Table 11).<br />
The foods generally <strong>in</strong>cluded <strong>in</strong> the complementary feeds were milk & milk products<br />
and cereals & millets (49.3% each), pulses (36%), fruits (22.7%), and GLV (9.3%). About<br />
44% <strong>of</strong> the <strong>children</strong> received 3-4 complementary feeds per day, while the rest (13%)<br />
received 2 feeds a day. About 37% <strong>of</strong> mothers fed the <strong>in</strong>fants with their hand, while 13%<br />
gave complementary feed<strong>in</strong>g with spoon. In about 7% <strong>of</strong> cases, the <strong>in</strong>fants fed by<br />
themselves. The feed<strong>in</strong>g was supervised mostly by the mother (57.3%) (Table 12).<br />
4.6.2.2 12-35 month <strong>children</strong><br />
About 69% <strong>of</strong> the <strong>children</strong> were currently receiv<strong>in</strong>g complementary foods <strong>in</strong> addition to<br />
breast milk and 31% <strong>of</strong> the <strong>children</strong> were completely weaned. The type <strong>of</strong> food be<strong>in</strong>g<br />
currently given <strong>in</strong>cluded cow/buffalo milk (98.8%), home made solids (98.3%), and home<br />
made semi-solids (46.2%). The most commonly used food groups <strong>in</strong>cluded cereals &<br />
millets (100%), pulses and GLV (99.4% each), other vegetables, roots & tubers and<br />
Milk & milk products (97.7% each), fats & oils (95.4%) followed by fruits (86.7%), eggs<br />
(13.9%) and flesh foods (7.5%). About 32% <strong>of</strong> the <strong>children</strong> were fed ≥ 4 times a day,<br />
39% were fed 3 times a day, while 28% were fed ≤ 2 times a day. About 51% <strong>of</strong> the<br />
<strong>children</strong> consumed food themselves mostly with hands. About 49% <strong>of</strong> <strong>children</strong> were fed<br />
by their mothers. In most cases, feed<strong>in</strong>g was supervised by their mothers (99.4%) (Table<br />
13).<br />
4.6.3 Care <strong>of</strong> the Child<br />
About 80% <strong>of</strong> mothers reportedly were tak<strong>in</strong>g care <strong>of</strong> their <strong>children</strong> by themselves at<br />
home, while 7% stated that they were cared by either the grand parents (4.9%) or by the older<br />
sibl<strong>in</strong>gs (1.5%) (Table 14). About 9% <strong>of</strong> the mothers carried their <strong>children</strong> to the work-spot.<br />
4.6.4 Personal Hygiene<br />
About 37% <strong>of</strong> mothers washed their hands with soap before feed<strong>in</strong>g the child.<br />
About 80% were us<strong>in</strong>g soap for wash<strong>in</strong>g their hands after defecation (Table 14).<br />
4.6.5 History <strong>of</strong> Morbidity<br />
The particulars <strong>of</strong> morbidity dur<strong>in</strong>g preced<strong>in</strong>g fortnight among
espectively), and tended to decrease with <strong>in</strong>creas<strong>in</strong>g age to 2% and 7% respectively <strong>in</strong><br />
the age group <strong>of</strong> 48-59 months.<br />
A majority <strong>of</strong> the mothers <strong>in</strong> general stated that, they consult a private practitioner<br />
(77.1%), or visit the PHC (22.7%), when the <strong>children</strong> fall sick, (Table 16). About 11% <strong>of</strong> the<br />
<strong>children</strong> reportedly had diarrhoea dur<strong>in</strong>g the previous fortnight, while about 8% received<br />
ORS, either home made (7.8%) or that given by ANM/AWW (7.3%) or commercial one<br />
(1%). A relatively higher proportion (9.2%) <strong>of</strong> <strong>children</strong> (12-35 months) were given ORS,<br />
compared to 0-11 months <strong>children</strong> (6.9%). About 3% reportedly had acute respiratory<br />
<strong>in</strong>fection, while none had received co-trimoxazole.<br />
4.6.6 Participation <strong>in</strong> ICDS Supplementary feed<strong>in</strong>g Programme.<br />
About 74% <strong>of</strong> the <strong>children</strong> <strong>of</strong> 6-59 months age group were participat<strong>in</strong>g <strong>in</strong> the ICDS<br />
supplementary feed<strong>in</strong>g programme, with 41% be<strong>in</strong>g regular. The extent <strong>of</strong> participation<br />
was observed to be high (97%) among 36-59 months as compared to 61% among 6-35<br />
months age group (Table 17). A higher proportion <strong>of</strong> older <strong>children</strong> (36-59 months) were<br />
regular (72.8%), than younger counterparts (23%).<br />
4.6.7 Coverage for Immunization <strong>under</strong> UIP<br />
The particulars <strong>of</strong> coverage <strong>of</strong> 12-24 months <strong>children</strong> for immunization <strong>under</strong><br />
Universal Immunization Programme (UIP) dur<strong>in</strong>g the first <strong>year</strong> <strong>of</strong> life are provided <strong>in</strong> Table<br />
18 and Fig. 3. About 92% <strong>of</strong> the <strong>children</strong> were fully immunized, 6% were partially<br />
immunized, while about 1% did not receive any immunization. About 97-99% received<br />
polio, DPT & BCG vacc<strong>in</strong>es, while only 97% received measles vacc<strong>in</strong>ation. Major source<br />
<strong>of</strong> this <strong>in</strong>formation was from mother and child protection card (38.5%), followed by AWC<br />
records (25.6%), parents (23%) and immunization card (6.4%). The major reason for not<br />
immunized or partially immunized was ‘not <strong>of</strong>fered’ (7.7%).<br />
4.6.8 Coverage for Massive dose <strong>of</strong> Vitam<strong>in</strong> A Supplementation<br />
The National programme on Prevention and control <strong>of</strong> bl<strong>in</strong>dness due to Vitam<strong>in</strong> A<br />
deficiency envisages that all the <strong>children</strong> between 9 to 60 months should receive<br />
biannual massive dose <strong>of</strong> vitam<strong>in</strong> A. The particulars <strong>of</strong> coverage <strong>of</strong> <strong>children</strong> for massive<br />
dose vitam<strong>in</strong> A dur<strong>in</strong>g the previous one <strong>year</strong> are provided <strong>in</strong> Table 19. In general, about<br />
97% <strong>of</strong> 9-59 months <strong>children</strong> reportedly received at least one dose <strong>of</strong> vitam<strong>in</strong> A. While<br />
the coverage was 98% among 18-59 months <strong>children</strong>, and 91% <strong>children</strong> <strong>of</strong> 9-17 months<br />
received massive dose <strong>of</strong> vitam<strong>in</strong> A. About 98% <strong>of</strong> 18-59 months <strong>children</strong> received 2<br />
doses dur<strong>in</strong>g preced<strong>in</strong>g one <strong>year</strong>. In a majority <strong>of</strong> cases, the massive dose vitam<strong>in</strong> A was<br />
adm<strong>in</strong>istered at AWC (95.8%), mostly by ANM (50.4%) or AWW (46.2%). The major<br />
reasons for non-receipt <strong>of</strong> massive dose <strong>of</strong> Vitam<strong>in</strong> A were time/place not convenient<br />
(1.7%) or ‘not <strong>of</strong>fered’ (0.9%).<br />
<strong>Nutritional</strong> <strong>Status</strong> <strong>of</strong>
%<br />
100<br />
90<br />
98.6<br />
Fig. 3 Coverage (%) <strong>of</strong> 12-24 months Children for Immunization <strong>under</strong><br />
Universal Immunization Program (UIP)<br />
98.6 98.6 98.6 97.3 97.3 97.3 97.3<br />
80<br />
92.3<br />
70<br />
60<br />
50<br />
40<br />
30<br />
20<br />
10<br />
6.3<br />
1.4<br />
0<br />
BCG DPT1 DPT2 DPT3 OPV1 OPV2 OPV3 Measles Full Imm. Partial<br />
Imm.<br />
No Imm.<br />
<strong>Nutritional</strong> <strong>Status</strong> <strong>of</strong>
4.6.9 Coverage for Iron and Folic acid tablets Supplementation<br />
About 35% <strong>children</strong> <strong>of</strong> 12-59 months reportedly received IFA tablets dur<strong>in</strong>g the<br />
preced<strong>in</strong>g <strong>year</strong>, either from AWW (34.7%) or ANM (0.6%). Only about 9% received ≥ 90<br />
IFA tablets, while none <strong>of</strong> them consumed ≥ 90 tablets (Table 20).<br />
4.7 <strong>Nutritional</strong> status <strong>of</strong> <strong>children</strong> (
20<br />
16<br />
Fig.4 Distance charts for Weights - Boys<br />
Median Wt - WHO Standards<br />
Mean Wt - Current Study<br />
Wt (Kgs)<br />
12<br />
8<br />
4<br />
0<br />
0<br />
2<br />
3<br />
4<br />
5<br />
6<br />
7<br />
8<br />
9<br />
10<br />
11<br />
12-17<br />
18-23<br />
24-29<br />
30-35<br />
36-41<br />
42-47<br />
48-53<br />
54-59<br />
Age (Months)<br />
20<br />
16<br />
Fig.5 Distance charts for Weights - Girls<br />
Median Wt - WHO Standards<br />
Mean Wt - Current Study<br />
Wt (Kgs)<br />
12<br />
8<br />
4<br />
0<br />
0<br />
1<br />
2<br />
3<br />
4<br />
5<br />
6<br />
7<br />
8<br />
9<br />
10<br />
11<br />
Age (Months)<br />
12-17<br />
18-23<br />
24-29<br />
30-35<br />
36-41<br />
42-47<br />
48-53<br />
54-59<br />
<strong>Nutritional</strong> <strong>Status</strong> <strong>of</strong>
120<br />
100<br />
Fig.6 Distance charts for Heights - Boys<br />
Meadian Ht-WHO standards<br />
Mean Ht -Current Study<br />
80<br />
Ht (Cms)<br />
60<br />
40<br />
20<br />
0<br />
0<br />
2<br />
3<br />
4<br />
5<br />
6<br />
7<br />
8<br />
9<br />
10<br />
11<br />
12-17<br />
18-23<br />
24-29<br />
30-35<br />
36-41<br />
42-47<br />
48-53<br />
54-59<br />
Age (Months)<br />
120<br />
100<br />
Fig.7 Distance charts for Heights - Girls<br />
Meadian Ht-WHO standards<br />
Mean Ht -Current Study<br />
80<br />
Ht (Cms)<br />
60<br />
40<br />
20<br />
0<br />
0<br />
1<br />
2<br />
3<br />
4<br />
5<br />
6<br />
7<br />
8<br />
9<br />
10<br />
11<br />
Age (Months)<br />
12-17<br />
18-23<br />
24-29<br />
30-35<br />
36-41<br />
42-47<br />
48-53<br />
54-59<br />
<strong>Nutritional</strong> <strong>Status</strong> <strong>of</strong>
Fig.8 Prevalence (%) <strong>of</strong> Undernutrition among
The overall prevalence <strong>of</strong> stunt<strong>in</strong>g among
Fig.10 Prevalence (%) <strong>of</strong> Undernutrition among
16% respectively), compared to those with family size <strong>of</strong> ≥10 members (9%). However,<br />
none <strong>of</strong> the differences were statistically significant.<br />
Literacy status <strong>of</strong> father<br />
The prevalence <strong>of</strong> <strong>under</strong>weight (p
Fig.11 Prevalence (%) <strong>of</strong> Undernutrition among
Fig.13 Prevalence (%) <strong>of</strong> Undernutrition among
prevalence <strong>of</strong> stunt<strong>in</strong>g tended to <strong>in</strong>crease with <strong>in</strong>creas<strong>in</strong>g <strong>in</strong>come from about 60% among<br />
those with PCI <strong>of</strong>
Fig.15 Prevalence (%) <strong>of</strong> Undernutrition among
HHs us<strong>in</strong>g sanitary latr<strong>in</strong>es (12%) compared to those not us<strong>in</strong>g or not hav<strong>in</strong>g sanitary<br />
latr<strong>in</strong>es (16%).<br />
Separate Kitchen<br />
The prevalence <strong>of</strong> <strong>under</strong>weight, and stunt<strong>in</strong>g was significantly (p
American Academy <strong>of</strong> Paediatrics (1997) 18<br />
superior for <strong>in</strong>fant feed<strong>in</strong>g.<br />
stated that the mother’s milk is uniquely<br />
Epidemiological research showed that mother’s milk and breastfeed<strong>in</strong>g <strong>of</strong> <strong>in</strong>fants<br />
provides advantages with regard to general health, growth and development while<br />
significantly decreas<strong>in</strong>g risk for a large number <strong>of</strong> acute and chronic diseases. In this<br />
study, breastfeed<strong>in</strong>g was the common practice among the mothers. However, about 54%<br />
<strong>of</strong> the mothers reportedly <strong>in</strong>itiated breastfeed<strong>in</strong>g with<strong>in</strong> one hour after delivery which is<br />
higher than that reported by the NFHS-3 for the State (16%), while 46% <strong>of</strong> the mothers<br />
<strong>in</strong>itiated breastfeed<strong>in</strong>g with<strong>in</strong> 1-3 hours. None <strong>of</strong> the new born received Pre-lacteals. This<br />
is very encourag<strong>in</strong>g observation and needs sustenance as pre-lacteal may be harmful for<br />
the immature gut. Early <strong>in</strong>itiation <strong>of</strong> breast feed<strong>in</strong>g is the primary determ<strong>in</strong>ant <strong>of</strong> maternal<br />
milk production and secretion. Avoidance <strong>of</strong> other fluids or foods is essential to optimize<br />
breast milk <strong>in</strong>take by the newborn. Most <strong>of</strong> the other fluids or foods are less nutritious<br />
than breast milk and therefore, if displacement occurs, the <strong>in</strong>fant may be at a nutritional<br />
disadvantage even if prepared hygienically 16-18 . In many communities, it is traditionally<br />
believed that colostrum is unhealthy and therefore is harmful to the baby. However <strong>in</strong> the<br />
present study, colostrum was given by majority (99%) <strong>of</strong> mothers which is good for the<br />
child’s health and nutrition and such desirable practices should be encouraged <strong>in</strong> the<br />
community.<br />
Breast milk can contribute significantly as a source <strong>of</strong> energy, fat, high quality<br />
prote<strong>in</strong> and micronutrients, especially when the quality <strong>of</strong> available complementary food<br />
is low (Academy <strong>of</strong> Educational Development, 1999 19 ). WHO 20 and UNICEF (1993a 21 )<br />
recommends that complementary feed<strong>in</strong>g should be <strong>in</strong>itiated immediately after 6 months<br />
<strong>of</strong> the <strong>in</strong>fant’s age and breastfeed<strong>in</strong>g should be cont<strong>in</strong>ued well <strong>in</strong>to the second <strong>year</strong> <strong>of</strong> life<br />
and for longer duration, if possible. In this study, the mothers cont<strong>in</strong>ued to breastfeed for<br />
a longer duration (up to 2 <strong>year</strong>s), however undesirable complementary feed<strong>in</strong>g practices<br />
appear to be significant <strong>in</strong> the district <strong>of</strong> Morena <strong>in</strong> terms <strong>of</strong> <strong>in</strong>itiation and frequency <strong>of</strong><br />
feed<strong>in</strong>g.<br />
The <strong>in</strong>itiation <strong>of</strong> complementary feed<strong>in</strong>g was unduly delayed. Only about 57% <strong>of</strong><br />
the 6-11 months <strong>children</strong> were gett<strong>in</strong>g complementary feeds, while only 13% started<br />
receiv<strong>in</strong>g the same at the age <strong>of</strong> 6 months. The complementary foods be<strong>in</strong>g given mostly<br />
<strong>in</strong>cluded cow/buffalo milk and home made semi-solids. The frequency <strong>of</strong> feed<strong>in</strong>g was at<br />
least 3 times <strong>in</strong> 44% <strong>of</strong> the <strong>in</strong>fants. Effective immunization programme aga<strong>in</strong>st the<br />
common communicable diseases are required for the majority <strong>of</strong> the susceptible<br />
populations particularly <strong>in</strong> the develop<strong>in</strong>g countries, where<strong>in</strong> the risk <strong>of</strong> disability or death<br />
from preventable <strong>in</strong>fectious diseases is a matter <strong>of</strong> concern. Therefore, coverage <strong>under</strong><br />
universal immunization programme should be 100%. It has been observed <strong>in</strong> this study<br />
that majority (92.3%) were fully immunized.<br />
<strong>Nutritional</strong> <strong>Status</strong> <strong>of</strong>
The programme for prevention <strong>of</strong> bl<strong>in</strong>dness due to vitam<strong>in</strong> A deficiency envisages<br />
distribution <strong>of</strong> massive dose vitam<strong>in</strong> A to all the <strong>children</strong> aged between 9-59 months,<br />
every 6 months. It was observed that about 91% <strong>of</strong> <strong>children</strong> between 9-17 months and<br />
98% <strong>children</strong> between 18-59 months received at least one dose vitam<strong>in</strong> A dur<strong>in</strong>g<br />
previous one <strong>year</strong>. About 97-99% <strong>of</strong> 18-59 months <strong>children</strong> received the suggested two<br />
doses dur<strong>in</strong>g the preced<strong>in</strong>g one <strong>year</strong>. The coverage for iron-folic acid supplementation<br />
was very low (35%), while only 9% received ≥ 90 tablets <strong>in</strong>dicat<strong>in</strong>g, poor coverage. Low<br />
compliance (only 2% consumed 60-90 tablets) <strong>in</strong>dicates weak education component.<br />
There is a need to strengthen the service delivery and monitor<strong>in</strong>g mechanisms for these<br />
programmes.<br />
The common morbidities such as ARI, fever and diarrhoea were reported by the<br />
mothers with the prevalence be<strong>in</strong>g higher <strong>in</strong> the younger age group (6-11 months)<br />
compared to the older age group (12-23 months). The plausible reasons for this could be<br />
due to the prevail<strong>in</strong>g undesirable <strong>in</strong>fant and young child feed<strong>in</strong>g practices coupled with<br />
non-receipt <strong>of</strong> appropriate health care management.<br />
The consumption <strong>of</strong> adequately (≥15ppm) Iodized salt was very low (15%) <strong>in</strong> the<br />
district as compared to National figure (51%) and for the State (36%) 10 .<br />
<strong>Nutritional</strong> status <strong>of</strong> <strong>in</strong>fants and young <strong>children</strong> is not only a vital health issue, but it<br />
is also central to susta<strong>in</strong>able growth and development <strong>of</strong> the child 22 .In the present study,<br />
the prevalence <strong>of</strong> <strong>under</strong>weight, stunt<strong>in</strong>g and wast<strong>in</strong>g was 53%, 71% and 15%.It was<br />
observed that the nutritional status <strong>of</strong> <strong>children</strong> deteriorated as age advances especially<br />
from six months onwards. Undernutrition <strong>in</strong> all its three forms cont<strong>in</strong>ues to be a<br />
significant problem <strong>in</strong> the district <strong>of</strong> Morena, even though the current prevalence <strong>of</strong><br />
<strong>under</strong>weight and wast<strong>in</strong>g <strong>in</strong> the district is considerably lower than that reported for the<br />
State <strong>of</strong> Madhya Pradesh by NFHS-3 (2006) and NNMB (2006). Probably, factors such<br />
as, the energy and nutrient density <strong>of</strong> the complementary foods given, the frequency and<br />
variety <strong>of</strong> foods <strong>of</strong>fered, hygiene aspects <strong>of</strong> food preparation, personal hygiene, the<br />
amount <strong>of</strong> breast milk consumed at different stages <strong>of</strong> complementary feed<strong>in</strong>g, the<br />
frequency <strong>of</strong> breastfeed<strong>in</strong>g and <strong>in</strong>appropriate complementary feed<strong>in</strong>g dur<strong>in</strong>g and after<br />
illness may have an important contributory role for the observed high prevalence <strong>of</strong><br />
<strong>under</strong>nutrition <strong>in</strong> the district.<br />
The study revealed significant association between nutritional status and different<br />
socio-economic variables, which <strong>in</strong>dicate higher rates <strong>of</strong> <strong>under</strong>nutrition <strong>in</strong> the households<br />
<strong>of</strong> vulnerable sections <strong>of</strong> society (SC & ST), among <strong>children</strong> <strong>of</strong> illiterate parents, <strong>children</strong><br />
from landless HHs, <strong>children</strong> <strong>of</strong> fathers engaged <strong>in</strong> labour, those liv<strong>in</strong>g <strong>in</strong> kutcha house<br />
and <strong>in</strong> households with no facility <strong>of</strong> sanitary latr<strong>in</strong>e and separate kitchen. Promotion <strong>of</strong><br />
better <strong>in</strong>fant and young child feed<strong>in</strong>g and health care practices is needed for improv<strong>in</strong>g<br />
the health and nutritional status <strong>of</strong> young <strong>children</strong>.<br />
Last, but not the least, there is need to strengthen programme aimed at <strong>in</strong>come<br />
generation, so as to enhance HH food and nutrition security.<br />
<strong>Nutritional</strong> <strong>Status</strong> <strong>of</strong>
REFERENCES<br />
1. de Onis M, Blossner M, Borghi E, Frongillo EA, Morris R. Estimates <strong>of</strong> global<br />
prevalence <strong>of</strong> childhood <strong>under</strong>weight <strong>in</strong> 1990 and 2015. JAMA 2004; 291:2600-6.<br />
2. Black,RE, Allen LH, Bhutta ZA etal. Meternal and child <strong>under</strong>nutrition: global and<br />
regional exposures and health consequencies. Lancet 2008; 371: 243-260<br />
3. Jones G, Steketee RW, Black RE etal. How many child deaths can we prevent this<br />
<strong>year</strong> Lancet 2003; 362: 65-71.<br />
4. Edmond KM, Zandoh C, Quigley MA etal. Delayed breast feed<strong>in</strong>g <strong>in</strong>itiation<br />
<strong>in</strong>creases risk <strong>of</strong> neonatal mortality. Pediatrics 2006; 117: e380-e386.<br />
5. Victora CG, Adair L, Fall C, Hallal PC, Martorell R, Ritcher L and Sachdev HS.<br />
Maternal and child <strong>under</strong>nutrition: Consequences for adult health and human<br />
capital. The Lancet 2008; 371:340-57.<br />
6. Barker DJP, Osmond C, Forsen TJ, Kajantie E, Eriksson JG. Trajectories <strong>of</strong><br />
growth among <strong>children</strong>who have coronary Events as Adults. N Eng J Med 2005;<br />
353:1802-9<br />
7. Satyanarayana K., Naidu AN., Chatterjee B., Rao BSN. Body size and work<br />
output. Am. J. Cl<strong>in</strong>. Nutr. 1977; 30:322-325.<br />
8. National Nutrition Monitor<strong>in</strong>g Bureau: Report <strong>of</strong> Second Repeat Survey – Rural.<br />
NNMB Tech. Rep. No. 18, 1999.<br />
9. National Nutrition Monitor<strong>in</strong>g Bureau. Diet and nutritional status <strong>of</strong> <strong>rural</strong> population.<br />
NNMB Tech. Rep. No.24, National Institute <strong>of</strong> Nutrition (ICMR), Hyderabad, 2006<br />
10. National Family Health Survey 2005-06.<br />
11. M<strong>in</strong>istry <strong>of</strong> Human Resource Development, Government <strong>of</strong> India, National Nutrition<br />
Policy, New Delhi: Department <strong>of</strong> Women and Child Development, 1993.National<br />
Plan <strong>of</strong> action<br />
12. M<strong>in</strong>istry <strong>of</strong> Human Resource Development, Government <strong>of</strong> India, National Plan <strong>of</strong><br />
Action on Nutrition, New Delhi: Food and Nutrition Board, Department <strong>of</strong> Women<br />
and Child Development, 1995.<br />
13. Jelliffee D.B. <strong>Assessment</strong> <strong>of</strong> nutritional status <strong>of</strong> community. WHO Monograph<br />
series No.53, 1966.<br />
14. World Health Organization. Measur<strong>in</strong>g change <strong>in</strong> nutritional status, WHO, Geneva,<br />
1983.<br />
15. WHO Multicentre Growth Reference Study Group. WHO Child Growth Standards<br />
based on length/height, weight and age. Acta Paediatr Suppl 2006; 450:76-85.<br />
16. www.who<strong>in</strong>dia.org/EIP/policy/population...<br />
17. Black RE, L<strong>in</strong>dsay HA, Bhutta ZA, Caulfield LE, Mercedes de Onis, Majid Ezzati,<br />
Col<strong>in</strong> Mathers, Juan Rivera. Meternal and child <strong>under</strong> nutrition: Global and regional<br />
exposures and health consequences. Maternal and child <strong>under</strong> nutrition study<br />
group. The Lancet, 2008; 371:340-357.<br />
18. American Academy <strong>of</strong> Paediatrics. Breast-feed<strong>in</strong>g and the use <strong>of</strong> Human milk<br />
American Academy <strong>of</strong> Paediatrics, Work Group on Breastfeed<strong>in</strong>g. Pediatr 1997;<br />
100:1035-1039.<br />
<strong>Nutritional</strong> <strong>Status</strong> <strong>of</strong>
19. Academy <strong>of</strong> educational development. Recommended feed<strong>in</strong>g and dietary<br />
practices to improve <strong>in</strong>fant and maternal nutrition. L<strong>in</strong>kages – Improv<strong>in</strong>g nutrition<br />
and reproductive health. 1999.<br />
20. The optimal duration <strong>of</strong> exclusive breast-feed<strong>in</strong>g. Report <strong>of</strong> an Expert Consultation,<br />
WHO, Geneva, 2001.<br />
21. UNICEF. Breast feed<strong>in</strong>g facts <strong>of</strong> life. UNICEF (1993a).<br />
22. Dewey KG, He<strong>in</strong>ig MJ, Nommsen LA, Lonnerdal B. Adequacy <strong>of</strong> energy <strong>in</strong>take<br />
among breast-fed <strong>in</strong>fants <strong>in</strong> the DARLING study: relationship to growth velocity,<br />
morbidity and activity levels. Davis Area Research on Lactation, Infant Nutrition<br />
and Growth. J Pediatr.1991; 119:538-47.<br />
<strong>Nutritional</strong> <strong>Status</strong> <strong>of</strong>
TABLES
Table - 1<br />
Particulars <strong>of</strong> Coverage<br />
Particulars<br />
Coverage (n)<br />
Socio-economic particulars (HHs) 400<br />
Under 5 <strong>year</strong> <strong>children</strong> for anthropometry<br />
410<br />
(Boys 240 , Girls 170)<br />
Children below 12 months 101<br />
Children 12-35 months 173<br />
Children 36-59 months 136<br />
Spot test<strong>in</strong>g <strong>of</strong> HHs salt for iod<strong>in</strong>e 400<br />
Infant & young child Feed<strong>in</strong>g Practices<br />
Mothers with
Table - 2<br />
Socio-economic Pr<strong>of</strong>ile <strong>of</strong> the Households <strong>of</strong> Index <strong>children</strong><br />
Community<br />
Type <strong>of</strong> Family<br />
Family Size<br />
Particulars<br />
Percent<br />
n 400<br />
Scheduled Tribe 7.5<br />
Scheduled Caste 18.5<br />
Backward Community 42.5<br />
Others 31.5<br />
Nuclear 44.7<br />
Extended Nuclear 21.3<br />
Jo<strong>in</strong>t 34.0<br />
1 -4 26.8<br />
5 – 9 56.2<br />
≥ 10 17.0<br />
Average Family Size 6.6<br />
Literacy status <strong>of</strong> Father<br />
Literacy status <strong>of</strong> Mother<br />
Illiterate 16.8<br />
1 – 5 Class 13.5<br />
6 – 7 Class 6.5<br />
8 – 10 Class 33.4<br />
Intermediate 18.3<br />
Graduate & above 11.5<br />
Illiterate 44.6<br />
Read & write 0.3<br />
1 – 5 Class 20.5<br />
6 – 7 Class 3.3<br />
8 – 10 Class 19.8<br />
Intermediate 8.0<br />
Graduate & above 3.5<br />
(Contd….)<br />
<strong>Nutritional</strong> <strong>Status</strong> <strong>of</strong>
Table – 2 (Contd…)<br />
Socio-economic Pr<strong>of</strong>ile <strong>of</strong> the Households <strong>of</strong> Index <strong>children</strong><br />
Particulars<br />
Percent<br />
n 400<br />
Extent <strong>of</strong> HH landhold<strong>in</strong>g (Acres)<br />
Nil 41.4<br />
Marg<strong>in</strong>al farmers
Table - 3<br />
Physical facilities <strong>of</strong> the Households<br />
Type <strong>of</strong> house<br />
Particulars<br />
Source <strong>of</strong> Dr<strong>in</strong>k<strong>in</strong>g Water<br />
Type <strong>of</strong> Cook<strong>in</strong>g Fuel<br />
Percent<br />
n 400<br />
Kutcha 21.3<br />
Semi Pucca 55.4<br />
Pucca 23.3<br />
Open Well 4.0<br />
Tube Well 96.0<br />
Firewood 96.5<br />
Biogas 1.0<br />
LPG 2.5<br />
Household electricity present 18.0<br />
Sanitary Latr<strong>in</strong>e<br />
Present and <strong>in</strong> use 15.8<br />
Present and not <strong>in</strong> use 4.0<br />
Absent 80.2<br />
Separate Kitchen Present 35.8<br />
<strong>Nutritional</strong> <strong>Status</strong> <strong>of</strong>
Table – 4<br />
Distribution (%) <strong>of</strong> HHs accord<strong>in</strong>g to use <strong>of</strong> Iodized salt and iod<strong>in</strong>e content<br />
Type <strong>of</strong> salt used<br />
Iod<strong>in</strong>e content<br />
Particulars<br />
Percent<br />
n 400<br />
Powdered salt 46.2<br />
Crystal Salt 16.8<br />
Rock salt 19.0<br />
Free-flow<strong>in</strong>g 18.0<br />
0 ppm 45.2<br />
Table - 6<br />
Particulars <strong>of</strong> last pregnancy <strong>of</strong> mothers <strong>of</strong> < 6 months <strong>children</strong><br />
Particulars<br />
Percent<br />
n 26<br />
Undergone Antenatal check-up (ANC)<br />
Yes 69.2<br />
No 30.8<br />
Total number <strong>of</strong> ANCs<br />
One 11.5<br />
Two 38.5<br />
Three 15.4<br />
Four 3.8<br />
Not availed ANC 30.8<br />
Undergone First ANC at (Weeks <strong>of</strong> gestation)<br />
≤ 8 weeks 3.8<br />
9- 12 weeks 11.5<br />
13- 16 weeks 34.7<br />
17-20 weeks 7.7<br />
>20 weeks 11.5<br />
Not availed ANC 30.8<br />
Place <strong>of</strong> ANC<br />
AWC 3.8<br />
PHC/CHC 30.8<br />
Taluk/Dist.hospital 3.8<br />
Private Cl<strong>in</strong>ic 30.8<br />
Not availed ANC 30.8<br />
ANC conducted by<br />
Medical Officer 38.4<br />
Pvt. Doctor 30.8<br />
Not availed ANC 30.8<br />
( Contd..)<br />
<strong>Nutritional</strong> <strong>Status</strong> <strong>of</strong>
Table – 6 (Contd…)<br />
Particulars <strong>of</strong> last pregnancy <strong>of</strong> mothers <strong>of</strong> < 6 months <strong>children</strong><br />
Particulars<br />
Percent<br />
Components <strong>of</strong> ANC* n = 26<br />
Physical Exam<strong>in</strong>ation 69.2<br />
Weight Record<strong>in</strong>g 65.4<br />
Ur<strong>in</strong>e Test 65.4<br />
Haemoglob<strong>in</strong> Estimation 65.4<br />
Blood pressure measurement 65.4<br />
Health & Nutrition advise given dur<strong>in</strong>g ANC<br />
Yes 61.5<br />
No 7.7<br />
Not availed ANC 30.8<br />
If yes, what advise*<br />
To attend for regular checkups 61.5<br />
To consume more GLVs 61.5<br />
To consume more Vegetables & fruits 61.5<br />
To take IFA tablets for 100 days 61.5<br />
Others 7.7<br />
Reasons for not avail<strong>in</strong>g ANCs*<br />
Not aware <strong>of</strong> the need 15.3<br />
No faith 3.8<br />
No ANC held <strong>in</strong> the village 7.7<br />
Inconvenient tim<strong>in</strong>gs 3.8<br />
TT Immunization receiv<strong>in</strong>g<br />
Yes 88.5<br />
No 11.5<br />
If yes, No. <strong>of</strong> doses<br />
One dose -<br />
Two doses 88.5<br />
Not received 11.5<br />
Reasons for not receiv<strong>in</strong>g TT *<br />
Not aware <strong>of</strong> the need 11.5<br />
* Multiple responses ( Contd..)<br />
<strong>Nutritional</strong> <strong>Status</strong> <strong>of</strong>
Table – 6 (Contd…)<br />
Particulars <strong>of</strong> last pregnancy <strong>of</strong> mothers <strong>of</strong> < 6 months <strong>children</strong><br />
Particulars<br />
Percent<br />
n 26<br />
Received IFA tablets<br />
Yes 80.8<br />
No 19.2<br />
IFA tablets received from<br />
ANM 11.5<br />
AWW 57.8<br />
Private Doctor 11.5<br />
Not received 19.2<br />
No. <strong>of</strong> IFA tablets received<br />
30-60 26.9<br />
60-90 26.9<br />
≥90 26.9<br />
Not received 19.2<br />
No. <strong>of</strong> IFA tablets consumed<br />
Table –7<br />
Particulars <strong>of</strong> last Delivery <strong>of</strong> mothers <strong>of</strong>
Table - 8<br />
Distribution (%) <strong>of</strong> < 60 months <strong>children</strong> accord<strong>in</strong>g <strong>of</strong> Birth order<br />
Birth order<br />
Percent<br />
n 410<br />
First 38.0<br />
Second 31.0<br />
Third 17.3<br />
Fourth 6.6<br />
Fifth and above 7.1<br />
Table - 9<br />
Distribution (%) <strong>of</strong> < 60 months <strong>children</strong> hav<strong>in</strong>g sibl<strong>in</strong>gs accord<strong>in</strong>g to<br />
<strong>in</strong>terval between last two births<br />
Interval between last two births(months)<br />
Percent<br />
n 254<br />
Table - 10<br />
Distribution (%) <strong>of</strong>
Table - 11<br />
Distribution (%) <strong>of</strong> <strong>in</strong>fants ( 6 months NA 33.4<br />
Not yet started 100.0 42.6<br />
Type <strong>of</strong> complementary food currently be<strong>in</strong>g given*<br />
Cow/buffalo milk NA 53.3<br />
Formula milk NA -<br />
Commercial baby foods NA 1.3<br />
Home made Semi-solids NA 26.7<br />
Home made solids NA 44.0<br />
Not yet started 100.0 42.6<br />
* Multiple responses<br />
<strong>Nutritional</strong> <strong>Status</strong> <strong>of</strong>
Table - 12<br />
Distribution (%) <strong>of</strong> 6-11 months Children accord<strong>in</strong>g to Feed<strong>in</strong>g Practices<br />
Feed<strong>in</strong>g Practices<br />
Percent<br />
n 75<br />
Foods generally <strong>in</strong>cluded <strong>in</strong> home made complementary foods*<br />
Cereals & Millets 49.3<br />
Pulses 36.0<br />
Green Leafy Vegetables 9.3<br />
Other vegetables 6.7<br />
Roots & tubers 5.3<br />
Fruits 22.7<br />
Milk & milk products 49.3<br />
Eggs 9.3<br />
Fats & Oils 38.7<br />
Number <strong>of</strong> complementary feeds per day<br />
2 13.3<br />
3 28.0<br />
4 16.0<br />
Not yet started 42.7<br />
Mode <strong>of</strong> complementary feed<strong>in</strong>g<br />
Mother with spoon 13.3<br />
Mother with hand 37.3<br />
Self by hand 6.7<br />
Not yet started 42.7<br />
Supervision <strong>of</strong> complementary feed<strong>in</strong>g by<br />
Mother 57.3<br />
Not yet started 42.7<br />
* Multiple responses<br />
<strong>Nutritional</strong> <strong>Status</strong> <strong>of</strong>
Table - 13<br />
Distribution (%) <strong>of</strong> 12-35 months Children accord<strong>in</strong>g to Feed<strong>in</strong>g Practices<br />
Feed<strong>in</strong>g Practices<br />
Percent<br />
n 173<br />
Children solely breast fed -<br />
Children currently Breast fed + complementary feed<strong>in</strong>g 68.8<br />
Weaned 31.2<br />
Age <strong>of</strong> <strong>in</strong>itiation complementary feed<strong>in</strong>g<br />
At 4 months 1.2<br />
At 5 months 9.8<br />
At 6 months 12.7<br />
At 7 months 61.8<br />
At 8 months 14.5<br />
Not yet started 0.0<br />
Type <strong>of</strong> food currently be<strong>in</strong>g given*<br />
Cow/buffalo milk 98.8<br />
Formula milk 0.6<br />
Commercial baby food 0.6<br />
Home made semi-solids 46.2<br />
Home made solids 98.3<br />
Not yet started 0.0<br />
Foods generally <strong>in</strong>cluded <strong>in</strong> home made foods*<br />
Cereals & Millets 100.0<br />
Pulses & legumes 99.4<br />
Green Leafy Vegetables 99.4<br />
Other Vegetables 97.7<br />
Roots & Tubers 97.7<br />
Fruits 86.7<br />
Milk & milk products 97.7<br />
Eggs 13.9<br />
Flesh foods 7.5<br />
Fats & Oils 95.4<br />
Not yet started CF 0.0<br />
* Multiple responses ( Contd….)<br />
<strong>Nutritional</strong> <strong>Status</strong> <strong>of</strong>
Table – 13 (Contd…)<br />
Distribution (%) <strong>of</strong> 12-35 months Children<br />
Accord<strong>in</strong>g to Feed<strong>in</strong>g (CF) Practices<br />
Feed<strong>in</strong>g Practices<br />
Number <strong>of</strong> complementary feeds per day<br />
Mode <strong>of</strong> feed<strong>in</strong>g complementary food<br />
Supervision <strong>of</strong> complementary feed<strong>in</strong>g by<br />
Percent<br />
n 173<br />
≤2 28.3<br />
3 39.3<br />
≥4 32.4<br />
Not yet started CF 0.0<br />
Mother with hand 48.6<br />
Self by hand 51.4<br />
Not yet started CF 0.0<br />
Mother 99.4<br />
Grand parents 0.6<br />
Not yet started CF 0.0<br />
<strong>Nutritional</strong> <strong>Status</strong> <strong>of</strong>
Table – 14<br />
Distribution (%) <strong>of</strong> mothers <strong>of</strong> 0- 59 months Children accord<strong>in</strong>g to<br />
Care <strong>of</strong> the child and personal Hygiene<br />
Particulars<br />
Care <strong>of</strong> the child when mother goes out for work<br />
Age group (months)<br />
Table – 15<br />
Prevalence (%) <strong>of</strong> the Morbidity among 0- 59 months <strong>children</strong> dur<strong>in</strong>g<br />
previous fortnight by age groups<br />
Age Group<br />
(months)<br />
n Fever Diarrhoea ARI<br />
At least one<br />
morbidity<br />
0-5 26 3.8 - - 3.8<br />
6-11 75 14.7 14.7 4.0 26.7<br />
12-23 78 11.5 9.0 2.6 17.9<br />
24-35 95 18.0 10.5 2.1 22.1<br />
36-47 75 20.0 12.0 4.0 25.3<br />
48-59 61 6.6 9.8 1.6 16.4<br />
Pooled 410 14.1 10.5 2.7 20.7<br />
<strong>Nutritional</strong> <strong>Status</strong> <strong>of</strong>
Table – 16<br />
Distribution (%) <strong>of</strong> mothers <strong>of</strong> 0- 59 months Children accord<strong>in</strong>g to<br />
Care <strong>of</strong> the child dur<strong>in</strong>g Sickness<br />
Particulars<br />
Personnel generally consulted dur<strong>in</strong>g illness <strong>of</strong> the child<br />
Morbidity dur<strong>in</strong>g previous fortnight<br />
Age group (months)<br />
Table - 17<br />
Participation (%) <strong>in</strong> ICDS supplementation programme<br />
(6- 59 months <strong>children</strong>)<br />
Particulars<br />
Age group (months)<br />
6-35 36-59 6-59<br />
N 248 136 384<br />
Participat<strong>in</strong>g<br />
Regular 23.0 72.8 40.7<br />
Irregular 38.3 24.3 33.3<br />
Not participat<strong>in</strong>g 38.7 2.9 26.0<br />
<strong>Nutritional</strong> <strong>Status</strong> <strong>of</strong>
Table -18<br />
Distribution (%) <strong>of</strong> 12- 24 months <strong>children</strong> accord<strong>in</strong>g to Coverage for<br />
Immunization <strong>under</strong> UIP<br />
Immunization Particulars<br />
Percent<br />
n 78<br />
Received all vacc<strong>in</strong>es ( Fully Immunized) 92.3<br />
Partially immunized 1.3<br />
Not immunized 6.4<br />
Reasons for no / <strong>in</strong>complete immunization<br />
Source <strong>of</strong> <strong>in</strong>formation<br />
BCG 98.6<br />
DPT1 98.6<br />
DPT2 98.6<br />
DPT3 98.6<br />
OPV1 97.3<br />
OPV2 97.3<br />
OPV3 97.3<br />
Measles 97.3<br />
Not <strong>of</strong>fered 7.7<br />
Fully immunized 92.3<br />
Mother & child protection card 38.5<br />
Immunization card 6.4<br />
Parents 23.1<br />
Anganwadi record 25.6<br />
Not immunized 6.4<br />
<strong>Nutritional</strong> <strong>Status</strong> <strong>of</strong>
Table - 19<br />
Distribution (%) <strong>of</strong> 9- 59 months Children Accord<strong>in</strong>g to receipt <strong>of</strong> massive<br />
dose vitam<strong>in</strong> A dur<strong>in</strong>g previous one <strong>year</strong><br />
Particulars<br />
Receipt <strong>of</strong> massive dose vitam<strong>in</strong> A<br />
No. <strong>of</strong> doses <strong>of</strong> vitam<strong>in</strong> A<br />
Place <strong>of</strong> adm<strong>in</strong>istration<br />
Age group (months)<br />
9-17 18-35 36-59 9-59<br />
N 75 146 136 357<br />
Yes 90.7 97.9 98.5 96.6<br />
No 5.3 1.4 1.5 2.3<br />
Do not remember 4.0 0.7 0.0 1.1<br />
One 90.7 0.7 0.0 19.3<br />
Two NA 97.2 98.5 77.3<br />
Not received 5.3 1.4 1.5 2.3<br />
Do not remember 4.0 0.7 0.0 1.1<br />
Home 0.0 1.4 0.7 0.8<br />
AWC 90.7 96.5 97.8 95.8<br />
Not received/do not remember 9.3 2.1 1.5 3.4<br />
Massive dose vitam<strong>in</strong> A adm<strong>in</strong>istered by<br />
AWW 41.3 47.9 47.1 46.2<br />
ANM 49.3 50.0 51.4 50.4<br />
LHV 0.0 0.0 0.0 0.0<br />
Not received/do not remember 9.3 2.1 1.5 3.4<br />
Reasons for not receiv<strong>in</strong>g/<strong>in</strong>complete massive dose vitam<strong>in</strong> A<br />
Unaware <strong>of</strong> need 0.0 0.0 0.0 0.0<br />
Not <strong>of</strong>fered 2.7 0.7 0.0 0.9<br />
Time or place not convenient 2.7 1.4 1.5 1.7<br />
Mothers was busy 0.0 0.0 0.0 0.0<br />
Others 0.0 0.0 0.0 0.0<br />
<strong>Nutritional</strong> <strong>Status</strong> <strong>of</strong>
Table - 20<br />
Distribution (%) <strong>of</strong> 12-59 months Children accord<strong>in</strong>g<br />
to receipt <strong>of</strong> Iron & folic acid tablets<br />
Particulars<br />
Received IFA tablets<br />
IFA tablets received from<br />
Number <strong>of</strong> IFA tablets received<br />
No. <strong>of</strong> IFA tablets consumed<br />
Age group (months)<br />
12-35 36-59 12-59<br />
n 173 136 309<br />
Yes 26.6 46.3 35.3<br />
No 73.4 53.7 64.7<br />
ANM 1.2 - 0.6<br />
AWW 25.4 46.3 34.7<br />
Not received 73.4 53.7 64.7<br />
Table - 21<br />
Prevalence (%) <strong>of</strong> nutritional deficiency signs among 0 - 59 months<br />
<strong>children</strong><br />
Cl<strong>in</strong>ical signs<br />
Age groups (Months)<br />
0-11 12-35 36-59 0-59<br />
No <strong>of</strong> <strong>children</strong> exam<strong>in</strong>ed 101 173 136 410<br />
NAD 100.0 100.0 99.3 99.8<br />
Bitot spots - - 0.7 0.2<br />
NAD: No Abnormality Detected<br />
<strong>Nutritional</strong> <strong>Status</strong> <strong>of</strong>
n<br />
Table -22<br />
Mean Height and weight <strong>of</strong> 0-59 months Children by age group and gender<br />
BOYS<br />
GIRLS<br />
Age<br />
Height (cm) Weight (kg) n Height (cm) Weight (kg)<br />
(Months)<br />
Mean ± SD Mean ± SD Mean ± SD Mean ± SD<br />
1 49.1 0.00 2.7 0.00
Table - 23<br />
Distribution (%) <strong>of</strong> 0-59 months Children accord<strong>in</strong>g to nutritional status by<br />
SD Classification: By Age group<br />
Underweight (Weight for Age)<br />
Age<br />
Group<br />
(months)<br />
n<br />
Severe<br />
(
Table -24<br />
Distribution (%) <strong>of</strong> 0- 59 months Children accord<strong>in</strong>g to nutritional status by<br />
SD Classification*: By Gender<br />
<strong>Nutritional</strong> <strong>Status</strong><br />
Gender<br />
n<br />
Table -25<br />
Distribution (%) <strong>of</strong> 0- 59 months Children by <strong>Nutritional</strong> status accord<strong>in</strong>g to<br />
SD Classification: By Socio-demographic variables<br />
Particulars<br />
n<br />
Weight for age Height for age Weight for height<br />
Table -25 (Contd...)<br />
Distribution (%) <strong>of</strong> 0- 59 months Children by <strong>Nutritional</strong> status accord<strong>in</strong>g to<br />
SD Classification: By Socio-demographic variables<br />
Particulars<br />
n<br />
Weight for age Height for age Weight for height<br />
Table – 25 (Contd…)<br />
Distribution (%) <strong>of</strong> 0- 59 months Children by <strong>Nutritional</strong> status accord<strong>in</strong>g to<br />
SD Classification: By Socio-demographic variables<br />
Weight for age Height for age Weight for height<br />
Particulars n