Seasonality of the Pacific decadal oscillation - Climate Prediction ...
Seasonality of the Pacific decadal oscillation - Climate Prediction ...
Seasonality of the Pacific decadal oscillation - Climate Prediction ...
Create successful ePaper yourself
Turn your PDF publications into a flip-book with our unique Google optimized e-Paper software.
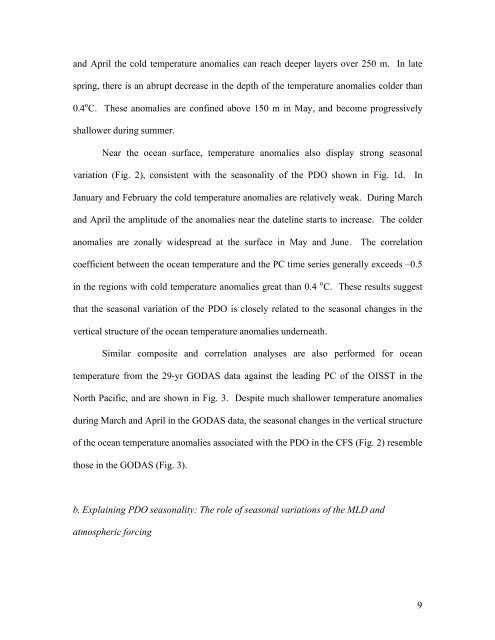
and April <strong>the</strong> cold temperature anomalies can reach deeper layers over 250 m. In late<br />
spring, <strong>the</strong>re is an abrupt decrease in <strong>the</strong> depth <strong>of</strong> <strong>the</strong> temperature anomalies colder than<br />
0.4 o C. These anomalies are confined above 150 m in May, and become progressively<br />
shallower during summer.<br />
Near <strong>the</strong> ocean surface, temperature anomalies also display strong seasonal<br />
variation (Fig. 2), consistent with <strong>the</strong> seasonality <strong>of</strong> <strong>the</strong> PDO shown in Fig. 1d. In<br />
January and February <strong>the</strong> cold temperature anomalies are relatively weak. During March<br />
and April <strong>the</strong> amplitude <strong>of</strong> <strong>the</strong> anomalies near <strong>the</strong> dateline starts to increase. The colder<br />
anomalies are zonally widespread at <strong>the</strong> surface in May and June. The correlation<br />
coefficient between <strong>the</strong> ocean temperature and <strong>the</strong> PC time series generally exceeds –0.5<br />
in <strong>the</strong> regions with cold temperature anomalies great than 0.4 o C. These results suggest<br />
that <strong>the</strong> seasonal variation <strong>of</strong> <strong>the</strong> PDO is closely related to <strong>the</strong> seasonal changes in <strong>the</strong><br />
vertical structure <strong>of</strong> <strong>the</strong> ocean temperature anomalies underneath.<br />
Similar composite and correlation analyses are also performed for ocean<br />
temperature from <strong>the</strong> 29-yr GODAS data against <strong>the</strong> leading PC <strong>of</strong> <strong>the</strong> OISST in <strong>the</strong><br />
North <strong>Pacific</strong>, and are shown in Fig. 3. Despite much shallower temperature anomalies<br />
during March and April in <strong>the</strong> GODAS data, <strong>the</strong> seasonal changes in <strong>the</strong> vertical structure<br />
<strong>of</strong> <strong>the</strong> ocean temperature anomalies associated with <strong>the</strong> PDO in <strong>the</strong> CFS (Fig. 2) resemble<br />
those in <strong>the</strong> GODAS (Fig. 3).<br />
b. Explaining PDO seasonality: The role <strong>of</strong> seasonal variations <strong>of</strong> <strong>the</strong> MLD and<br />
atmospheric forcing<br />
9


