Seasonality of the Pacific decadal oscillation - Climate Prediction ...
Seasonality of the Pacific decadal oscillation - Climate Prediction ...
Seasonality of the Pacific decadal oscillation - Climate Prediction ...

You also want an ePaper? Increase the reach of your titles
YUMPU automatically turns print PDFs into web optimized ePapers that Google loves.
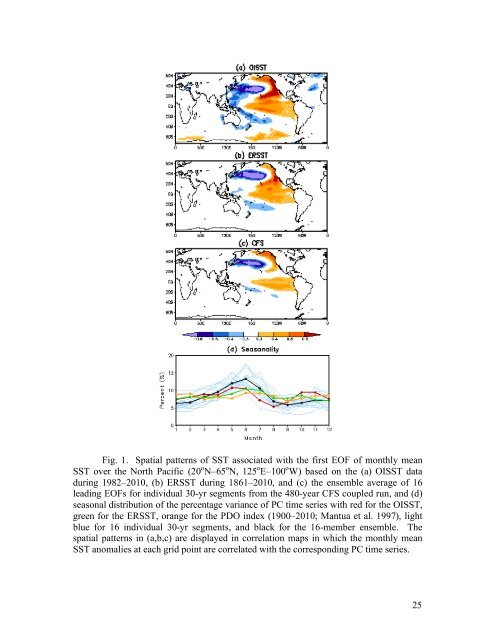
Fig. 1. Spatial patterns <strong>of</strong> SST associated with <strong>the</strong> first EOF <strong>of</strong> monthly mean<br />
SST over <strong>the</strong> North <strong>Pacific</strong> (20 o N–65 o N, 125 o E–100 o W) based on <strong>the</strong> (a) OISST data<br />
during 1982–2010, (b) ERSST during 1861–2010, and (c) <strong>the</strong> ensemble average <strong>of</strong> 16<br />
leading EOFs for individual 30-yr segments from <strong>the</strong> 480-year CFS coupled run, and (d)<br />
seasonal distribution <strong>of</strong> <strong>the</strong> percentage variance <strong>of</strong> PC time series with red for <strong>the</strong> OISST,<br />
green for <strong>the</strong> ERSST, orange for <strong>the</strong> PDO index (1900–2010; Mantua et al. 1997), light<br />
blue for 16 individual 30-yr segments, and black for <strong>the</strong> 16-member ensemble. The<br />
spatial patterns in (a,b,c) are displayed in correlation maps in which <strong>the</strong> monthly mean<br />
SST anomalies at each grid point are correlated with <strong>the</strong> corresponding PC time series.<br />
25