RAMAN µ-SPECTROMETRY, A UNIQUE TOOL FOR ON-SITE ...
RAMAN µ-SPECTROMETRY, A UNIQUE TOOL FOR ON-SITE ...
RAMAN µ-SPECTROMETRY, A UNIQUE TOOL FOR ON-SITE ...

You also want an ePaper? Increase the reach of your titles
YUMPU automatically turns print PDFs into web optimized ePapers that Google loves.
Mater. Res. Soc. Symp. Proc. Vol. 852 © 2005 Materials Research Society<br />
OO8.3.1<br />
<strong>RAMAN</strong> µ-<strong>SPECTROMETRY</strong>, A <strong>UNIQUE</strong> <strong>TOOL</strong> <strong>FOR</strong> <strong>ON</strong>-<strong>SITE</strong> ANALYSIS<br />
AND IDENTIFICATI<strong>ON</strong> OF ANCIENT CERAMICS AND GLASSES<br />
Ph. Colomban<br />
Laboratoire de Dynamique, Interactions et Réactivité (LADIR),<br />
UMR 7075, Centre National de la Recherche Scientifique & Université Pierre & Marie Curie,<br />
2 rue Henry-Dunant, 94320 Thiais, France<br />
ABSTRACT<br />
Raman micro-spectroscopy allows remote, non-destructive analysis of materials. Our<br />
laboratory was among the first to apply this technique to frescoes, oil and parchment painting.<br />
For five years we have focused our efforts on horn, ivory, tortoise shell and ancient ceramics and<br />
glasses. Crystalline and amorphous phases can be identified in both body and surface layer,<br />
including the glaze/glass-coloring nanosized pigments (e.g. in lustre ware, the first nano-optic<br />
device). Recent generation instruments are portable, which allows for on-site examination, for<br />
example, in a museum. In nanostructured, nanocrystalline/amorphous silicate glasses, glazes and<br />
most of their pigments, Raman parameters and their multivariable analysis are used to recognize<br />
compositions as well as to classify them as a function of their processing. This overview<br />
addresses the procedure, choice of the exciting radiation, control of the Raman resonance, data<br />
processing and extraction of relevant parameters such as the index of polymerization and<br />
different signatures that may be characteristic of specific glazes and pigments. Didactic examples<br />
are chosen among pottery that representative of the different production technologies used in the<br />
Roman, European (Medici, Meissen, Chantilly, Mennecy, Saint-Cloud, Sèvres), Islamic (Iznik,<br />
Kütahya, Safavid) and Asian (Vietnam) worlds.<br />
INTRODUCTI<strong>ON</strong><br />
Leading experts generally base their certification of ancient artifacts on stylistic analysis and<br />
on a personal feeling involving the five senses. More objective proof is mandatory for<br />
identification and authentication purposes. Scientists bring a “neutral” and scientific appreciation<br />
; they can be either an interface or an actor in the knowledge and conservation of artwork.<br />
Different technologies will often give products of very similar outward appearances from the<br />
visual and sensory points of view, but completely different in their micro/nanostructure.<br />
However, interesting information on the processing remains written in the sample, and a nondestructive<br />
analysis of the microstructure for ceramics and nanostructure for glasses and enamels<br />
offers a way to identify them and, sometimes, to date ancient artifacts. Salient features can be<br />
thus extracted from bodies, glazes and pigments from different production covering the history of<br />
the ceramic and glass industries. For instance, when an outstanding innovation was made, as for<br />
instance the first translucent ceramics, the first blue or red underglaze décor, lustre, specific<br />
coloured enamel among any others, then other places of ceramic production tried to develop<br />
imitations that met for the visual criteria. However, the lack of knowledge of technical details of<br />
the process leads, in many cases, to a specific new technology.
OO8.3.2<br />
Different Raman signatures are obtained if different technologies were applied to the same<br />
starting batch or if a given technology was applied to raw materials processed differently [1] ;<br />
hence, the technique produces very interesting information on the knowledge of the technological<br />
relationship between different places of production [1]. In addition, it helps to discriminate<br />
between a genuine and a copy. Some artworks have been the subject of much attention and<br />
restoration/modifications are rarely documented. Raman technique provides a quick<br />
indentification of the materials used in the restoration. Finally, as an optical method, Raman<br />
analysis can be performed without any contact with the artifact, which suppresses any risk of<br />
deleterious action. Furthermore, the possibility to perform on-site study is now an important<br />
requirement. Our laboratory was one of the first to apply this technique to pigments used in<br />
frescoes, oil and parchment paintings [2-6]. We have focused our efforts on ancient ceramics and<br />
glasses [1,7-16], tortoise shell [17], ivory and its imitation/alternatives (horn, bones and plastics)<br />
[18] and textiles [19]. In this review we will address the procedure and the know-how of the atlaboratory<br />
and on-site analysis of ancient ceramic and glass artifacts using Raman micro- and<br />
macrospectroscopy.<br />
The Raman effect<br />
Before addressing the technique at hand, it seems appropriate to summarize Raman historical<br />
and technical background. Raman and Krishnan made the first experimental observation of<br />
inelastic light scattering by matter in 1928, with sunlight as a source and human eye as a detector<br />
[20]. Quantitative measurements were performed a few months later on solids, in France and<br />
Germany. The theoretical prediction went back to 1922/23 by Brillouin and Smekal. Placzek<br />
gave in 1924 a semi-classical theory of the Raman effect. In fact, Raman spectroscopy remained<br />
without interest for decades due to the lack of an efficient monochromatic source and “good”<br />
detectors. Raman spectroscopy was born again with the invention and availability of the laser in<br />
the sixties.<br />
Through recent years, a considerable number of instrumental developments were made:<br />
i) The use of various wavelengths for sample illumination, from U.V. (∼300nm) to IR<br />
(1064nm), became possible thanks to the laser miniaturization and the increasing<br />
sensitivity of CCD matrix detectors. Thus progress allowed for the development of<br />
compact and portable instruments.<br />
ii) Microscopes and optic fiber heads allow wide solid angle and remote collection of the<br />
iii)<br />
scattered light, with improved geometrical resolution (confocal setting).<br />
The use of high-quality gratings and holographic "notch" filters (a prefiltering device with<br />
nil effective transmission in a narrow spectral domain centered on the exciting laser<br />
wavelength) enhances the sensitivity.<br />
Since Raman scattering involves visible radiation, the spatial distribution of a given<br />
heterogeneous material may be obtained by means of optical methods. Mapping or imaging of an<br />
area can be achieved by a step-by-step scanning of the sample, with a finely focused laser beam<br />
(>~1µm 2 ). Raman spectra fitting procedures then allow for the reconstruction of various maps<br />
showing, for instance, the composition, the crystallinity and other properties of the materials<br />
[21].
OO8.3.3<br />
The Raman effect and the sensitivity of the method<br />
The interaction of matter with electromagnetic radiation leads to elastic (the so-called<br />
Rayleigh line) and inelastic (Raman, wavenumber ≥ 5cm -1 , and Brillouin, wavenumber < 1cm -1 )<br />
scattering. The Raman effect results from the modulation of the exciting electromagnetic<br />
radiation by the optical vibrations and/or rotations of the atoms or molecules. The Raman<br />
frequencies are measured with respect to that of the excitation (I o , ν o ), and they are usually<br />
converted into wavenumber (cm -1 ) unit: ν = 1/λ = ν/c (c, velocity of the light). The intensity of<br />
the Raman scattering is given by the following equation:<br />
4<br />
ν 0<br />
2<br />
I R = I o K e0αe s dΩ (2)<br />
where α is the scattering tensor, K a constant, e o and e s the unit vectors defining the directions<br />
of the electric field of the exciting and scattered lights and dΩ, the collection solid angle. It is<br />
important to note that if the energy of the excitation ( ν 0 ) is high enough to reach electronic<br />
levels of the material, in other words if the material is colored, near-resonant or resonant, Raman<br />
scattering (or fluorescence) occurs, and the scattered light intensity is enhanced (Fig. 1).<br />
Resonance can increase the intensity up to 1000 times and concerns mainly the symmetric<br />
vibrational modes and their overtones and combinations [15,16]. Furthermore, the penetration<br />
depth of the laser light is drastically reduced to few tens of nanometer so that only the surface<br />
layer is analyzed. Thus, this method is particularly well suited to study pigments (powdered gems<br />
and synthetic pigments), even in the form of rare nanocrystals dispersed in a color-less glassy or<br />
crystalline matrix.<br />
Raman cross-section could vary many orders of magnitude as a function of the nature of the<br />
bond and the exciting wavelength used : ionic compounds (e.g. alumina, mullite) are very weak<br />
scatterers ; on the other hand, covalent-bonded compounds (quartz, rutile, silicate, zirconia,<br />
carbon, …), especially those involving high Z number elements give intense Raman spectra. The<br />
stronger spectra are obtained in resonance conditions, when the exciting wavelength is close to<br />
the electronic absorption energy range. In the latter case, harmonics (2ν, 3ν, etc.) and<br />
combinations of the main symmetric stretching (ν) and bending (δ) show significant intensities as<br />
shown on the lapis lazuli spectrum (Fig. 1a).<br />
EXAMINATI<strong>ON</strong> OF SAMPLES<br />
Raman spectroscopy is an optical technique and can therefore be performed through different<br />
optical devices: camera lenses, microscope, and remote fiber optic probe among others. In this<br />
way the technique benefits from the educated eyes of the scholar, and the Raman expert takes<br />
advantage of his visual expertise. The size of the laser spot determines the analyzed surface in<br />
one shot : 5000 µm 2 are illuminated, typically in a macro configuration (this size mediates the<br />
information but increases the possibility that the analyzed zone contains fluorescence points<br />
hindering the observation of a clear Raman signature), while the laser spot is reduced to ~ 1µm 2<br />
for measurements with high magnification microscope objectives (i.e. smaller than most of the<br />
ceramic grains). Specific analysis of over painting décor, glaze, underglaze décor and glaze/body<br />
interface (Fig. 1) can be made from the top (Fig. 2a), using long focus microscope objectives and<br />
confocal set-up to control the light penetration. Body analysis can be performed on glazed or
OO8.3.4<br />
unglazed regions (rim, bottom or support spurs). The automatic mapping of some areas helps to<br />
detect process- or raw materials-characteristic phases. The choice of the exciting radiation must<br />
be optimized as a function of the color of the analyzed pigment. Experimental details on<br />
laboratory and on-site procedures and on the reliability of the technique have been provided in<br />
ref. [9]. There is no need to polish the sample. Pristine surfaces, or a fresh fracture, are more<br />
convenient. In many cases, liquids used for polishing or impregnation give rise to a strong<br />
fluorescence, which overlaps and mask the Raman effect. However, after a few tens of minutes<br />
of illumination with 1-20 mW/µm 2 of a violet/blue laser line, the ceramic/glass surface may be<br />
almost totally cleaned of the organic residues at the origin of the fluorescence.<br />
Intensity / arbitr. units<br />
260<br />
δ<br />
285<br />
548<br />
ν<br />
δ+ν<br />
583<br />
808<br />
1096<br />
2ν<br />
δ+2ν<br />
1130 1644<br />
3ν<br />
1355 1904<br />
2190<br />
4ν<br />
λ = 532nm<br />
2740<br />
5ν<br />
2450<br />
3288<br />
3000<br />
6ν<br />
a)<br />
Intensity / arbitr. units<br />
195<br />
1000 2000 3000<br />
Wavenumber / cm -1<br />
M<br />
F<br />
510<br />
965 1160<br />
Q Sèvres<br />
465<br />
965<br />
Meissen<br />
M<br />
1130<br />
W<br />
St Cloud 968<br />
b)<br />
0 500 1000<br />
W avenum ber / cm -1<br />
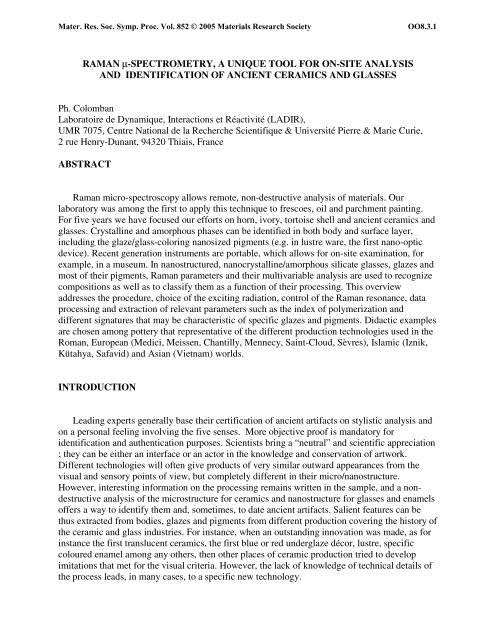
Figure 1 : (a) Lapis-lazuli containing Lâjvardina glaze of Islamic type (resonance Raman<br />
spectrum with green excitation : note the various harmonics and combination bands of S n<br />
chromophores, after [15]) and (b) representative Raman spectra recorded on the unglazed region<br />
of the porcelain body of Sèvres (two spectra recorded in different places) and Meissen hardpastes<br />
and Saint-Cloud soft-paste (Q: quartz, M: mullite, F: feldspar and W: wollastonite, after<br />
[12]).
OO8.3.5<br />
Water-cooled ion plasma lasers (Ar + , Kr + ) produce a variety of exciting wavelengths from<br />
UV to red but must be used in a laboratory because of their large size and weight ; He-Ne and<br />
diode (some miniaturized, air-cooled) lasers deliver red lines, and YAG air-cooled lasers deliver<br />
multiple green to IR lines ; both latter types of lasers are convenient for on-site measurements.<br />
Although colorless inorganic materials can receive a few tens of mW/µm 2 without any induced<br />
heating, the power of illumination used to analyze colored materials must be controlled precisely:<br />
rarely, a few µW/µm 2 or less could heat the material under the laser spot. For instance<br />
transformation of FeO (wustite) or Fe 3 O 4 (magnetite) into α-Fe 2 O 3 (hematite) is currently<br />
observed because of local heating and subsequent oxidation. This point is also very important for<br />
corrosion studies of metallic artifacts [22].<br />
Spectrometers<br />
Large-size, high-resolution instruments. This type of multichannel spectrometer is equipped<br />
with a double monochromator as a filter and a liquid nitrogen-cooled CCD matrix (2000 x 800<br />
pixels) detector. Resolution and accuracy are high (
OO8.3.6<br />
Confocal<br />
setting<br />
(10-2µm)<br />
Laser<br />
&<br />
Spectrometer<br />
Microscope objective<br />
Scanning<br />
Mapping<br />
G L A Z E (0.1-3mm)<br />
Painting enamel (10-50µm)<br />
Under-Glaze Stain<br />
Slip or inter-phase<br />
a)<br />
Section<br />
or<br />
Fracture<br />
B O D Y<br />
b)<br />
c)<br />
Figure 2 : Sketch of the analysis of glazed ceramics with a Raman microscope (a) and (b,c)<br />
examples of on-site measurements (Iznik bottle (b) and Safavid dish (c) from the Musée National<br />
de Céramique, Sèvres), with a remote optic head equipped with a microscope objective and two<br />
fibers, optically coupled to the laser and the spectrometer.
OO8.3.7<br />
Portable instruments. The architecture of a portable instrument is similar to the above<br />
description. However, moving parts are suppressed, and the analyzed spectral range is given by<br />
the fixed grating in combination with the laser wavelength. Consequently, the grating is<br />
optimized for the wavelength and sensitivity is maximal. Transportation and mounting are easy,<br />
and the equipment is ready for use in ~10 minutes. The only required facility is an electric<br />
domestic plug.<br />
Examination procedure<br />
Figure 2 shows a scheme of the examination of a pottery artifact. The exciting laser light<br />
illuminates the sample through a microscope objective (magnification from 100 to 1000,<br />
typically), which is used both for the illumination (laser beam coming from the laser through<br />
mirrors and/or optic fiber) and the collection of the scattered light. The scattered light go to the<br />
CCD detector via two steps, the first one to suppress the Rayleigh scattering and the second one<br />
to split the selected spectral window on the CCD array in order to be able to see all the spectral<br />
components. Laboratory instruments offer perfect visualization of the studied area and of the<br />
laser spot, which facilitates the choice of the appropriate region to be analyzed. Because of the<br />
lack of a visualization device, on-site measurements generally use the spot itself to locate the<br />
analyzed point. This requires a shift down of the light power to a very low level compatible with<br />
eyes or safety goggles available for each wavelength, to optimize the spot position by tuning at<br />
the microscale the optical head and/or the artifact position and then to cover both with a black<br />
textile for eyes safety and to increase the illumination power up to the required level to get an<br />
appropriate spectrum. Checking the spectrum on the computer enables final tuning. It is clear that<br />
a good knowledge of the expected Raman signatures is mandatory. For this reason examination<br />
of similar materials at the laboratory is the pre-requisite step before any campaign of on-site<br />
measurements. By tuning the position of the sample relative to that of the microscope objective,<br />
it is also possible to analyze specifically the glaze from its surface to its interface with the body.<br />
Note that the nicer spectra are generally obtained with high magnification objectives.<br />
Background and Baseline subtraction<br />
Figure 3 shows some examples of the raw Raman spectra recorded in representative cases.<br />
Fluorescence is often observed in excavated materials. The intensity is huge in porous terra cotta<br />
and medium to very low for pore-free, stoneware and porcelain bodies and glazes, as shown for<br />
the celadon glazes in Fig. 3a. Such fluorescence extends over thousands of cm -1 and arises from<br />
organic residues grafted at the pores surfaces. An efficient cleaning is obtained after ~20 minutes<br />
of illumination by a powerful violet or blue laser line. On the other hand, the spectra of glazed<br />
ceramics kept in a collection (e.g. Iznik fritwares) give rise to fluorescence-free or -nearly free<br />
spectra [13]. Note that cleaning with water, ethanol or other solvents is not recommended for<br />
porous materials because the dissolved organic residues are spread on the whole surface.<br />
Another type of fluorescence made of “narrow” and structured signatures arises from 3d or<br />
4f ion-doping of the crystalline or amorphous phases (Medici porcelain analysed with 780 nm
OO8.3.8<br />
laser is a typical example, Fig. 3c). Because fluorescence energy is fixed, the shift of the exciting<br />
laser energy (i.e. changing the laser colour) displaces the phenomenon out of the analysed<br />
Intensity / arbitr. units<br />
Vietnamese celadons<br />
13 th century<br />
Iznik<br />
400<br />
360<br />
465<br />
465<br />
845<br />
985<br />
1035<br />
635<br />
775<br />
910<br />
930<br />
895<br />
1160<br />
MNC 27397<br />
dark-green<br />
white<br />
green<br />
black<br />
a)<br />
500 1000 1500 500 1000 1500<br />
Wavenumber / cm -1 Wavenumber / cm -1 b)<br />
Medici 1373 Medici<br />
White<br />
Intensity / arbitr.units<br />
glaze<br />
body<br />
Blue pigment<br />
850<br />
962<br />
c)<br />
1000 2000 400 600 800 1000<br />
Wavenumber / cm -1 Wavenumber / cm -1 d)<br />
Figure 3 : (a) examples of spectra recorded with green excitation on excavated thirteenth century<br />
A.D. celadons from Vietnam done in the laboratory [9] and (b) on Iznik fritware glazes from the<br />
Musée National de Céramique n° 273971 with measurements done on-site at the museum [13,23]<br />
; (c) Medici glaze and body spectra recorded on-site with a red laser, in which the fluorescence<br />
signature dominates ; (d) detail of the 300-1000 cm -1 region of the glaze and blue underglaze<br />
decoration of the Medici is given showing the identification of characteristic components from<br />
the complex background [10].
OO8.3.9<br />
spectral window, so that the examination with a green excitation gives a more convenient<br />
spectrum (Figure 4). Note that the spectrum of the second type of fluorescence is a “good”<br />
signature of the raw materials used. Zooming in the fluorescence spectra enables detecting<br />
narrow Raman signatures, i.e. the signature of most of the crystalline phases [10] ; an example is<br />
given with the spectra recorded with the red excitation for Medici porcelains (Fig. 3d).<br />
The subtraction of the base line is not a straightforward step and a bad choice could modify<br />
the spectrum shape, especially the broad components of glassy phases. The comparison of the<br />
“best-recorded spectrum” with the literature gives valuable information. It is mandatory to use<br />
the same type of baseline for all the spectra recorded on similar materials with the same<br />
instrument. In many cases of organic fluorescence, a linear baseline above 200-300 cm -1 is the<br />
best choice. Below 200 cm -1 , the choice of the baseline is not easy and requires a good<br />
knowledge of the Raman signature of glassy silicates with similar compositions.<br />
The reliability of the measurements can be evaluated by recording a series of spectra on<br />
similar parts of the artifacts (different coloured or colourless glaze and body areas), with different<br />
microscope magnifications and if possible with different lasers and instruments. This point has<br />
been extensively discussed in ref. [9].<br />
ORIGINAL IN<strong>FOR</strong>MATI<strong>ON</strong> FROM THE <strong>RAMAN</strong> SPECTRA<br />
Glasses are silicate networks in which the SiO 4 tetrahedra are joined together by the oxygen<br />
atoms located at the vertices. These SiO 4 tetrahedral connections are modified by the<br />
incorporation of aluminum, magnesium, iron, and alkali/alkaline earth metallic ions (fluxing<br />
oxides) which modification changes the glasses’ properties : melting temperature, viscosity,<br />
thermal expansion, color, chemical resistance, etc. Raman spectra could reveal these<br />
modifications of the SiO 4 tetrahedral vibrational unit (a strong covalent-bonded moiety) mostly<br />
through the intensity, line-width and spectral position of the associated bands [1,7-12]. By<br />
comparing Raman spectra of glassy or crystalline pure silicates and aluminates [24-26], it<br />
appears clearly that the Raman cross-section of Si-O bending and stretching modes is orders of<br />
magnitude stronger than that of their Al-O or Mg-O bond counterparts. This arises from the more<br />
covalent character of the Si-O bond. To a first approximation we can consider the SiO 4 entities<br />
as the only vibrational unit. Indeed, when compared to the strong covalent character of Si-O<br />
bond, the Raman cross-section of a very ionic Al-O bond can be neglected [7].<br />
Glass nanostructure is actually a function of two key factors: bulk composition and<br />
temperature of melt equilibration. Glass and glaze structure can be elaborated at temperatures<br />
ranging from ca. 600°C (for instance for pottery lustre) to ~1450°C (high temperature fired<br />
porcelain glaze, Figure 5a). Consequently, the compositional range of glass and glazes can be<br />
very large. Obviously, the preparation techniques employed come from the achievement of<br />
difference kiln temperatures, which in turn justify the use of different compositions. We have<br />
thus deduced a correlation between the processing and the raw materials, which is implicit in the<br />
preparation technique and should be reflected in the Raman spectra by conjugating the effect of<br />
temperature and composition [7,8].<br />
As a first conclusion Raman spectra allow for:
OO8.3.10<br />
- i) Crystalline phases within the body are identified. It is easily obtained by comparison with<br />
Raman spectra databases ([11,12, 24-26] and refs therein). Examples are given for typical hardpaste<br />
(mullite-based from Meissen, Saxony) and soft-paste porcelains (calcium<br />
silicate/phosphate-based, from St-Cloud (Fig. 1b) and Chantilly, France). The information is<br />
very similar to that obtained from x-ray diffraction, but Raman spectrometry uses the visible<br />
light and can be performed on-site [10,13]. Furthermore, small size (micrometer-to-nanometer)<br />
precipitates, within the glaze, are easily detected by Raman scattering, whereas they are hardly<br />
detected by x-ray diffraction. Figures 1b and 4a compare spectra recorded on Saint-Cloud and<br />
Sèvres with Medici porcelain glazes. Combined semi-quantitative identification of crystalline<br />
phases such as phosphates, wollastonites, cassiterite and others in body and glazes allows the<br />
identification of artifact production sites [27].<br />
- ii) Structure and composition of glassy silicates. The Raman intensity of Si-O bending and<br />
stretching envelopes vary with composition. Their different components inform us of the<br />
connectivity of the SiO 4 polymeric units and, thus, of the glass composition, nanostructure and<br />
processing temperature [1,7 and references therein]. A clear differentiation is possible through<br />
the relative intensities of the components of the Si-O stretching and bending modes at about<br />
1000 and 500 cm -1 respectively (Fig. 5). Because the SiO 4 tetrahedron is a very well defined<br />
vibrational and structural entity, its different configurations have specific vibrational fingerprints.<br />
From the literature [e.g. 1,7 and refs therein] the different spectral components of the Si-O bond<br />
stretching envelope were assigned to the tetrahedron vibrations with zero (Q 0 or isolated SiO 4 ),<br />
one (Q 1 or dumbbell -SiO 3 ), two (Q 2 or =SiO 2 ), and three (Q 3 or ≡SiO) bridging oxygen atoms<br />
per tetrahedral group. Q 4 corresponds to fully polymerized tetrahedron, as in pure silica.<br />
Decomposition of the Si-O bending and stretching massifs is illustrated with the example of<br />
Medici glaze in Figure 4.<br />
The plot of all component areas as a function of their center of gravity gives a representative<br />
view of the intrinsic homogeneity of the ceramic production (Figure 6) and can be used to<br />
identify artifacts made with different processes. Note that the variability of the Q 0 component<br />
(isolated SiO 4 ) is always very small whatever the artifact studied. The variability of Q 4<br />
component often is not significant because of its strong sensitivity to the baseline subtraction. By<br />
comparison to other fritwares studied in our laboratory, the production of Iznik ware appears<br />
very homogeneous. However, as shown in Figure 5, which compares the plots of Iznik artifacts<br />
assigned to the periods 1480 - ~1650 and > 1650 (late Iznik) ; small differences are observed for<br />
the centers of gravity. These differences, combined with those of the Q n (n = 1, 2 and 3)<br />
components allows for the classification of the different productions, as shown in Table 1.<br />
Differentiation between Medici, Iznik and Kütahya pottery glazes is straightforward from the<br />
centers of gravity but differentiation between Iznik, late Iznik and Kütayha productions requires<br />
consideration of the area ratios (Table 1).<br />
Index of polymerization, glass composition and processing<br />
Figure 5 compares different Raman signatures of glasses and glazes with various silica and<br />
fluxing oxide contents. For instance, the spectrum of silica-rich hard-paste glaze consists in a<br />
strong band at ~500 cm -1 (Si-O bending massif) and a weak bump at ~1000 cm -1 (Si-O stretching<br />
modes).
OO8.3.11<br />
Intensity / arbitr. units<br />
Medici<br />
Blue<br />
650<br />
515<br />
465<br />
475<br />
840<br />
965<br />
1035<br />
MNC 233852<br />
MNC 534503<br />
Intensity / arbitr. units<br />
Medici<br />
Q<br />
Q 0<br />
P<br />
Q 1<br />
Q 2<br />
Q 3<br />
Q 4<br />
a)<br />
500 1000 1500<br />
Wavenumber / cm -1<br />
200 400 600 800 1000 1200<br />
Wavenumber / cm -1 b)<br />
Figure 4 : (a) On-site recorded spectra obtained after subtraction of a quasi-linear or small<br />
polynomial baseline for Medici blue décor spectra from the glaze and (b) amorphous<br />
silicate Q n and crystalline components are drawn for “white” glaze [23] (P, calcium<br />
phosphate, Q, quartz).<br />
Intensity / arbitr. units<br />
a)<br />
Islamic 13 th<br />
Soft-paste 18 th<br />
"Roman" glass<br />
Soft paste 18 th<br />
Ca-based glaze 15 th<br />
Hard paste 18 th<br />
A 500<br />
/ A 1000<br />
8<br />
6<br />
4<br />
2<br />
5<br />
4<br />
0<br />
500 1000 1500<br />
0 10 20 30 40 50 60 70<br />
Wavenumber / cm -1 Samples<br />
1<br />
2<br />
gC<br />
Timour<br />
IDG<br />
ITZ<br />
SVR<br />
IMRF<br />
VHL<br />
VCL<br />
StC<br />
NG<br />
3<br />
6<br />
b)<br />
Figure 5 : (a) Raman spectra of various amorphous silicates with increasing silica content, from<br />
a low-temperature processed PbO-rich Islamic glaze to a high-temperature processed hard-paste<br />
K 2 O-rich porcelain glaze ; (b) index of polymerization (I p = A 500 /A 1000) plot for series of glasses<br />
and glazes of different production places and times, after [7,8,28], see references for details.
OO8.3.12<br />
100<br />
Iznik<br />
80<br />
Pigment<br />
C r<br />
Q 3<br />
Area / arbitr. units<br />
60<br />
40<br />
20<br />
Q 0<br />
Q 1<br />
Q 2<br />
Q 4<br />
0<br />
a)<br />
700 800 900 1000 1100 1200<br />
Wavenumber / cm -1<br />
60<br />
50<br />
40<br />
Late Iznik<br />
b)<br />
30<br />
20<br />
10<br />
0<br />
800 900 1000 1100 1200<br />
Wavenumber / cm -1<br />
Figure 6 : Peak area and center of gravity of (a) the glaze Raman components of Iznik wares<br />
made between 1480 and 1650 A.D. [13] and late Iznik productions made after 1650 A.D. [29] for<br />
~20 artifacts examined in different places ; circled data correspond to the Q n components of the<br />
amorphous silicate matrix of the glazes. Other values correspond to pigments signatures.<br />
On the contrary, as shown in Fig. 5a the 1000 cm -1 massif dominates the spectrum of a PbOrich<br />
Islamic glaze. Glass and glaze with intermediate [Na 2 O + K 2 O + CaO + PbO +…]/[SiO 2<br />
+Al 2 O 3 ] (flux/network former) ratios have intermediate Raman signature. The polymerization<br />
index I P (I P = A 500 /A 1000 with A being the Raman area of the band) is shown for a series of<br />
samples. The relationship between I p , the glass composition and the processing temperature is<br />
well documented [1-2,5,7] : a first family (I p < 0.3-0.5) mostly corresponds to Islamic leadcontaining<br />
or lustre potteries and some Punic/Roman glasses; a second family (0.5 < I p < 0.8)<br />
consists of some lead-based soft-paste porcelain enamels and most Punic/Roman glasses ; a third<br />
family (0.8
OO8.3.13<br />
productions (I P ~0.4-0.8), the highest values being obtained from blue underglaze decorated<br />
Saint-Cloud artifacts (Ip ~2.5-3.5) [27]. This is consistent with some historical records noting<br />
that such décor was developed at Saint-Cloud factory by an arcanist coming from a hard-paste<br />
porcelain factory.<br />
Table 1: Comparison between the Q 1 , Q 2 and Q 3 component center of gravity (ν) and some of<br />
their area ratios (A Qi /A Qj ) for different glazes from the 16-17 th century Ottoman fritwares and 16 th<br />
Medici porcelains. Late Iznik corresponds to artifacts assigned from stylistic analysis to<br />
production after year 1650. Differentiation between Kütahya 1 and 2’ is made by considering the<br />
peak maximum of the Si-O stretching envelope: K1~980 cm -1 , K2’~1050-1070 cm -1 , see ref. [29]<br />
for details.<br />
Parameter Iznik Late Iznik Kütahya 1 Kütahya 2’ Medici<br />
ν Q 1 / cm -1 920 925 929 924 943<br />
ν Q 2 / cm -1 978 979 982 981 976<br />
ν Q 3 / cm -1 1052 1039 1053 1054 1035<br />
A Q2 /A Q1 2.6 2.27 1.12 2 1.45<br />
A Q2 /A Q3 0.43 0.43 0.26 0.33 0.43<br />
Table 2: Main information and conclusions to be extracted through a Raman analysis<br />
Tool Action Caution Information Conclusion<br />
Crystalline<br />
phases<br />
signature<br />
Comparison with<br />
database<br />
Polarization<br />
Resonance<br />
Non-stoichiometry<br />
& solid solution –<br />
Type of<br />
compositions<br />
Place of<br />
production<br />
Amorphous<br />
silicates<br />
signature<br />
Intrinsic<br />
fluorescence<br />
Resonance Raman<br />
spectrum<br />
Q n components<br />
Index of<br />
polymerization<br />
Comparison to<br />
database/references<br />
Comparison to<br />
references<br />
induced band shift<br />
Signal-to-noise<br />
Base line<br />
subtraction<br />
(technology)<br />
Composition<br />
Processing<br />
temperature<br />
technology<br />
Raw materials<br />
Place of<br />
production<br />
Technology<br />
evolution<br />
Raw materials<br />
Laser power Pigments Place of<br />
production,<br />
technology<br />
C<strong>ON</strong>CLUSI<strong>ON</strong><br />
Combination of on-site (examination of rare artifacts) and laboratory (examination of<br />
reference samples, data processing) Raman micro spectrometry is a very powerful nondestructive<br />
technique that we have used to document ancient technology and to provide objective
OO8.3.14<br />
support to the classification and even dating of ceramics, glasses, gems, pigments, parchments,<br />
paintings and frescoes, etc.<br />
As sketched in Table 2, this requires the determination of the Raman signature of the different<br />
amorphous, nanocrystalline and crystalline phases with the help of databases or using other<br />
laboratory techniques (X-ray diffraction, optical and electronic microscopy, chemical analysis,<br />
EDS, etc…). Note that chromophore Raman intensities should be strongly modified as a function<br />
of the laser energy and concentration [16]. Solid solution and non-stoichiometric phases involve<br />
more or less important shifts of the band centre of gravity and intensity. Polarisation effects are to<br />
be considered if the laser-spot size is of the same order of magnitude as the grain size. Data<br />
processing (baseline subtraction, component extraction) is a very important step; the second step,<br />
which is familiar to scientists working in materials science, economy or in biology is the<br />
processing of the extracted parameters by multiparameter analysis, Euclidian methods, 2D<br />
correlation, etc [12, 28].<br />
ACKNOWLEGMENTS<br />
The authors would like to thanks Mrs; V. Milande, L. Soustiel and M.-C. David and Mr. Ph.<br />
Magloire for their help in selecting the artifacts and Mr. G. Sagon for his technical help. Special<br />
thanks to Dr. B. Lenain, Kayser Optical Sarl, Lyon, and to Dr. J. Oswalt, Jobin-Yvon SAS,<br />
Longjumeau, for providing their portable spectrometers.<br />
REFERENCES<br />
1. Ph. Colomban, “Glasses, glazes and ceramics – Recognition of the ancient technology”,<br />
Raman Spectroscopy in Archaeology and Art History, ed. H.G.M. Edwards and J.M.<br />
Chalmers (Royal Society of Chemistry, Cambridge, 2005), 192-206.<br />
2. Coupry C., “Fifteen years of Artifacts Investigations by Raman Spectroscopy“, Raman<br />
Spectroscopy in Archaeology and Art History, ed. H.G.M. Edwards and J.M. Chalmers<br />
(Royal Society of Chemistry, Cambridge, 2005), 207-216.<br />
3. B. Guineau, C. Coupry, M.T. Gousset, J.P. Forgerit and J. Vezin, Scriptorium XL, 157<br />
(1986).<br />
4. C. Coupry and S. Groetembril, Asian Chemistry Letters 5 171 (2001).<br />
5. C. Coupry, Les pigments utilisés pour l’enluminure à Fécamp aux XI e et XII e siècles, in<br />
Manuscrits et enluminures dans le monde normand (X e – XV e siècles), Office Universitaire<br />
d’Etudes Normandes, Caen (France) 69 (1999).<br />
6. M. Rassart-Debergh and C. Coupry, Cahiers de la Bibliothèque copte, 12, Etudes coptes VII,<br />
207 (2000).<br />
7. Ph. Colomban, J. Non-Crystalline Solids, 323, 180 (2003).<br />
8. Ph. Colomban, L’Actualité Chimique, février, 12 (2003).<br />
9. N.Q. Liem, N.T. Thanh and Ph. Colomban, J. Raman Spectr. 33, 287 (2002).<br />
10. Ph. Colomban Ph., Milande V. and H. Lucas, J. Raman Spectr. 35, 68 (2004).<br />
11. Ph. Colomban, G. Sagon and X. Faurel, J. Raman Spectr. 32, 351 (2001).<br />
12. Ph. Colomban and F. Treppoz, J. Raman Spectr. 32, 93 (2001).<br />
13. Ph. Colomban, V. Milande V. and L. Le Bihan, J. Raman Spectr. 35, 68 (2004).<br />
14. Ph. Colomban and C. Truong, J. Raman Spectr. 35,195 (2004).<br />
15. Ph. Colomban, J. Raman Spectr. 34, 420 (2003).
OO8.3.15<br />
16. X. Faurel, A. Vandeperre and Ph. Colomban, J. Raman Spectr. 34, 290 (2003).<br />
17. C. Paris and C. Coupry, J. Raman Spectr. 38, 77 (2005).<br />
18. C. Paris, S. Lecomte and C. Coupry, Applied Spectrosc., (2005).<br />
19. C. Coupry, G. Sagon and P. Gorguet-Ballesteros, J. Raman Spectr. 28 ,85 (1997).<br />
20. D.A. Long, Raman Spectroscopy, (McGraw-Hill International Book Compagny 1977).<br />
21. Ph. Colomban, Spectroscopy Europe 15, 8 (2003).<br />
22. D. Neff , S. Reguer, L. Bellot-Gurlet, Ph. Dillmann and R. Bertholon, J. Raman Spectr. 35,<br />
739 (2004).<br />
23. Ph. Colomban and V. Milande, Proc. 1 st Worshop on Science, Technology and Cultural<br />
Heritage”, 29 June-2 nd July 2004, Venice, AIV.<br />
24. W. P. Griffith, “Raman Spectroscopy of Terrestrial Minerals”, ch 12. in Infrared and<br />
Raman Spectroscopy of Lunar and Terrestrial Minerals, C. Karr Jr ed. (Academic<br />
Press, New York, 1975).<br />
25. M. Pinet, D.C. Smith and B. Lasnier B., in La Microsonde Raman en Géologie, N°<br />
Hors-Série, Revue de Gemmologie, June 1992, Paris,11.<br />
26. R. Maestrati, Contribution à l’Edification du Catalogue Raman des Gemmes, Diplôme<br />
de Gemmologie, University of Nantes, 1989.<br />
27. Ph. Colomban, I. Robert, C. Roche, G. Sagon and V. Milande, Rev. d’Archéométrie, 28, 153<br />
(2004).<br />
28. Ph. Colomban, A. Tournié and L. Bellot-Gurlet, J. Raman Spectr. 36, (2005).<br />
29. Ph. Colomban, R. de Laveaucoupet and V. Milande, J. Raman Spectr. 36, (2005).