Knowledge and attitudes towards healthy eating and physical activity:
Knowledge and attitudes towards healthy eating and physical activity:
Knowledge and attitudes towards healthy eating and physical activity:

Create successful ePaper yourself
Turn your PDF publications into a flip-book with our unique Google optimized e-Paper software.
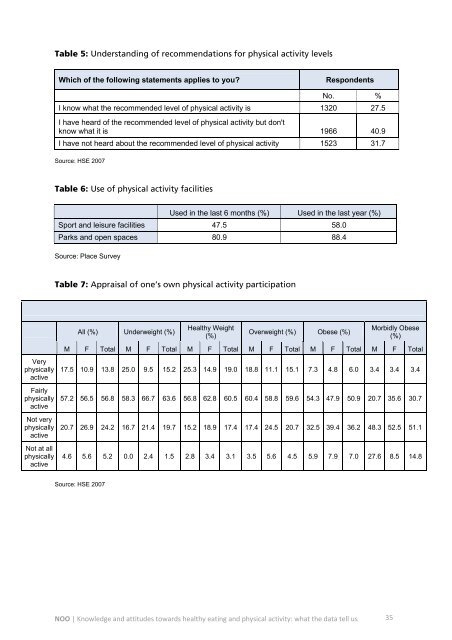
Table 5: Underst<strong>and</strong>ing of recommendations for <strong>physical</strong> <strong>activity</strong> levels<br />
Which of the following statements applies to you<br />
Respondents<br />
No. %<br />
I know what the recommended level of <strong>physical</strong> <strong>activity</strong> is 1320 27.5<br />
I have heard of the recommended level of <strong>physical</strong> <strong>activity</strong> but don't<br />
know what it is 1966 40.9<br />
I have not heard about the recommended level of <strong>physical</strong> <strong>activity</strong> 1523 31.7<br />
Source: HSE 2007<br />
Table 6: Use of <strong>physical</strong> <strong>activity</strong> facilities<br />
Used in the last 6 months (%) Used in the last year (%)<br />
Sport <strong>and</strong> leisure facilities 47.5 58.0<br />
Parks <strong>and</strong> open spaces 80.9 88.4<br />
Source: Place Survey<br />
Table 7: Appraisal of one’s own <strong>physical</strong> <strong>activity</strong> participation<br />
All (%) Underweight (%)<br />
Healthy Weight<br />
(%)<br />
Overweight (%) Obese (%)<br />
Morbidly Obese<br />
(%)<br />
Very<br />
<strong>physical</strong>ly<br />
active<br />
Fairly<br />
<strong>physical</strong>ly<br />
active<br />
Not very<br />
<strong>physical</strong>ly<br />
active<br />
Not at all<br />
<strong>physical</strong>ly<br />
active<br />
M F Total M F Total M F Total M F Total M F Total M F Total<br />
17.5 10.9 13.8 25.0 9.5 15.2 25.3 14.9 19.0 18.8 11.1 15.1 7.3 4.8 6.0 3.4 3.4 3.4<br />
57.2 56.5 56.8 58.3 66.7 63.6 56.8 62.8 60.5 60.4 58.8 59.6 54.3 47.9 50.9 20.7 35.6 30.7<br />
20.7 26.9 24.2 16.7 21.4 19.7 15.2 18.9 17.4 17.4 24.5 20.7 32.5 39.4 36.2 48.3 52.5 51.1<br />
4.6 5.6 5.2 0.0 2.4 1.5 2.8 3.4 3.1 3.5 5.6 4.5 5.9 7.9 7.0 27.6 8.5 14.8<br />
Source: HSE 2007<br />
NOO | <strong>Knowledge</strong> <strong>and</strong> <strong>attitudes</strong> <strong>towards</strong> <strong>healthy</strong> <strong>eating</strong> <strong>and</strong> <strong>physical</strong> <strong>activity</strong>: what the data tell us 35