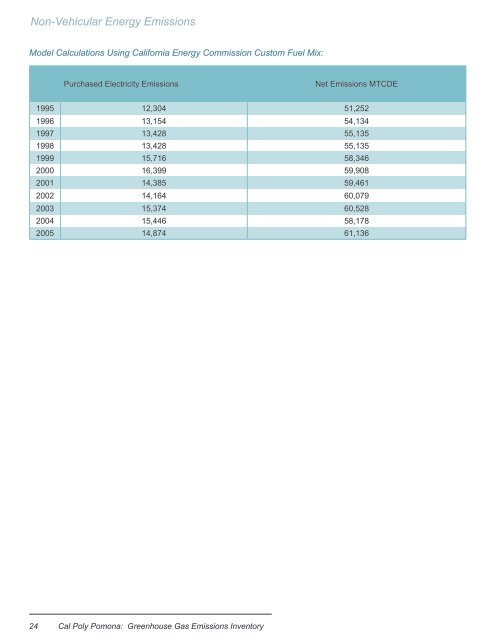
Non-Vehicular Energy <strong>Emissions</strong> Model <strong>Cal</strong>culations Using <strong>Cal</strong>ifornia Energy Commission Custom Fuel Mix: Purchased Electricity <strong>Emissions</strong> Net <strong>Emissions</strong> MTCDE 1995 12,304 51,252 1996 13,154 54,134 1997 13,428 55,135 1998 13,428 55,135 1999 15,716 58,346 2000 16,399 59,908 2001 14,385 59,461 2002 14,164 60,079 2003 15,374 60,528 2004 15,446 58,178 2005 14,874 61,136 24 <strong>Cal</strong> <strong>Poly</strong> <strong>Pomona</strong>: <strong>Greenhouse</strong> <strong>Gas</strong> <strong>Emissions</strong> <strong>Inventory</strong>
7.0 Agriculture and Landscape <strong>Emissions</strong> <strong>Inventory</strong> Introduction The Agricultural component of the greenhouse gas inventory is primarily concerned with methane (CH 4 ) and nitrous oxide (N 2 0). Methane is associated with livestock kept on campus. Most livestock animals release methane produced by microbes in the gut and from the decomposition of their manure. r Nitrous oxide is associated with fertilizer application on campus crops, fields and grounds. While produced in much smaller quantities than carbon dioxide on campus, methane and nitrous oxide have much greater global warming potentials. Methane has a GWP of 23 and nitrous oxide has a GWP of 296 s (relative to 1 kg of carbon dioxide over 100 years). Overall, methane and nitrous oxide make up a very small percentage of <strong>Cal</strong> <strong>Poly</strong> <strong>Pomona</strong>’s total carbon footprint. These gases are created by the small number of livestock kept on the CPP campus, and by the evapotranspiration of plants that have been synthetically and organically fertilized. Data Collection To account for agricultural emissions, inventory information relative to the animals kept on campus and fertilizer applications must be input into the model. The animal information consists of a simple head count inventory by species, such as milk and beef cattle, swine, goats, sheep, horses, poultry, etc. Organic and synthetic fertilizer applications must be input as pounds applied per year. The relative percentage of nitrogen contained per applied pounds must also be input because the release of nitrous oxide is directly related to the nitrogen content of the fertilizer. nitrogen, phosphate and potassium. The percentages of nitrogen content in the fertilizers used on campus were averaged into one percentage. This percentage is rough, as the Facilities Landscape Services Dept. had only three years of estimated data. Additionally, the Ornamental Horticultural Unit data was based on estimation. Key Finding Agricultural activity appears to have small effect on <strong>Cal</strong> <strong>Poly</strong> <strong>Pomona</strong>’s total carbon footprint. Recommendations • Develop improved tracking method for quantities of nitrogen used in agricultural and landscape activities. Data should be centralized for easy retrieval. • Conduct carbon sequestration inventory of campus landscape to assess current rates of sequestration that serves as offset for greenhouse gas emissions. Data Supplier/Contact Fertilizer Application, Agriculture (irrigated pasture, crop lands, and orchards): Daniel G. Hostetler, Chair, Plant Sciences Department Fertilizer Application, Horticulture: Monica P. Salembier, Nursery Tech, Plant Sciences Department Fertilizer Application, Landscaping: Richard C. Farmer, Manager Landscape Services, Facilities Management Animal Agriculture, Cattle Headcounts: Dr. Cedric Y. Matsushima, Animal & Veterinary Sciences Animal Agriculture, Sheep and Swine Headcounts: Marie K. Nagano, Livestock Tech, Animal & Veterinary Sciences The greatest challenge associated with data collection for the agricultural sector was calculating the fertilizer data for agricultural land. Much of the required data was not available and had to be estimated or synthesized from many different sources, each with its own method of recording data. Although professor Hostetler was able to provide precise and relevant data estimates as a yearly average over ten years, no manageable hard data was available. According to professor Hostetler, agricultural operations at <strong>Cal</strong> <strong>Poly</strong> <strong>Pomona</strong> have not changed significantly in the past ten years, so input data for all years has been kept equal. The percentage of nitrogen per pound of fertilizer was averaged from five different varieties of fertilizer. Each of the five different fertilizer mixes has different values of <strong>Cal</strong> <strong>Poly</strong> <strong>Pomona</strong>: <strong>Greenhouse</strong> <strong>Gas</strong> <strong>Emissions</strong> <strong>Inventory</strong> 25