Greenhouse Gas Emissions Inventory Report - Cal Poly Pomona
Greenhouse Gas Emissions Inventory Report - Cal Poly Pomona
Greenhouse Gas Emissions Inventory Report - Cal Poly Pomona

Create successful ePaper yourself
Turn your PDF publications into a flip-book with our unique Google optimized e-Paper software.
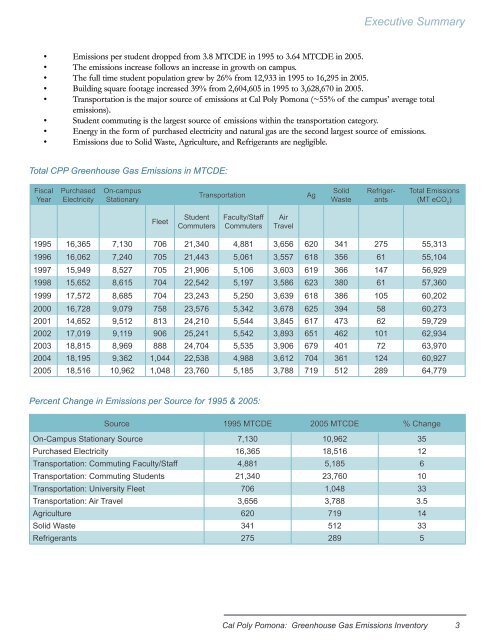
Executive Summary<br />
• <strong>Emissions</strong> per student dropped from 3.8 MTCDE in 1995 to 3.64 MTCDE in 2005.<br />
• The emissions increase follows an increase in growth on campus.<br />
• The full time student population grew by 26% from 12,933 in 1995 to 16,295 in 2005.<br />
• Building square footage increased 39% from 2,604,605 in 1995 to 3,628,670 in 2005.<br />
• Transportation is the major source of emissions at <strong>Cal</strong> <strong>Poly</strong> <strong>Pomona</strong> (~55% of the campus’ average total<br />
emissions).<br />
• Student commuting is the largest source of emissions within the transportation category.<br />
• Energy in the form of purchased electricity and natural gas are the second largest source of emissions.<br />
• <strong>Emissions</strong> due to Solid Waste, Agriculture, and Refrigerants are negligible.<br />
Total CPP <strong>Greenhouse</strong> <strong>Gas</strong> <strong>Emissions</strong> in MTCDE:<br />
Fiscal<br />
Year<br />
Purchased<br />
Electricity<br />
On-campus<br />
Stationary<br />
Transportation<br />
Ag<br />
Solid<br />
Waste<br />
Refrigerants<br />
Total <strong>Emissions</strong><br />
(MT eCO 2<br />
)<br />
Fleet<br />
Student<br />
Commuters<br />
Faculty/Staff<br />
Commuters<br />
Air<br />
Travel<br />
1995 16,365 7,130 706 21,340 4,881 3,656 620 341 275 55,313<br />
1996 16,062 7,240 705 21,443 5,061 3,557 618 356 61 55,104<br />
1997 15,949 8,527 705 21,906 5,106 3,603 619 366 147 56,929<br />
1998 15,652 8,615 704 22,542 5,197 3,586 623 380 61 57,360<br />
1999 17,572 8,685 704 23,243 5,250 3,639 618 386 105 60,202<br />
2000 16,728 9,079 758 23,576 5,342 3,678 625 394 58 60,273<br />
2001 14,652 9,512 813 24,210 5,544 3,845 617 473 62 59,729<br />
2002 17,019 9,119 906 25,241 5,542 3,893 651 462 101 62,934<br />
2003 18,815 8,969 888 24,704 5,535 3,906 679 401 72 63,970<br />
2004 18,195 9,362 1,044 22,538 4,988 3,612 704 361 124 60,927<br />
2005 18,516 10,962 1,048 23,760 5,185 3,788 719 512 289 64,779<br />
Percent Change in <strong>Emissions</strong> per Source for 1995 & 2005:<br />
Source 1995 MTCDE 2005 MTCDE % Change<br />
On-Campus Stationary Source 7,130 10,962 35<br />
Purchased Electricity 16,365 18,516 12<br />
Transportation: Commuting Faculty/Staff 4,881 5,185 6<br />
Transportation: Commuting Students 21,340 23,760 10<br />
Transportation: University Fleet 706 1,048 33<br />
Transportation: Air Travel 3,656 3,788 3.5<br />
Agriculture 620 719 14<br />
Solid Waste 341 512 33<br />
Refrigerants 275 289 5<br />
<strong>Cal</strong> <strong>Poly</strong> <strong>Pomona</strong>: <strong>Greenhouse</strong> <strong>Gas</strong> <strong>Emissions</strong> <strong>Inventory</strong>