Article: Quarterly Bulletin - South African Reserve Bank
Article: Quarterly Bulletin - South African Reserve Bank
Article: Quarterly Bulletin - South African Reserve Bank

You also want an ePaper? Increase the reach of your titles
YUMPU automatically turns print PDFs into web optimized ePapers that Google loves.
has an important but more indirect role in allowing the<br />
economy to achieve its longer-term growth potential.<br />
This involves ensuring that demand in the economy<br />
grows roughly in line with the capacity of the economy to<br />
meet the demand. The pursuit of price stability in the rest<br />
of the world and the success achieved by many countries<br />
in bringing their inflation rates down to low levels,<br />
has left <strong>South</strong> Africa with no alternative but to bring its<br />
inflation in step with that of the rest of the world (see Van<br />
der Merwe, 1997). Price stability is at the core of the<br />
“stability culture” which is being established throughout<br />
Europe. In the words of Duisenberg (1999b): “Monetary<br />
policy cannot be used to solve structural problems, such<br />
as the unacceptably high level of unemployment in the<br />
euro area. Structural problems call for structural solutions,<br />
in this case measures targeted at making labour and<br />
product markets work more flexibly. The best contribution<br />
the European Central <strong>Bank</strong>’s monetary policy can make in<br />
this context is to maintain price stability. In this way one of<br />
the conditions for sustainable growth in incomes and<br />
employment is created. As important as this is, it should be<br />
realised that jobs are created by firms which are confident<br />
about the future and not by central banks.” If <strong>South</strong> Africa<br />
does not achieve price stability in the coming years,<br />
market adjustments to compensate for inflation<br />
differentials are inevitable. Such adjustments could<br />
include repeated large disruptive capital outflows, a depreciating<br />
rand and high interest rate levels.<br />
Low inflation is almost universally accepted as the<br />
ultimate objective of monetary policy – not as an end in<br />
itself, but as the means whereby monetary policy can<br />
contribute to solid economic performance. It is absolutely<br />
essential for any central bank entrusted with the task of<br />
keeping prices stable to analyse and monitor the developments<br />
of monetary aggregates closely (see Duisenberg,<br />
1999a). To achieve this objective, the <strong>Reserve</strong> <strong>Bank</strong> designed<br />
a monetary policy framework which was anchored<br />
by the setting of guidelines for growth in the broad money<br />
supply (M3). This approach is based on the presumption<br />
that a stable relationship exists between changes in the<br />
money supply and macroeconomic variables, including<br />
nominal GDP. Within this monetary policy framework the<br />
<strong>Reserve</strong> <strong>Bank</strong> succeeded in bringing inflation down to<br />
more acceptable levels.<br />
Broad money supply targets were announced for the<br />
first time in the second half of 1985 for the period starting<br />
in the last quarter of 1985. The Commission of Inquiry<br />
into the Monetary System and Monetary Policy in <strong>South</strong><br />
Africa had recommended the implementation of monetary<br />
targeting with a reasonable measure of flexibility<br />
(Commission 1984). In the first quarter of each year,<br />
target ranges for M3 growth were announced. The<br />
target ranges, also referred to in recent years as “guidelines”,<br />
were afforded a high priority in monetary policy. In<br />
recent years the M3 money supply increased at rates<br />
consistently higher than the indicated guideline ranges for<br />
growth, but inflation nevertheless declined, contradicting<br />
previous expectations.<br />
Considerable uncertainties have arisen about the<br />
behaviour of the velocities of circulation of the various<br />
monetary aggregates and there were difficulties with<br />
forecasting the relationship between money growth,<br />
nominal income growth and inflation. As in other countries<br />
which moved through periods of stabilisation from<br />
high to low inflation, the relationship between money<br />
growth and nominal income growth observed in <strong>South</strong><br />
Africa during periods of high inflation, changed with declining<br />
inflation. Lower inflation and positive real returns on<br />
deposit-type investments contributed in restoring<br />
money’s property as a store of value, thereby encouraging<br />
the community to hold an increased portion of<br />
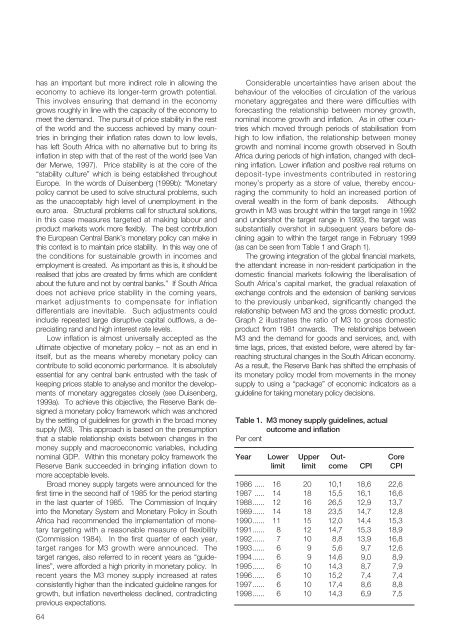
overall wealth in the form of bank deposits. Although<br />
growth in M3 was brought within the target range in 1992<br />
and undershot the target range in 1993, the target was<br />
substantially overshot in subsequent years before declining<br />
again to within the target range in February 1999<br />
(as can be seen from Table 1 and Graph 1).<br />
The growing integration of the global financial markets,<br />
the attendant increase in non-resident participation in the<br />
domestic financial markets following the liberalisation of<br />
<strong>South</strong> Africa’s capital market, the gradual relaxation of<br />
exchange controls and the extension of banking services<br />
to the previously unbanked, significantly changed the<br />
relationship between M3 and the gross domestic product.<br />
Graph 2 illustrates the ratio of M3 to gross domestic<br />
product from 1981 onwards. The relationships between<br />
M3 and the demand for goods and services, and, with<br />
time lags, prices, that existed before, were altered by farreaching<br />
structural changes in the <strong>South</strong> <strong>African</strong> economy.<br />
As a result, the <strong>Reserve</strong> <strong>Bank</strong> has shifted the emphasis of<br />
its monetary policy model from movements in the money<br />
supply to using a “package” of economic indicators as a<br />
guideline for taking monetary policy decisions.<br />
Table 1. M3 money supply guidelines, actual<br />
outcome and inflation<br />
Per cent<br />
Year Lower Upper Out- Core<br />
limit limit come CPI CPI<br />
1986 ..... 16 20 10,1 18,6 22,6<br />
1987 ..... 14 18 15,5 16,1 16,6<br />
1988...... 12 16 26,5 12,9 13,7<br />
1989...... 14 18 23,5 14,7 12,8<br />
1990...... 11 15 12,0 14,4 15,3<br />
1991...... 8 12 14,7 15,3 18,9<br />
1992...... 7 10 8,8 13,9 16,8<br />
1993...... 6 9 5,6 9,7 12,6<br />
1994...... 6 9 14,6 9,0 8,9<br />
1995...... 6 10 14,3 8,7 7,9<br />
1996...... 6 10 15,2 7,4 7,4<br />
1997...... 6 10 17,4 8,6 8,8<br />
1998...... 6 10 14,3 6,9 7,5<br />
64