Signaling currency crises in South Africa - South African Reserve Bank
Signaling currency crises in South Africa - South African Reserve Bank
Signaling currency crises in South Africa - South African Reserve Bank

Create successful ePaper yourself
Turn your PDF publications into a flip-book with our unique Google optimized e-Paper software.
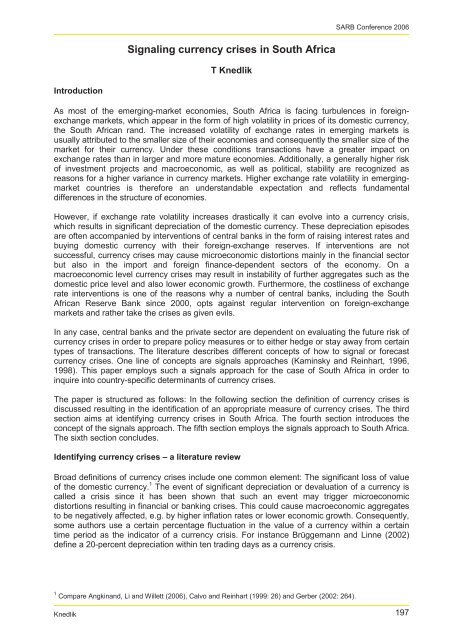
<strong>Signal<strong>in</strong>g</strong> <strong>currency</strong> <strong>crises</strong> <strong>in</strong> <strong>South</strong> <strong>Africa</strong>T KnedlikSARB Conference 2006IntroductionAs most of the emerg<strong>in</strong>g-market economies, <strong>South</strong> <strong>Africa</strong> is fac<strong>in</strong>g turbulences <strong>in</strong> foreignexchangemarkets, which appear <strong>in</strong> the form of high volatility <strong>in</strong> prices of its domestic <strong>currency</strong>,the <strong>South</strong> <strong>Africa</strong>n rand. The <strong>in</strong>creased volatility of exchange rates <strong>in</strong> emerg<strong>in</strong>g markets isusually attributed to the smaller size of their economies and consequently the smaller size of themarket for their <strong>currency</strong>. Under these conditions transactions have a greater impact onexchange rates than <strong>in</strong> larger and more mature economies. Additionally, a generally higher riskof <strong>in</strong>vestment projects and macroeconomic, as well as political, stability are recognized asreasons for a higher variance <strong>in</strong> <strong>currency</strong> markets. Higher exchange rate volatility <strong>in</strong> emerg<strong>in</strong>gmarketcountries is therefore an understandable expectation and reflects fundamentaldifferences <strong>in</strong> the structure of economies.However, if exchange rate volatility <strong>in</strong>creases drastically it can evolve <strong>in</strong>to a <strong>currency</strong> crisis,which results <strong>in</strong> significant depreciation of the domestic <strong>currency</strong>. These depreciation episodesare often accompanied by <strong>in</strong>terventions of central banks <strong>in</strong> the form of rais<strong>in</strong>g <strong>in</strong>terest rates andbuy<strong>in</strong>g domestic <strong>currency</strong> with their foreign-exchange reserves. If <strong>in</strong>terventions are notsuccessful, <strong>currency</strong> <strong>crises</strong> may cause microeconomic distortions ma<strong>in</strong>ly <strong>in</strong> the f<strong>in</strong>ancial sectorbut also <strong>in</strong> the import and foreign f<strong>in</strong>ance-dependent sectors of the economy. On amacroeconomic level <strong>currency</strong> <strong>crises</strong> may result <strong>in</strong> <strong>in</strong>stability of further aggregates such as thedomestic price level and also lower economic growth. Furthermore, the costl<strong>in</strong>ess of exchangerate <strong>in</strong>terventions is one of the reasons why a number of central banks, <strong>in</strong>clud<strong>in</strong>g the <strong>South</strong><strong>Africa</strong>n <strong>Reserve</strong> <strong>Bank</strong> s<strong>in</strong>ce 2000, opts aga<strong>in</strong>st regular <strong>in</strong>tervention on foreign-exchangemarkets and rather take the <strong>crises</strong> as given evils.In any case, central banks and the private sector are dependent on evaluat<strong>in</strong>g the future risk of<strong>currency</strong> <strong>crises</strong> <strong>in</strong> order to prepare policy measures or to either hedge or stay away from certa<strong>in</strong>types of transactions. The literature describes different concepts of how to signal or forecast<strong>currency</strong> <strong>crises</strong>. One l<strong>in</strong>e of concepts are signals approaches (Kam<strong>in</strong>sky and Re<strong>in</strong>hart, 1996,1998). This paper employs such a signals approach for the case of <strong>South</strong> <strong>Africa</strong> <strong>in</strong> order to<strong>in</strong>quire <strong>in</strong>to country-specific determ<strong>in</strong>ants of <strong>currency</strong> <strong>crises</strong>.The paper is structured as follows: In the follow<strong>in</strong>g section the def<strong>in</strong>ition of <strong>currency</strong> <strong>crises</strong> isdiscussed result<strong>in</strong>g <strong>in</strong> the identification of an appropriate measure of <strong>currency</strong> <strong>crises</strong>. The thirdsection aims at identify<strong>in</strong>g <strong>currency</strong> <strong>crises</strong> <strong>in</strong> <strong>South</strong> <strong>Africa</strong>. The fourth section <strong>in</strong>troduces theconcept of the signals approach. The fifth section employs the signals approach to <strong>South</strong> <strong>Africa</strong>.The sixth section concludes.Identify<strong>in</strong>g <strong>currency</strong> <strong>crises</strong> – a literature reviewBroad def<strong>in</strong>itions of <strong>currency</strong> <strong>crises</strong> <strong>in</strong>clude one common element: The significant loss of valueof the domestic <strong>currency</strong>. 1 The event of significant depreciation or devaluation of a <strong>currency</strong> iscalled a crisis s<strong>in</strong>ce it has been shown that such an event may trigger microeconomicdistortions result<strong>in</strong>g <strong>in</strong> f<strong>in</strong>ancial or bank<strong>in</strong>g <strong>crises</strong>. This could cause macroeconomic aggregatesto be negatively affected, e.g. by higher <strong>in</strong>flation rates or lower economic growth. Consequently,some authors use a certa<strong>in</strong> percentage fluctuation <strong>in</strong> the value of a <strong>currency</strong> with<strong>in</strong> a certa<strong>in</strong>time period as the <strong>in</strong>dicator of a <strong>currency</strong> crisis. For <strong>in</strong>stance Brüggemann and L<strong>in</strong>ne (2002)def<strong>in</strong>e a 20-percent depreciation with<strong>in</strong> ten trad<strong>in</strong>g days as a <strong>currency</strong> crisis.1 Compare Angk<strong>in</strong>and, Li and Willett (2006), Calvo and Re<strong>in</strong>hart (1999: 26) and Gerber (2002: 264).Knedlik 197
SARB Conference 2006Not only the actual depreciation or devaluation of a <strong>currency</strong> can be associated with economiclosses, but efforts to avoid or stop the fall of the <strong>currency</strong> can also be costly. Therefore, mostdef<strong>in</strong>itions of <strong>currency</strong> <strong>crises</strong> also <strong>in</strong>clude <strong>in</strong>terventions by the respective central banks. These<strong>in</strong>terventions can take the form of <strong>in</strong>creases <strong>in</strong> <strong>in</strong>terest rates – <strong>in</strong> order to make the domestic<strong>currency</strong> more attractive to <strong>in</strong>vestors – and <strong>in</strong>terventions <strong>in</strong> foreign-exchange markets – <strong>in</strong> orderto stabilize the demand for the domestic <strong>currency</strong> to avoid price reactions. 2 All three measuresare comb<strong>in</strong>ed <strong>in</strong> the Exchange Market Pressure (EMP) <strong>in</strong>dex. A general expression of the EMP<strong>in</strong>dex is: 3EMP = α⋅∆ e + β ⋅∆ i + γ ⋅∆ r . (1)it , it , it , it ,The EMP is the weighted sum of the percentage change <strong>in</strong> the exchange rate of country i attime t ( ∆ e it ,), changes <strong>in</strong> <strong>in</strong>terest rates ( ∆ i it ,) and the percentage change <strong>in</strong> foreign-exchangereserves ( ∆ r it ,). α, βγ , are the weights of the respective measures. The signs of the measuresare adjusted so that an <strong>in</strong>crease of the measure <strong>in</strong>dicates <strong>in</strong>creas<strong>in</strong>g pressure. A crisis is<strong>in</strong>dicated if the follow<strong>in</strong>g condition holds:⎧1, if EMP ti ,> µ EMP+ δ ⋅σCRISIS= EMP⎨ .(2)⎩ 0, otherwiseA crisis is <strong>in</strong>dicated if the current value of the EMP <strong>in</strong>dex exceeds the mean of the EMP time series( µEMP) plus the standard deviation of the EMP time series ( σEMP) multiplied by a weight (δ ).While the empirical literature on <strong>currency</strong> <strong>crises</strong> widely uses this general framework, it differsnotably on the details of EMP def<strong>in</strong>ition and the crisis threshold. With respect to Equation 1,there are versions of the equation that use changes <strong>in</strong> the <strong>in</strong>terest rate differential to a referencecountry <strong>in</strong>stead of changes <strong>in</strong> domestic <strong>in</strong>terest rates alone. There are also variations <strong>in</strong> whichchanges of <strong>currency</strong> reserves relative to monetary aggregates are used <strong>in</strong>stead of foreign<strong>currency</strong> reserves of the country of <strong>in</strong>terest itself. 4 Most importantly, differences lie <strong>in</strong> thecalculation of the weights α, βγ. , Some studies set one or two of the weights equal to zero. It issometimes argued that adequate <strong>in</strong>terest rate data are not available for emerg<strong>in</strong>g-marketeconomies and β is therefore set at zero. 5 In other studies it has been argued that<strong>in</strong>terventions <strong>in</strong> foreign-exchange markets play a m<strong>in</strong>or role, e.g. because a central bank optsnot to <strong>in</strong>tervene <strong>in</strong> <strong>currency</strong> markets or because reserves fluctuate too much <strong>in</strong> non-crisis timesdue to other reasons which overlay the <strong>currency</strong> crisis effect, therefore γ is set at zero. 6 Onerather common way of tackl<strong>in</strong>g the weight<strong>in</strong>g problem is to weight the (rema<strong>in</strong><strong>in</strong>g) measuresaccord<strong>in</strong>g to their <strong>in</strong>verse standard deviations. The so-calculated weights can be normalized tototal unity if each weight is divided by the sum of the <strong>in</strong>verse standard deviations of allmeasures, e.g. α would be: 71/ σeα =1/ σ + 1/ σ + 1/ σe r i(3)2 Kam<strong>in</strong>sky and Re<strong>in</strong>hart (1996: 4) and Eichengreen, Rose and Wyplosz (1996:474-475).3 Compare Bhundia and Ricci (2005:157).4 See Eichengreen, Rose and Wyplosz (1996: 457) and Girton and Roper (1997).5 E.g. Aziz, Caramazza and Salgado (2000), Kam<strong>in</strong>sky and and Re<strong>in</strong>hart (1999) and Glick and Hutchison (2001).Most of the citations <strong>in</strong> this section are adopted from Angk<strong>in</strong>and, Li and Willett (2006), who provide an excellentoverview of different EMP variations.6 E.g. Bubula and Otker-Robe (2003).7 See Angk<strong>in</strong>and, Li and Willett (2006).198Knedlik
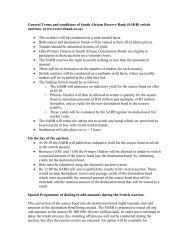
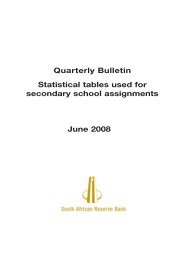
SARB Conference 2006Figure 1: EMP dataExchange rate2520151050-5-101993/011993/081994/031994/101995/051995/121996/071997/021997/091998/041998/111999/062000/012000/082001/032001/102002/052002/122003/072004/022004/092005/04Percent change2005/11Interest rateChange <strong>in</strong> percent po<strong>in</strong>ts43210-1-21993/011993/071994/011994/071995/011995/071996/011996/071997/011997/071998/011998/071999/011999/072000/012000/072001/012001/072002/012002/072003/012003/072004/012004/072005/012005/072006/01<strong>Reserve</strong>s6000400020000-2000-4000-60001993/011993/071994/011994/071995/011995/071996/011996/071997/01Change <strong>in</strong> US$ million1997/071998/011998/071999/011999/072000/012000/072001/012001/072002/012002/072003/012003/072004/012004/072005/012005/072006/01Source: SARB (2006), own calculationsUs<strong>in</strong>g the concept of <strong>in</strong>verse standard deviations as weights for the components of the EMP,<strong>in</strong>clud<strong>in</strong>g all three components, yields the EMP time series as shown <strong>in</strong> Figure 2.200Knedlik
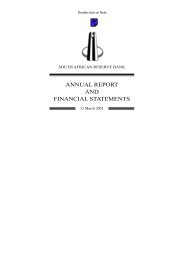
SARB Conference 2006Figure 2: EMP weighted accord<strong>in</strong>g to <strong>in</strong>verse standard deviationEMP121086<strong>in</strong>dex420-2-4-61993/011993/091994/051995/011995/091996/051997/011997/091998/051999/011999/092000/052001/012001/092002/052003/012003/092004/052005/012005/09Source: Own calculations based on SARB (2006)Higher values of the EMP <strong>in</strong>dex <strong>in</strong>dicate higher exchange market pressure. In order to identifycrisis periods a def<strong>in</strong>ition of the <strong>crises</strong> threshold is needed. Figure 3 shows two versions of crisisthresholds used <strong>in</strong> the literature (more can be found <strong>in</strong> the table <strong>in</strong> the appendix). The figureshows the values of the EMP <strong>in</strong>dex <strong>in</strong> each year and the different threshold <strong>in</strong>tervals. All datapo<strong>in</strong>ts of which the threshold <strong>in</strong>tervals lie completely above the zero l<strong>in</strong>e are called crisis months(<strong>in</strong>dicated by a black dot). In all cases the thresholds consist of the mean of the times seriesplus a vary<strong>in</strong>g multiple of the standard deviation (σ ).Figure 3 shows that <strong>in</strong>dicated crisis months decl<strong>in</strong>e with the <strong>in</strong>creas<strong>in</strong>g threshold. While <strong>in</strong>circumstances where the threshold is set at the mean of the EMP time series plus 1,645 timesthe standard deviation <strong>in</strong>dicates seven <strong>crises</strong> months, namely April and March 1996, May toAugust 1998, and December 2001. The <strong>in</strong>crease of the threshold to 3,0 times the standarddeviation leads to “los<strong>in</strong>g” March 1996, August 1998, and December 2001 as crisis months.Us<strong>in</strong>g a 25 percent annual depreciation of the exchange rate as an additional condition for<strong>currency</strong> <strong>crises</strong>, the crisis months would dim<strong>in</strong>ish to July and August 1998 and December 2001;furthermore 1996 would not be a crisis year any more. If the strict rule of 25 percent annualdepreciation is comb<strong>in</strong>ed with the “three sigma”-threshold condition, only one month is identifiedas a crisis month dur<strong>in</strong>g the period of observation: July 1998. Table 1 shows the depreciation ofthe exchange rate <strong>in</strong> percent of the pre-years value for the above identified potential crisismonths.Knedlik 201
SARB Conference 2006Figure 3: Currency <strong>crises</strong> <strong>in</strong> <strong>South</strong> <strong>Africa</strong>EMP 1.645 sigma121086420-2-4-6-8-101993/011993/091994/051995/011995/091996/051997/011997/091998/051999/011999/092000/052001/012001/092002/052003/012003/092004/052005/012005/09IndexEMP 3.0 sigma121086420-2-4-6-8-10-121993/011993/091994/051995/011995/091996/051997/011997/091998/051999/011999/092000/052001/012001/092002/052003/012003/092004/052005/012005/09IndexSource: Own calculation based on SARB (2006)Table 1: Annual depreciation of the rand/US$ exchange rate <strong>in</strong> selected monthsPotential crisis 1996/4 1996/5 1998/5 1998/6 1998/7 1998/8 2001/12monthDepreciation 16.,8% 23,6% 14,0% 19,2% 37,0% 35,0% 51,2%Source: SARB (2006), own calculationsThe stated shortcom<strong>in</strong>gs concern<strong>in</strong>g the precision weights for measur<strong>in</strong>g <strong>currency</strong> <strong>crises</strong> <strong>in</strong> thecase of fixed exchange rates can be translated to the <strong>South</strong> <strong>Africa</strong>n case. In this case it can becriticized that the more current <strong>crises</strong>, namely <strong>in</strong> the period after the decision of the Treasuryand the SARB <strong>in</strong> 2000 not to <strong>in</strong>tervene <strong>in</strong> the case of speculative pressure on the rand, maylead to an underestimation of <strong>currency</strong> <strong>crises</strong>. This can be expected because these later <strong>crises</strong>202Knedlik
SARB Conference 2006are supposed to just affect the exchange rate and not the policy <strong>in</strong>struments of <strong>in</strong>terest ratesand reserves. 12 Thus, if <strong>in</strong>terest rates and reserves used to be relatively stable, their weight <strong>in</strong>the EMP may be relatively high. S<strong>in</strong>ce <strong>in</strong>terest rates and reserves are not respond<strong>in</strong>g toexchange rate developments, their variations may overlay depreciation episodes which wouldhave otherwise been called <strong>currency</strong> <strong>crises</strong>. However, <strong>in</strong>terest rates may not be adjusted tocounteract speculative pressure but may be adjusted to avoid ris<strong>in</strong>g <strong>in</strong>flation due to <strong>in</strong>creas<strong>in</strong>gimport prices. Thus, a forward-look<strong>in</strong>g monetary policy-maker may still react <strong>in</strong> the case of anexpected depreciation of the rand by <strong>in</strong>creas<strong>in</strong>g <strong>in</strong>terest rates. Thus, it seems to be appropriateto calculate two other versions of the EMP, one sett<strong>in</strong>g the weight on reserves (γ ) to zero andanother sett<strong>in</strong>g the weights of reserves and <strong>in</strong>terest rates ( βγ) , to zero. Figure 4 shows thecase of an EMP only consist<strong>in</strong>g of percent changes <strong>in</strong> the exchange rate.Figure 4: EMP, βγ= , 0, 1.645 sigma thresholdEMP exchange rate, 1.645 sigma25201510Index50-5-10-15-201993/011993/091994/051995/011995/091996/051997/011997/091998/051999/011999/092000/052001/012001/092002/052003/012003/092004/052005/012005/092006/05Source: Own calculations based on SARB (2006)With this measure seven crisis months are identified which are, however, not <strong>in</strong> all casesidentical to the above ones. The crisis months similar to the above analysis are April 1996, July1998, December 2001, i.e. all major <strong>crises</strong> are <strong>in</strong>dicated by this method as well, although thecrisis duration is shorter. Additionally the method <strong>in</strong>dicates <strong>crises</strong> <strong>in</strong> May 2000, October 2001,January 2004, and June 2005. It is not surpris<strong>in</strong>g that more <strong>crises</strong> are <strong>in</strong>dicated for the pastcouple of years because of the above-mentioned change <strong>in</strong> policy. This version of the EMP<strong>in</strong>dex, <strong>in</strong>clud<strong>in</strong>g the exchange rate, can be employed us<strong>in</strong>g different thresholds. The results canbe seen <strong>in</strong> the annexure. Two <strong>crises</strong> months are left us<strong>in</strong>g the highest threshold of three timessigma plus the mean, which are July 1998 (aga<strong>in</strong>) and December 2001. Figure 5 shows thecase where just (γ ), the weight on reserves, is set at zero.12 <strong>South</strong> <strong>Africa</strong> saw a change <strong>in</strong> the exchange rate policy from exchange rate smooth<strong>in</strong>g between the times of SARBgovernors Stals (1999) and the <strong>in</strong>troduction of an <strong>in</strong>flation target<strong>in</strong>g regime <strong>in</strong> 2000 (Mboweni 2000). In 2001Governor Mboweni (2001) noted with regard to exchange rate volatility:” ... we have to live with it – sit tight, grit ourteeth and suffer <strong>in</strong> silence”.Knedlik 203
SARB Conference 2006Figure 5: EMP γ = 0 , 1,645 sigma thresholdEMP exchange rate and <strong>in</strong>terest rate, 1.645 sigma10864Index20-2-4-6-81993/011993/091994/051995/011995/091996/051997/011997/091998/051999/011999/092000/052001/012001/092002/052003/012003/092004/052005/012005/092006/05Source: Own calculations based on SARB (2006)The premise that <strong>in</strong>terest rates may <strong>in</strong>dicate current events as be<strong>in</strong>g <strong>in</strong> <strong>crises</strong>, s<strong>in</strong>ce they maynot react to the exchange rate developments but to expected <strong>in</strong>flation, could not be confirmed.The so-constructed EMP <strong>in</strong>dicates well-known months as <strong>crises</strong> months. The only exception isMay 1996, which is <strong>in</strong>dicated as a crisis month here and has not been identified as such before.This may be due to a late reaction of <strong>in</strong>terest rates respond<strong>in</strong>g to <strong>in</strong>flationary pressure <strong>in</strong> theaftermath of the March/April crisis of 1996.Crises dur<strong>in</strong>g the times of the <strong>in</strong>terventionist approach of the SARB may not have resulted <strong>in</strong>large changes <strong>in</strong> the exchange rate but may have been covered by <strong>in</strong>terventions <strong>in</strong> foreignexchangemarkets. To detect them Figure 6 shows an EMP <strong>in</strong>dex <strong>in</strong>clud<strong>in</strong>g only reserves.Figure 6: EMP, α, β = 0, 1.645 sigma thresholdEMP reserves, 1.645 sigma6000400020000-2000-4000-6000-80001993/011993/091994/051995/011995/091996/051997/011997/09Index1998/051999/011999/092000/052001/012001/092002/052003/012003/092004/052005/012005/092006/05Source: Own calculations based on SARB (2006)204Knedlik
SARB Conference 2006As expected the so-detected <strong>currency</strong> crisis months are concentrated <strong>in</strong> the first part of thesample. The picture shows that there have been crisis-significant <strong>in</strong>terventions <strong>in</strong> March, Julyand August 1994, which were not followed by significant depreciations and have therefore notbeen detected by the broader EMP approaches. However, these months are not called a crisisif the threshold is <strong>in</strong>creased to 2,5 times sigma (as can be seen from the table <strong>in</strong> the appendix).In 1996 there have been <strong>in</strong>terventions dur<strong>in</strong>g April (a month already detected as a crisis month)and October, a month so far seen as a po<strong>in</strong>t after the 1996 crisis. The <strong>in</strong>dications <strong>in</strong> 1998 areaga<strong>in</strong> <strong>in</strong> l<strong>in</strong>e with what has already been detected. After June 1998 no significant <strong>in</strong>terventioncould be observed.Us<strong>in</strong>g the 25 percent annual depreciation criterion as an additional condition for an event to becalled a <strong>currency</strong> crisis, the respective months are marked by an exclamation mark <strong>in</strong> theannexure. Of the so far detected potential crisis months, October 1996, July and August 1998,as well as December 2001 show depreciations of the exchange rate of above 25 percentcompared to the pre-year month.As a f<strong>in</strong>al measure for determ<strong>in</strong><strong>in</strong>g <strong>currency</strong> <strong>crises</strong> the simple method of requir<strong>in</strong>g a certa<strong>in</strong>current depreciation of the exchange rate is used. Brüggemann and L<strong>in</strong>ne (2002) use thecriterion of 20 percent depreciation with<strong>in</strong> ten trad<strong>in</strong>g days. Accord<strong>in</strong>g to this criterion only oneday dur<strong>in</strong>g the period of observation would be called a crisis: 20 December 2001, 21,30percent. 13To sum up, the results drawn from the different <strong>currency</strong> crisis identification frameworksdepicted <strong>in</strong> the table <strong>in</strong> the appendix show that there is just one crisis month, <strong>in</strong>dicated as suchby all versions of the EMP, and that is April 1996. This month, however, is not detected as acrisis month with use of all the thresholds. April 1996 is surrounded by two months that showsome <strong>in</strong>dications for <strong>crises</strong>. Also, <strong>in</strong> October there have been significant <strong>in</strong>terventions due toongo<strong>in</strong>g depreciation. Other prom<strong>in</strong>ent months are May and June 1998 (not detected by theEMP <strong>in</strong>clud<strong>in</strong>g exchange rates only) and July 1998 (not detected by the EMP <strong>in</strong>clud<strong>in</strong>g reservesonly) as well as December 2001 (obviously not detectable by the EMP <strong>in</strong>clud<strong>in</strong>g reserves only).The 1998 event is centered on June and July but surrounded by two months that show some<strong>in</strong>dication of <strong>currency</strong> <strong>crises</strong>. In 2001 the episode focuses very much on December with some<strong>in</strong>dications <strong>in</strong> October. The three events of April 1996, June/July 1998 and December 2001 can,with the back<strong>in</strong>g of the above analysis, be called <strong>currency</strong> <strong>crises</strong>.It is somewhat more questionable whether the 1994, the 2000, 2004, and 2005 episodes can becalled <strong>crises</strong>. The 1994 event shows some depreciation, which is low compared to the 1996,1998, and 2001 events. Interest rates had been ris<strong>in</strong>g as well, but the <strong>in</strong>creases of up to 1.1percentage po<strong>in</strong>ts have been relatively low. Only the reserves measure shows a severereaction <strong>in</strong> terms of the <strong>Reserve</strong> <strong>Bank</strong> with changes <strong>in</strong> reserves last observed e.g. <strong>in</strong> August1998. The impression from these figures is that the reaction of the <strong>Reserve</strong> <strong>Bank</strong> has beensuccessful <strong>in</strong> order to prevent a more serious depreciation and therefore a <strong>currency</strong> crisis. Thesuccessfully held elections <strong>in</strong> 1994 may have added to the stop of the depreciation episode.The episodes of 2000, 2004, and 2005 are more difficult to evaluate. The ma<strong>in</strong> concern is thepolicy switch, which can clearly be seen on the reserves chart <strong>in</strong> Figure 1. After the 1998 crisisthere have been no <strong>in</strong>terventions by the SARB that came close to the previously seen figures.As stated above, the SARB opted aga<strong>in</strong>st further <strong>in</strong>tervention <strong>in</strong> <strong>currency</strong> markets. Figure 7shows an EMP <strong>in</strong>dex <strong>in</strong>clud<strong>in</strong>g exchange rates, <strong>in</strong>terest rates and reserves calculated us<strong>in</strong>gdata from 1998/12 onwards.13 The daily exchange rate data are provided by Datastream.Knedlik 205
SARB Conference 2006Figure 7: EMP (1998/12 to 2006/5) 1,645 sigma thresholdEMP exchange rates, <strong>in</strong>terest rates, reserves, 1.645 sigma86420-2-4-6-8-101998/121999/041999/081999/122000/042000/082000/122001/042001/082001/122002/042002/082002/122003/042003/082003/122004/042004/082004/122005/042005/082005/122006/04EMP exchange rates, 1.645 sigma2520151050-5-10-15-201998/121999/051999/102000/032000/08Index2001/012001/062001/112002/042002/092003/022003/072003/122004/052004/102005/032005/082006/01Source: Own calculations based on (SARB 2006)The figure shows that a limitation of the sample period leads to two newly detected crisismonths us<strong>in</strong>g the EMP <strong>in</strong>dex <strong>in</strong>clud<strong>in</strong>g all three measures: April 2000 and January 2004. Whentak<strong>in</strong>g out the more extreme events of the 1990s the chart leads to an identification of events as<strong>crises</strong> that were formerly hidden by those events. However, the second chart of Figure 7 showsthat the <strong>in</strong>creased volatility <strong>in</strong> exchange rates (see also Figure 1) leads to fewer detected <strong>crises</strong>via the exchange rate alone (EMP) as compared to Figure 4 (the 2004 event is not detected asa crisis here). What is also evident from the above figures is that May 2006, the last dot <strong>in</strong> thecharts, is not identified as a <strong>currency</strong> crisis month even though it was discussed as be<strong>in</strong>g aserious event (the June 2006 data are still not available at the time of writ<strong>in</strong>g).It can be concluded that for no post-1998 event, except for the episode <strong>in</strong> 2001, there has beenenough evidence for it to be called a <strong>currency</strong> crisis. In the follow<strong>in</strong>g sections the events of1996, 1998 and 2001 are considered <strong>currency</strong> <strong>crises</strong>. The rema<strong>in</strong>der of this section discussesshortcom<strong>in</strong>gs and criticisms of detect<strong>in</strong>g <strong>currency</strong> <strong>crises</strong> by the methods employed above.206Knedlik
SARB Conference 2006If it is assumed that the data po<strong>in</strong>ts of the time series can be described as normally distributed,the calculation of <strong>crises</strong> thresholds will almost certa<strong>in</strong>ly lead to the identification of some eventsas <strong>currency</strong> <strong>crises</strong>, depend<strong>in</strong>g on the heights of the threshold. The version prom<strong>in</strong>ently used <strong>in</strong>the graphical analysis above was a threshold of the mean of the time series plus 1,645 itsstandard deviation. That threshold is used, <strong>in</strong> l<strong>in</strong>e with e.g. Bhundia and Ricci (2005: 157) andCaramazza et al. (2000), because it will identify five percent of the months as crisis months(outly<strong>in</strong>g of a one-sided 95 percent confidence <strong>in</strong>terval) if the time series is normally distributed.Obviously discrete changes <strong>in</strong> the threshold lead to more, or less, detected <strong>crises</strong>. It is also forthat reason that the crisis identification by this measure is largely method dependent. As seenabove, the crisis detection is also dependent on the sample period and the weights of the threemeasures <strong>in</strong> the <strong>in</strong>dex. Additional conditions, such as an additional annual depreciationcriterion, counteract the potential identification of <strong>crises</strong> <strong>in</strong> periods where there have not beenany serious events. However, depend<strong>in</strong>g on the threshold of this criterion, more or less <strong>crises</strong>are identified and the criterion may let <strong>crises</strong>, <strong>in</strong> which the depreciation has been held <strong>in</strong> checkby <strong>in</strong>terventions <strong>in</strong> money or foreign-exchange markets, go undetected. Thus, the technicalanalysis of EMP <strong>in</strong>dex figures cannot be a substitute for careful economic analysis of events. Itmay also be worthwhile to look at the impact of episodes on <strong>currency</strong> markets on othermacroeconomic aggregates such as <strong>in</strong>flation and economic growth, which may be closer toeconomic wealth and can therefore be a better <strong>in</strong>dicator of whether a certa<strong>in</strong> event is a crisis ornot.The results of the analysis above (April 1996, June/July 1998, December 2001) are still used <strong>in</strong>the rema<strong>in</strong>der of the paper, s<strong>in</strong>ce the f<strong>in</strong>d<strong>in</strong>gs are <strong>in</strong> l<strong>in</strong>e with what had already been detectedas <strong>currency</strong> <strong>crises</strong> <strong>in</strong> the literature.<strong>Signal<strong>in</strong>g</strong> <strong>currency</strong> <strong>crises</strong> – a literature reviewThe theoretical literature on <strong>currency</strong> <strong>crises</strong> is centered on the paradigm of the threegenerations of <strong>currency</strong> crisis models. The first generation, owed to Krugman (1979) and Floodand Garber (1984), describes <strong>currency</strong> <strong>crises</strong> as speculative attacks which result from monetaryor fiscal policies that were not <strong>in</strong> l<strong>in</strong>e with a fixed exchange rate target. The run on foreign<strong>currency</strong>reserves occurred because market participants could foresee the depreciation andtried to avoid losses. The models described the <strong>currency</strong> <strong>crises</strong> of the 1970s and 1980s <strong>in</strong> Lat<strong>in</strong>America. The second generation, based on Obstfeld (1986), stresses the trade-off between thecentral banks’ <strong>in</strong>tentions to target a fixed exchange rate and to follow other policy targets, e.g. toachieve low levels of unemployment. If speculators assume that the policy response could bedevaluation, the event may become self-fulfill<strong>in</strong>g without (<strong>in</strong> contrast to first generation models)worsen<strong>in</strong>g economic fundamentals. The models addressed, for example, the EMS <strong>crises</strong> <strong>in</strong>Europe. Third-generation models stress the connection between bank<strong>in</strong>g and <strong>currency</strong> <strong>crises</strong>,and address problems such as contagion of <strong>crises</strong> and herd effects. These models weredeveloped <strong>in</strong> response to the Asian crisis of 1997/1998.The empirical literature on signal<strong>in</strong>g or forecast<strong>in</strong>g <strong>currency</strong> <strong>crises</strong> is based on the theorytransmission processes described above, but approaches vary with regard to the employedtechniques. Standard approaches are bivariate Logit/Probit models and signals approaches asdeveloped by Kam<strong>in</strong>sky and Re<strong>in</strong>hart (1996, 1998). 14 Logit/Probit models use the bivariatevariable crisis/no crisis as endogenous variable and estimate the impact of different sets ofexplanatory variables. 15 Signals approaches are non-parametric approaches that exam<strong>in</strong>e thebehavior of potential explanatory variables prior to the detected <strong>crises</strong> and compare it with non<strong>crises</strong>periods. If some of the variables pass a certa<strong>in</strong> threshold their changes are used as crisissignals. 16 Besides these two techniques, further concepts are outl<strong>in</strong>ed <strong>in</strong> the literature. These<strong>in</strong>clude artificial neural networks (ANN), the advantage of which is the reflection of complex14 For a more detailed survey on Early-Warn<strong>in</strong>g Systems presented <strong>in</strong> this section see Abiad (2003).15 Examples <strong>in</strong>clude Berg and Pattillo (1999b), Kam<strong>in</strong>, Sch<strong>in</strong>dler and Samuel (2001), and Kumar, Moorthy andPerraud<strong>in</strong> (2002).16 See Brüggemann and L<strong>in</strong>ne (2002). Other examples <strong>in</strong>clude Berg and Pattillo (1999b), and Edison (2000).Knedlik 207
SARB Conference 2006<strong>in</strong>teraction between the variables; 17 value-at-risk models, expos<strong>in</strong>g several factors of risk to theability of central banks to target a fixed exchange rate; 18 restricted VAR models; 19 and Markovswitch<strong>in</strong>gapproaches, which do not depend on an a priori def<strong>in</strong>ition of <strong>crises</strong>. 20This paper largely follows the signals approach as developed by Brüggemann and L<strong>in</strong>ne (2002),which is generally based upon Kam<strong>in</strong>sky and Re<strong>in</strong>hart (1996, 1998). The signals approach isused because of its simple applicability and because it was found to outperform alternatives. 21The rema<strong>in</strong>der of this section is devoted to the used method, which is used <strong>in</strong> the subsequentsection to calculate the country specific <strong>currency</strong> crisis signals <strong>in</strong> <strong>South</strong> <strong>Africa</strong>.The first step <strong>in</strong> employ<strong>in</strong>g a signals approach is to def<strong>in</strong>e <strong>currency</strong> <strong>crises</strong> <strong>in</strong> the period ofobservation. This has been undertaken <strong>in</strong> the previous section. The second step is to identifypotential explanatory variables, which may send signals for <strong>currency</strong> <strong>crises</strong>. These variablesshould be derived from theories about <strong>currency</strong> <strong>crises</strong>. Variables which may have an <strong>in</strong>fluenceon the occurrence of <strong>currency</strong> <strong>crises</strong> <strong>in</strong> <strong>South</strong> <strong>Africa</strong>, are identified <strong>in</strong> the next section. The thirdstep is to generate appropriate time series, as well as to decide on a sample period and datafrequency. The fourth step is to decide on the crisis w<strong>in</strong>dow, i.e. the time prior to a crisis <strong>in</strong>which the variables are expected to send their signals. The literature uses different sampleperiods and data frequencies; most common are sample periods start<strong>in</strong>g <strong>in</strong> the 1980s or 1990sand monthly data frequency. 22 The time-w<strong>in</strong>dow spans from 18 to 24 months. 23The fifth step is to calculate <strong>in</strong>dividual crisis thresholds for each variable, which cuts tranquilperiods from <strong>crises</strong> periods. The difficulty lies <strong>in</strong> the problem that the threshold should neitherbe too high (and probably not detect <strong>crises</strong>) nor too low (and probably raise a false alarm). The<strong>in</strong>strument to detect the optimal threshold has to m<strong>in</strong>imise the noise-to-signal ratio: 24ω =jB ( B+D)A ( A+C)(4)Whereby A is the number of months a good signal was sent (a crisis is correctly signaled), B isthe number of months a false alarm signal was sent, C is the number of months <strong>in</strong> which nosignal was sent but a crisis followed, D is the number of months <strong>in</strong> which no signal was sent andno crisis followed. In other words, the noise-to-signal ratio is the ratio between false alarms aspart of non-crisis follow<strong>in</strong>g months and good signals as part of crisis-follow<strong>in</strong>g months. Thenoise-to-signal ratio is calculated with different crisis thresholds rang<strong>in</strong>g from 5 to 30 percent or70 to 95 percent of the distribution, depend<strong>in</strong>g on the expected impact of the variable for eachmeasure. The thresholds yield<strong>in</strong>g the best fit or lowest noise-to-signal ratios are used <strong>in</strong> thefurther calculation of the signals approach. Indicators which produce more false alarms thangood signals, i.e. those hav<strong>in</strong>g a noise-to-signal ratio of above one, are excluded from furtheranalysis.The sixth step is the calculation of a composite <strong>in</strong>dicator. Follow<strong>in</strong>g Brüggemann and L<strong>in</strong>ne(2002) the signals approach is extended by <strong>in</strong>troduc<strong>in</strong>g a second threshold <strong>in</strong> order todiscrim<strong>in</strong>ate weak from strong signals, and by consider<strong>in</strong>g the tim<strong>in</strong>g of a signal (i.e. morecurrent signals are higher weighted <strong>in</strong> the composite <strong>in</strong>dicator). The weight<strong>in</strong>g of the s<strong>in</strong>gle<strong>in</strong>dicators accord<strong>in</strong>g to their prognostic quality is <strong>in</strong> l<strong>in</strong>e with standard literature.17 E.g. Nag and Mitra (1999) Peltonen (2006).18 E.g. Blejer and Schumacher (1999).19 E.g. Krkoska (2001).20 E.g. Abiad (2003). The author provides further examples of techniques of Early warn<strong>in</strong>g systems.21 Abiad (2003: 3).22 Abiad (2003: 9).23 See for example Brüggemann and L<strong>in</strong>ne (2002: 9) and Kam<strong>in</strong>sky, Lizondo and Re<strong>in</strong>hart (1998: 17), respectively.24 See Brüggemann and L<strong>in</strong>ne (2002: 10).208Knedlik
SARB Conference 2006The three stages of calculation are conducted by first calculat<strong>in</strong>g the second threshold, which isdone by halv<strong>in</strong>g the percentile of the frequency distribution which was calculated for the firstthreshold. If a s<strong>in</strong>gle <strong>in</strong>dicator rema<strong>in</strong>s below its first threshold it takes the value of zero, if itpasses the first threshold its value is def<strong>in</strong>ed as one, if it passes the second threshold its valueis def<strong>in</strong>ed as two:⎧ 0 I < Tj jt 1j ⎪j j jt= ⎨11≤t
SARB Conference 2006are not applicable, monthly time series are constructed by averag<strong>in</strong>g weekly data or by<strong>in</strong>terpolat<strong>in</strong>g mov<strong>in</strong>g averages from quarterly data. All data are sign-adjusted <strong>in</strong> order togenerate time series <strong>in</strong>dicat<strong>in</strong>g <strong>in</strong>creas<strong>in</strong>g pressure when their value rises. Data sources arepredom<strong>in</strong>antly the SARB or the Federal <strong>Reserve</strong> and Bureau of Labor Statistics <strong>in</strong> the US. A 24-month crisis w<strong>in</strong>dow is chosen <strong>in</strong> the analysis and an 18-months crisis w<strong>in</strong>dow is used to test forthe robustness of the result. Data up to August 2004 are used for the calculation of the noise-tosignalratio, s<strong>in</strong>ce it is unknown whether the time after that date may be followed by a crisis or not.The data sources of the set of variables used <strong>in</strong> signal<strong>in</strong>g <strong>currency</strong> <strong>crises</strong>, can be expla<strong>in</strong>ed asfollows:(1) As <strong>in</strong>dustrial production variable, the growth rate of gross value added at basic prices ofthe secondary sector (KBP6633D) is used and monthly data are generated by<strong>in</strong>terpolation. The measure shows a m<strong>in</strong>imal noise-to-signal ratio at a threshold of 25percent, which takes a value of 2,32. Thus, <strong>in</strong>dustrial production sends more falsealarms than good signals and is not considered <strong>in</strong> the composite <strong>in</strong>dex.(2) The ratio of budget deficits to GDP (KBP4420K) is constructed by <strong>in</strong>terpolation fromquarterly data and a calculation of the annual change. The <strong>in</strong>dicator shows more goodthan false signals; the noise-to-signal ratio is 0,90.(3) The appreciation of the real exchange rate is measured as an annual change <strong>in</strong> the realeffective exchange rate of the rand consistently, exclud<strong>in</strong>g Zimbabwe (KBP5367M). Themeasure shows the lowest noise-to-signal ratio at the 30 percent threshold and takes avalue of 2,08, which signifies that the measure is not a useful <strong>in</strong>dicator.(4) The change <strong>in</strong> the <strong>in</strong>ternational liquidity position (KBP5339M) is a good <strong>in</strong>dicator with am<strong>in</strong>imal noise-to-signal ratio of 0,12 at the 5 percent threshold.(5) The growth rate of merchandise exports (KBP5000K) is calculated by <strong>in</strong>terpolation fromquarterly data and sends just one good signal at the 30 percent threshold. The noise-tosignalratio of 36,0 is out of reach for use as <strong>in</strong>dicator. It was expected that fall<strong>in</strong>gexports would <strong>in</strong>crease the probability of a crisis, as <strong>in</strong>vestors may expect problems <strong>in</strong>servic<strong>in</strong>g foreign debt if exports earn<strong>in</strong>gs shr<strong>in</strong>k and withdraw.(6) Also, the growth rate of merchandise imports (KBP5003K) is calculated by <strong>in</strong>terpolationfrom monthly data. At a 25 percent threshold the noise-to-signal ratio is 0,44, show<strong>in</strong>gthat ris<strong>in</strong>g imports are a good <strong>in</strong>dicator of <strong>currency</strong> <strong>crises</strong> <strong>in</strong> <strong>South</strong> <strong>Africa</strong>.(7) The growth rate of the ratio of domestic credit to GDP is calculated from credit extension(KBP1368M) and <strong>in</strong>terpolated GDP (KBP6006K) figures. The m<strong>in</strong>imal noise-to-signalratio of 0,68, at a threshold of 30 percent, shows that the variable is a good <strong>in</strong>dicator of<strong>currency</strong> <strong>crises</strong>.(8) The growth rate of the ratio of M2 to <strong>currency</strong> reserves is calculated from M2(KBP1373M), gold and other foreign reserves (KBP5806M), and the US$ exchange rate(KBP5339M). The m<strong>in</strong>imal noise-to-signal ratio of 2,77 shows this not to be a useful<strong>in</strong>dicator.(9) The change <strong>in</strong> the domestic <strong>in</strong>terest rate is calculated by subtract<strong>in</strong>g the <strong>in</strong>flation rate(KBP7032A) from the <strong>in</strong>terpolated discount rate on 91-day Treasury bills (KBP1405W).The <strong>in</strong>dicator produces more good than bad signals; the ratio is 0,97 at a threshold of 10percent.(10) The <strong>in</strong>terest rate differential to the US is calculated be subtract<strong>in</strong>g the <strong>in</strong>flation correcteddiscount rate on 3-month US Treasury bills from the domestic <strong>in</strong>terest rate. The variabledoes not <strong>in</strong>dicate <strong>currency</strong> <strong>crises</strong> properly; the noise-to-signal ratio is 2,63 at the 30percent threshold.210Knedlik
SARB Conference 2006(11) The growth rate of bank deposits is calculated by the use of bank deposits of resident<strong>in</strong>dividuals (KBP1148M). The <strong>in</strong>dicator is useful, show<strong>in</strong>g a ratio of 0,54 at the 5 percentthreshold.(12) The growth rate of foreign debt of the government is calculated from the total foreigndebt of central government denom<strong>in</strong>ated <strong>in</strong> foreign currencies (KBP4451M) time series.The <strong>in</strong>dicator shows more good than bad signals, with a ratio of 0,65 at the 30 percentthreshold.(13) The ratio of lend<strong>in</strong>g to deposit rates is calculated by divid<strong>in</strong>g <strong>in</strong>terest rates on mortgageloans (KBP2012M) by the <strong>in</strong>terest rate on one-year fixed deposits (KBP2007M). Themeasure sent slightly more bad than good signals with a ratio of 1,09 and is thereforenot an <strong>in</strong>dicator of <strong>currency</strong> <strong>crises</strong>.(14) The <strong>in</strong>flation differential to the US is calculated by subtract<strong>in</strong>g US <strong>in</strong>flation rates fromchanges <strong>in</strong> the <strong>South</strong> <strong>Africa</strong>n consumer price <strong>in</strong>dex (KBP7032A). The noise-to-signalratio of 1,84 <strong>in</strong>dicates that the variable is not an appropriate <strong>in</strong>dicator of <strong>currency</strong> <strong>crises</strong>.(15) Changes <strong>in</strong> the gold price are calculated from the London gold price <strong>in</strong> US$(KBP5357M). As expected, the change <strong>in</strong> gold price is a good <strong>in</strong>dicator of <strong>currency</strong><strong>crises</strong> <strong>in</strong> <strong>South</strong> <strong>Africa</strong> show<strong>in</strong>g a m<strong>in</strong>imal noise-to-signal ratio of 0,14 at the 10 percentthreshold.The noise-to-signal ratios of all variables are summarized <strong>in</strong> Figure 8.Figure 8: Noise-to-signal ratios with 24-month time w<strong>in</strong>dowsInternational LiquidityGold PriceImports<strong>Bank</strong> DepositsForeign DebtCredit to GDPBudget DeficitInterest RateLend<strong>in</strong>g to Deposit RatesInflation DifferentialAppreciationIndustrial ProductionInterest Rate DifferentialM2 to <strong>Reserve</strong>sExportsNoise-to-signal ratio0 1Source: Own calculationsIn summary, eight <strong>in</strong>dicators are left for calculat<strong>in</strong>g the composite <strong>in</strong>dex. As stated above, thearea outly<strong>in</strong>g the one-sided confidence <strong>in</strong>terval is halved to calculate the second thresholds.Us<strong>in</strong>g Equation 5, first and second threshold signals are generated from each <strong>in</strong>dicator. Thenthe mov<strong>in</strong>g time w<strong>in</strong>dows for each <strong>in</strong>dicator are calculated (Equation 6) and the Z-values of the<strong>in</strong>dicators accord<strong>in</strong>g to their <strong>in</strong>verse noise-to-signal ratio are aggregated to derive a composite<strong>in</strong>dicator (Equation 7). The result is displayed <strong>in</strong> Figure 9. The dots on the l<strong>in</strong>e highlight thecrisis months.Knedlik 211
SARB Conference 2006Figure 9: Composite <strong>in</strong>dex of <strong>currency</strong> crisis signalsComposite <strong>in</strong>dex60504030201001994/011994/071995/011995/071996/011996/071997/011997/071998/011998/071999/011999/072000/012000/072001/012001/072002/012002/072003/012003/072004/012004/072005/012005/072006/01Source: Own calculationsWhile the <strong>in</strong>dex itself can be used to observe changes <strong>in</strong> the <strong>in</strong>tensity of <strong>currency</strong> crisis signals,the level of the <strong>in</strong>dex cannot be <strong>in</strong>terpreted. Thus, it is not possible to draw <strong>in</strong>ferences on theprobability of <strong>currency</strong> <strong>crises</strong> from the <strong>in</strong>dex. Therefore, follow<strong>in</strong>g Brüggemann and L<strong>in</strong>ne (2002)and Edison (2000) conditional probabilities for <strong>currency</strong> <strong>crises</strong> are calculated:P( <strong>crises</strong> CI ≤ CI < CI ) =t, t+18 l t u∑# months for CI ≤ CI < CI and crisis follows∑l t u# months for CI ≤ CI < CIl t u(8)For each <strong>in</strong>terval between a lower and an upper limit (<strong>in</strong> our case <strong>in</strong>tervals of 10) the conditionalprobability is calculated. This conditional probability is the probability of a crisis occurr<strong>in</strong>g with<strong>in</strong>24 months under the condition that the <strong>in</strong>dicator ranges between the lower and the upper band.The conditional probabilities are reported <strong>in</strong> Table 2.Table 2: Conditional probabilities of <strong>currency</strong> <strong>crises</strong> <strong>in</strong> <strong>South</strong> <strong>Africa</strong>Interval 0-10 10-20 20-30 30-40 40-50 UnconditionalProbability 0,17 0,52 0,60 0,83 1 0,57Source: Own calculationsFor example, the probability of a <strong>currency</strong> crisis is 0,83 if the <strong>in</strong>dex shows a value of between 30and 40, which is well above the general probability of a <strong>currency</strong> crisis to occur follow<strong>in</strong>g anymonth of the sample (0,57). Figure 10 shows a graph where the probabilities are attributed tothe respective months.Figure 10: Conditional probabilities of <strong>currency</strong> <strong>crises</strong> <strong>in</strong> <strong>South</strong> <strong>Africa</strong>Conditional probabilities10.80.60.40.201994/011994/071995/011995/071996/011996/071997/011997/071998/011998/071999/011999/072000/012000/072001/012001/072002/012002/072003/012003/072004/012004/072005/012005/072006/01Source: Own calculations. Note: Dotted l<strong>in</strong>e shows unconditional probability212Knedlik
SARB Conference 2006To test for the robustness of the composite <strong>in</strong>dicator of <strong>currency</strong> <strong>crises</strong>, as derived by thesignals approach, the procedure is repeated for the case of an 18-month time w<strong>in</strong>dow. Thenoise-to-signal ratios are reported <strong>in</strong> Figure 11. Notable is the change <strong>in</strong> the relevant <strong>in</strong>dicators.Only six <strong>in</strong>dicators send<strong>in</strong>g more positive than false signals are left, while credit to GDP andbank deposits are not considered <strong>in</strong> the 18-month case.Figure 11: Noise-to-signal ratios with 18-month time w<strong>in</strong>dowsNoise-to-signal ratioGold PriceInternational LiquidityImportsInterest RateBudget DeficitForeign DebtCredit to GDPAppreciationIndustrial ProductionInflation DifferentialLend<strong>in</strong>g to Deposit Rates<strong>Bank</strong> DepositsInterest Rate DifferentialM2 to <strong>Reserve</strong>sExports2.592.757.7621.30 1Source: Own calculationsThe respective composite <strong>in</strong>dices are shown <strong>in</strong> Figure 12.Figure 12: Composite <strong>in</strong>dicator with 18-month time w<strong>in</strong>dowsComposite <strong>in</strong>dex7060504030201001994/011994/071995/011995/071996/011996/071997/011997/071998/011998/071999/011999/072000/012000/072001/012001/072002/012002/072003/012003/072004/012004/072005/012005/072006/01Source: Own calculationsThe conditional probabilities for the 18-month time w<strong>in</strong>dow case are shown <strong>in</strong> Figure 13 on thefollow<strong>in</strong>g page.Knedlik 213
SARB Conference 2006Figure 13: Conditional probabilities with 18-month time w<strong>in</strong>dowConditional probabilities10.80.60.40.201994/011994/071995/011995/071996/011996/071997/011997/071998/011998/071999/011999/072000/012000/072001/012001/072002/012002/072003/012003/072004/012004/072005/012005/072006/01Source: Own calculations. Note: Dotted l<strong>in</strong>e shows unconditional probabilityWhile some difference between the composite <strong>in</strong>dices and the respective conditionalprobabilities can be observed, the general picture rema<strong>in</strong>s the same after chang<strong>in</strong>g the timew<strong>in</strong>dow. While the <strong>in</strong>dex provides <strong>in</strong>dications of the 1996, and <strong>in</strong> particular the 1998, crisis, itfails to clearly <strong>in</strong>dicate 2001 as a crisis. For the time after 2001 there exists no <strong>in</strong>dication ofextraord<strong>in</strong>ary risk of <strong>currency</strong> <strong>crises</strong>. However, as the figure of the unconditional probabilities for<strong>currency</strong> <strong>crises</strong> shows, the overall risk that any month of the period of observation is followed bya crisis with<strong>in</strong> 24 or 18 months is 0,57 or 0,43, respectively. Thus, the risk of <strong>currency</strong> <strong>crises</strong> isthere and the change <strong>in</strong> policy <strong>in</strong> <strong>South</strong> <strong>Africa</strong> resulted <strong>in</strong> less <strong>in</strong>dicated crisis probability due toless risk or to lesser <strong>in</strong>dication of risk.ConclusionThe evaluation of the risk of <strong>currency</strong> <strong>crises</strong> <strong>in</strong> <strong>South</strong> <strong>Africa</strong> by the use of a signals approach,consider<strong>in</strong>g the crisis episodes of 1996, 1998 and 2001 as reference, <strong>in</strong>dicates low current riskfor <strong>currency</strong> <strong>crises</strong>. The approach leads to a correct prediction of the <strong>currency</strong> <strong>crises</strong> of 1996and 1998, but fails to predict the <strong>currency</strong> crisis of 2001. The chang<strong>in</strong>g nature of <strong>currency</strong> <strong>crises</strong>and the change <strong>in</strong> exchange rate policy of the SARB suggest that <strong>crises</strong> of the 2001-type aremore likely to occur <strong>in</strong> future than <strong>crises</strong> of the 1996/1998-type. The crisis <strong>in</strong>dicator, asdeveloped above, must therefore be treated with caution and should be updated frequently. Ashift <strong>in</strong> the period of observation can lead to the detection of new <strong>crises</strong>, previously notconsidered as <strong>crises</strong> and also to a failure of detect<strong>in</strong>g events previously called a crisis. Thechang<strong>in</strong>g volatility of potential signal variables may lead to different signal thresholds and to the<strong>in</strong>clusion or exclusion of variables <strong>in</strong> the composite <strong>in</strong>dex and may therefore change not onlythe <strong>in</strong>dex itself but also the calculated conditional probabilities of <strong>crises</strong>. Further research on<strong>South</strong> <strong>Africa</strong>n <strong>currency</strong> crisis risk should also consider the use of other methods as has beenmentioned <strong>in</strong> the section “Signall<strong>in</strong>g <strong>currency</strong> <strong>crises</strong> – a literature review”.ReferencesAbiad, A. 2003. Early-Warn<strong>in</strong>g Systems: A Survey and a Regime-Switch<strong>in</strong>g Approach. IMFWork<strong>in</strong>g Paper. 03/32. Wash<strong>in</strong>gton: International Monetary Fund.Ahluwalia, P. 2000. Discrim<strong>in</strong>at<strong>in</strong>g Contagion – An Alternative Explanation of ContagiousCurrency Crises <strong>in</strong> Emerg<strong>in</strong>g Markets. IMF Work<strong>in</strong>g Paper WP/00/14, International MonetaryFund.Angk<strong>in</strong>and, A, Li, J and Willett, T. 2006. Measures of Currency Crises: A Survey. Forthcom<strong>in</strong>g<strong>in</strong>: International Interaction.Aron, J and Muellbauer, J. 2000. Estimat<strong>in</strong>g Monetary Policy Rules for <strong>South</strong> <strong>Africa</strong>. Central<strong>Bank</strong> of Chile. Work<strong>in</strong>g Papers 89.214Knedlik
SARB Conference 2006Aron, J and Muellbauer, J. 2005. Review of Monetary Policy <strong>in</strong> <strong>South</strong> <strong>Africa</strong> dur<strong>in</strong>g 1994-2004.Conference Paper. Stellenbosch.at: http://akadweb.sun.ac.za/economics/econconf/programme.htm [22.08.2006].Aziz, J, Caramazza, F and Salgano, R. 2000. Currency Crises: In Search of Common Elements.IMF Work<strong>in</strong>g Paper WP/00/67, International Monetary Fund.Berg, A and Pattillo, C. 1999a. Are Currency Crises Predictable? A Test. IMF Staff Papers,International Monetary Fund, 46(2), 107-138.Berg, A and Pattillo, C. 1999b. Predict<strong>in</strong>g Currency Crises: The Indicators Approach and anAlternative. Journal of International Money and F<strong>in</strong>ance 18(August), 561-86.Bhundia, A J and Ricci, L A. 2005. The Rand Crises of 1998 and 2001: What have we learned?In Nowak, M and Ricci, L A (eds). Post-Apartheid <strong>South</strong> <strong>Africa</strong>: The first ten years, 156-173.Wash<strong>in</strong>gton, DC: International Monetary Fund.Blejer, M I and Schumacher, L. 1999. Central <strong>Bank</strong> Vulnerability and the Credibility ofCommitments: A Value-at-Risk Approach to Currency Crises. IMF Work<strong>in</strong>g Paper 98/65.Wash<strong>in</strong>gton, DC: International Monetary Fund.Bordo, M, Eichengreen, B, Kl<strong>in</strong>gebiel, D and Mart<strong>in</strong>ez-Peria, M S. 2001. F<strong>in</strong>ancial Crises:Lessons From the Last 120 Years. Economic Policy (April), 53-82.Brüggemann, A and L<strong>in</strong>ne, T. 2002. Are the Central and Eastern European Transition Countriesstill vulnerable to a F<strong>in</strong>ancial Crisis? Results from the Signals Approach. IWH DiscussionPapers, 157.Bubula, A and Otker-Robe, I. 2003. Are Pegged and Intermediate Exchange Rate RegimesMore Crisis Prone? IMF Work<strong>in</strong>g Paper WP/03/223, International Monetary Fund.Calvo, G A and Re<strong>in</strong>hart, C M. 1999. When Capital Inflows Come to a Sudden Stop:Consequences and Policy Options”, at:http://www.puaf.umd.edu/faculty/papers/re<strong>in</strong>hart/imfbook.pdf [04.08.2003].Caramazza, F, Ricci, L and Salgado, R. 2000. Trade and F<strong>in</strong>ancial Contagion <strong>in</strong> CurrencyCrises. IMF Work<strong>in</strong>g Paper 00/55. Wash<strong>in</strong>gton: International Monetary Fund.Edison, H. 2000. Do Indicators of F<strong>in</strong>ancial Crises Work? An Evaluation of an Early Warn<strong>in</strong>gSystem. Board of Governors of the Federal <strong>Reserve</strong> System. International F<strong>in</strong>ance DiscussionPapers, 675. 1-74.Eichengreen, B, Rose, A and Wyplosz, C. 1996. Contagious Currency Crises: First Tests. InScand<strong>in</strong>avian Journal of Economics, 98(4), 468-484.Flood, R and Garber, P. 1984. Collaps<strong>in</strong>g exchange rate regimes, some l<strong>in</strong>ear examples.Journal of International Economics, 17, 1-13.Gerber, J. 2002. International Economics. International Edition. 2 nd ed. Boston: Pearson Education.Girton, L and Roper, D. 1997. A Monetary Model of Exchange Market Pressure Applied to thePostwar Canadian Experience. American Economic Review, 67, 537-548.Glick, R and Hutchison, M M. 2001. <strong>Bank</strong><strong>in</strong>g and Currency Crises: How Common Are Tw<strong>in</strong>s?.In Glick, R, Moreno, R and Spiegel, M M (eds.): F<strong>in</strong>ancial Crises <strong>in</strong> Emerg<strong>in</strong>g Markets.Cambridge University Press: Cambridge.Knedlik 215
SARB Conference 2006International Monetary Fund. 1998. World Economic Outlook. Wash<strong>in</strong>gton, DC: InternationalMonetary Fund.Kam<strong>in</strong>, S, Sch<strong>in</strong>dler, J and Samuel, S. 2001. The Contributions of Domestic and ExternalFactors to Emerg<strong>in</strong>g Market Devaluation Crises: An Early Warn<strong>in</strong>g Systems Approach. Board ofGovernors of the Federal <strong>Reserve</strong> System. International F<strong>in</strong>ance Discussion Papers, 711.Kam<strong>in</strong>sky, G L and Re<strong>in</strong>hart, C M. 1996. The Tw<strong>in</strong> Crises: The Causes of <strong>Bank</strong><strong>in</strong>g andBalance-of-Payments Problems. Board of Governors of the Federal <strong>Reserve</strong> System.International F<strong>in</strong>ance Discussion Papers, 544.Kam<strong>in</strong>sky, G L and Re<strong>in</strong>hart, C M. 1999. The Tw<strong>in</strong> Crises: Causes of <strong>Bank</strong><strong>in</strong>g and Balance-of-Payments Crises. American Economic Review, 89(3), 473-500.Kam<strong>in</strong>sky, G L, Lizondo, S and Re<strong>in</strong>hart, C M. 1998. Lead<strong>in</strong>g Indicators of Currency Crises.IMF Staff Papers, 45(1).Krkoska, L. 2001. Assess<strong>in</strong>g Macroeconomic Vulnerability <strong>in</strong> Central Europe. Post CommunistEconomies, 13(1), 41-55.Krugman, P. 1979. A model of balance-of-payment <strong>crises</strong>. Journal of Money, Credit and<strong>Bank</strong><strong>in</strong>g, 11, 311-325.Kumar, M, Moorthy, U and Perraud<strong>in</strong>, W. 2002. Predict<strong>in</strong>g Emerg<strong>in</strong>g Market Currency Crashes.IMF Work<strong>in</strong>g Paper 02/07. Wash<strong>in</strong>gton, DC: International Monetary Fund.Mboweni, T T. 2000. A New Monetary Policy Framework. Statement by the Governor of theSARB. Annex to the Statement of the Monetary Policy Committee. 06.04.2000 at:http://www.resbank.co.za/<strong>in</strong>ternet/publication.nsf [29.07.2003].Mboweni, T T. 2001. Volatility <strong>in</strong> Currency Markets and its Impact on Monetary Policy. Addressby the Governor of the SARB. 14. May 2001 at:http://www.resbank.co.za/Address/2001/14052001.html [19.10.2001].Moreno, R. 2000. Pegg<strong>in</strong>g and Macroeconomic Performance <strong>in</strong> East Asia. Federal <strong>Reserve</strong><strong>Bank</strong> of San Francisco. Pacific Bas<strong>in</strong> Work<strong>in</strong>g Paper Series PB00-03.Myburgh Commission. 2002. F<strong>in</strong>al Report of the Commission of Inquiry <strong>in</strong>to the RapidDepreciation of the Rand and Related Matters at:http://www.doj.gov.za/2004dojsite/commissions/comm_rand/f<strong>in</strong>al%20report.htm [22.08.2006].Nag, A and Mitra, A. 1999. Neural Networks and Early Warn<strong>in</strong>g Indicators of Currency Crisis.<strong>Reserve</strong> <strong>Bank</strong> of India Occasional Papers, 20(2), 183-222.Obstfeld, M. 1986. Rational and Self-fulfill<strong>in</strong>g Balance-of-Payment Crises. American EconomicReview, 76, 72-81.Peltonen, T A. 2006. Are emerg<strong>in</strong>g market <strong>currency</strong> <strong>crises</strong> predictable? A test. EuropeanCentral <strong>Bank</strong> Work<strong>in</strong>g Paper, 571.Schal<strong>in</strong>g, E and Schoeman, C. 2000. Foreign Exchange Market Intervention <strong>in</strong> <strong>South</strong> <strong>Africa</strong>dur<strong>in</strong>g the Asian Contagion: Lean<strong>in</strong>g aga<strong>in</strong>st the W<strong>in</strong>d or Caus<strong>in</strong>g a Hurricane? ResearchPaper No. 5. Auckland Park: Rand Afrikaans University.<strong>South</strong> <strong>Africa</strong>n <strong>Reserve</strong> <strong>Bank</strong>. 2006. Quarterly Bullet<strong>in</strong>. Various issues.Stals, C. 1999. The <strong>South</strong> <strong>Africa</strong>n Economy <strong>in</strong> a World of Volatile F<strong>in</strong>ancial Markets. Speech.At: http://www.resbank.co.za/Address/1999/ad250599.html [19.10.2001].216Knedlik
SARB Conference 2006AppendixCrisismonths1994/031994/071994/081996/031996/041996/051996/101998/051998/061998/071998/082000/052001/102001/122004/012005/06EMP method <strong>in</strong>clud<strong>in</strong>g exchangerates, <strong>in</strong>terest rates, and reserves1.5 1.645 1.75 2.0 2.5XXXX X X X XX X X X XX X X X XX! X! X! X! X!X! X! X! X!X! X! X! X! X!3.0XXXX!EMP method <strong>in</strong>clud<strong>in</strong>g exchangerates only1.5 1.645 1.75 2.0 2.5XXXX! X! X! X! X!XXX X X XX! X! X! X! X!XXXXX3.0X!X!EMP method <strong>in</strong>clud<strong>in</strong>g exchangerates and <strong>in</strong>terest rates1.5 1.645 1.75 2.0 2.5X X X XXXXXX X X X XX! X! X! X! X!X! X! X! X! X!X! X! X! X! X!3.0XX!X!EMP method <strong>in</strong>clud<strong>in</strong>g reserves only1.5 1.645 1.75 2.0 2.5 3.0XXXXXX X X XX X X X X XX! X! X! X! X!X X X X X XX X X X X XKnedlik 217