AN-623-LC-MS-of-AA-AC-SUAC-dried-blood-spot-AN64265-EN
AN-623-LC-MS-of-AA-AC-SUAC-dried-blood-spot-AN64265-EN
AN-623-LC-MS-of-AA-AC-SUAC-dried-blood-spot-AN64265-EN

You also want an ePaper? Increase the reach of your titles
YUMPU automatically turns print PDFs into web optimized ePapers that Google loves.
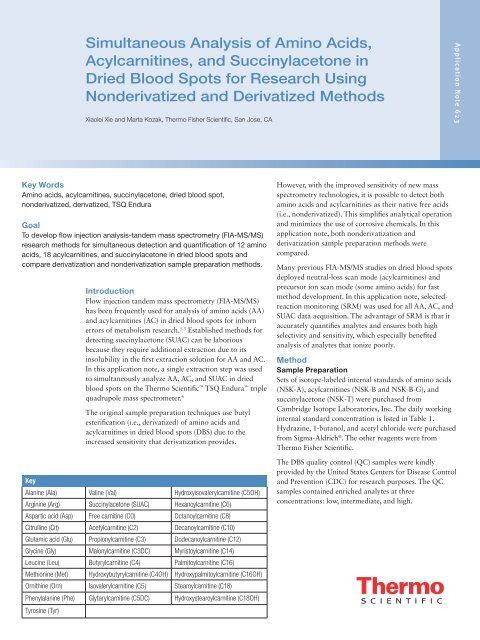
Simultaneous Analysis <strong>of</strong> Amino Acids,<br />
Acylcarnitines, and Succinylacetone in<br />
Dried Blood Spots for Research Using<br />
Nonderivatized and Derivatized Methods<br />
Xiaolei Xie and Marta Kozak, Thermo Fisher Scientific, San Jose, CA<br />
Application Note <strong>623</strong><br />
Key Words<br />
Amino acids, acylcarnitines, succinylacetone, <strong>dried</strong> <strong>blood</strong> <strong>spot</strong>,<br />
nonderivatized, derivatized, TSQ Endura<br />
Goal<br />
To develop flow injection analysis-tandem mass spectrometry (FIA-<strong>MS</strong>/<strong>MS</strong>)<br />
research methods for simultaneous detection and quantification <strong>of</strong> 12 amino<br />
acids, 18 acylcarnitines, and succinylacetone in <strong>dried</strong> <strong>blood</strong> <strong>spot</strong>s and<br />
compare derivatization and nonderivatization sample preparation methods.<br />
Key<br />
Introduction<br />
Flow injection tandem mass spectrometry (FIA-<strong>MS</strong>/<strong>MS</strong>)<br />
has been frequently used for analysis <strong>of</strong> amino acids (<strong>AA</strong>)<br />
and acylcarnitines (<strong>AC</strong>) in <strong>dried</strong> <strong>blood</strong> <strong>spot</strong>s for inborn<br />
errors <strong>of</strong> metabolism research. 1-3 Established methods for<br />
detecting succinylacetone (SU<strong>AC</strong>) can be laborious<br />
because they require additional extraction due to its<br />
insolubility in the first extraction solution for <strong>AA</strong> and <strong>AC</strong>.<br />
In this application note, a single extraction step was used<br />
to simultaneously analyze <strong>AA</strong>, <strong>AC</strong>, and SU<strong>AC</strong> in <strong>dried</strong><br />
<strong>blood</strong> <strong>spot</strong>s on the Thermo Scientific TSQ Endura triple<br />
quadrupole mass spectrometer. 4<br />
The original sample preparation techniques use butyl<br />
esterification (i.e., derivatized) <strong>of</strong> amino acids and<br />
acylcarnitines in <strong>dried</strong> <strong>blood</strong> <strong>spot</strong>s (DBS) due to the<br />
increased sensitivity that derivatization provides.<br />
Alanine (Ala) Valine (Val) Hydroxyisovalerylcarnitine (C5OH)<br />
Arginine (Arg) Succinylacetone (SU<strong>AC</strong>) Hexanoylcarnitine (C6)<br />
Aspartic acid (Asp) Free carnitine (C0) Octanoylcarnitine (C8)<br />
Citrulline (Cit) Acetylcarnitine (C2) Decanoylcarnitine (C10)<br />
Glutamic acid (Glu) Propionylcarnitine (C3) Dodecanoylcarnitine (C12)<br />
Glycine (Gly) Malonylcarnitine (C3DC) Myristoylcarnitine (C14)<br />
Leucine (Leu) Butyrylcarnitine (C4) Palmitoylcarnitine (C16)<br />
Methionine (Met) Hydroxybutyrylcarnitine (C4OH) Hydroxypalmitoylcarnitine (C16OH)<br />
Ornithine (Orn) Isovalerylcarnitine (C5) Stearoylcarnitine (C18)<br />
Phenylalanine (Phe) Glytarylcarnitine (C5DC) Hydroxystearoylcarnitine (C18OH)<br />
Tyrosine (Tyr)<br />
However, with the improved sensitivity <strong>of</strong> new mass<br />
spectrometry technologies, it is possible to detect both<br />
amino acids and acylcarnitines as their native free acids<br />
(i.e., nonderivatized). This simplifies analytical operation<br />
and minimizes the use <strong>of</strong> corrosive chemicals. In this<br />
application note, both nonderivatization and<br />
derivatization sample preparation methods were<br />
compared.<br />
Many previous FIA-<strong>MS</strong>/<strong>MS</strong> studies on <strong>dried</strong> <strong>blood</strong> <strong>spot</strong>s<br />
deployed neutral-loss scan mode (acylcarnitines) and<br />
precursor ion scan mode (some amino acids) for fast<br />
method development. In this application note, selectedreaction<br />
monitoring (SRM) was used for all <strong>AA</strong>, <strong>AC</strong>, and<br />
SU<strong>AC</strong> data acquisition. The advantage <strong>of</strong> SRM is that it<br />
accurately quantifies analytes and ensures both high<br />
selectivity and sensitivity, which especially benefited<br />
analysis <strong>of</strong> analytes that ionize poorly.<br />
Method<br />
Sample Preparation<br />
Sets <strong>of</strong> isotope-labeled internal standards <strong>of</strong> amino acids<br />
(NSK-A), acylcarnitines (NSK-B and NSK-B-G), and<br />
succinylacetone (NSK-T) were purchased from<br />
Cambridge Isotope Laboratories, Inc. The daily working<br />
internal standard concentration is listed in Table 1.<br />
Hydrazine, 1-butanol, and acetyl chloride were purchased<br />
from Sigma-Aldrich ® . The other reagents were from<br />
Thermo Fisher Scientific.<br />
The DBS quality control (QC) samples were kindly<br />
provided by the United States Centers for Disease Control<br />
and Prevention (CDC) for research purposes. The QC<br />
samples contained enriched analytes at three<br />
concentrations: low, intermediate, and high.
2<br />
Table 1. Daily working internal standard concentrations.<br />
Internal Standard<br />
The following protocols were used to prepare the DBS<br />
samples:<br />
Derivatized<br />
1. Punch one 1/8 inch diameter disc from DBS sample into<br />
a 96-well plate.<br />
2. Add 100 µL <strong>of</strong> working internal standard solution<br />
(containing internal standards <strong>of</strong> 12 amino acids,<br />
12 acylcarnitines, and SU<strong>AC</strong>) to each well.<br />
3. Shake the well plate for 45 min at 45 °C.<br />
Concentrations (µmol/L)<br />
Alanine-d 4<br />
2.50<br />
Arginine- 13 C-d 4<br />
2.50<br />
Aspartic acid-d 3<br />
2.50<br />
Citrulline-d 2<br />
2.50<br />
Glutamic acid-d 3<br />
2.50<br />
Glycine- 13 C- 15 N 12.50<br />
Leucine-d 3<br />
2.50<br />
Methionine-d 3<br />
2.50<br />
Ornithine-d 2<br />
2.50<br />
Phenylalanine- 13 C 6<br />
2.50<br />
Tyrosine- 13 C 6<br />
2.50<br />
Valine-d 8<br />
2.50<br />
Succinylacetone- 13 C 5<br />
2.50<br />
C0-Carnitine-d 9<br />
0.76<br />
C2-Carnitine-d 3<br />
0.19<br />
C3-Carnitine-d 3<br />
0.04<br />
C4-Carnitine-d 3<br />
0.04<br />
C5-Carnitine-d 9<br />
0.04<br />
C5DC-Carnitine-d 3<br />
0.08<br />
C5OH-Carnitine-d 3<br />
0.04<br />
C8-Carnitine-d 3<br />
0.04<br />
C12-Carnitine-d 9<br />
0.04<br />
C14-Carnitine-d 9<br />
0.04<br />
C16-Carnitine-d 3<br />
0.08<br />
C18-Carnitine-d 3<br />
0.08<br />
4. Transfer the eluates to another well plate and evaporate<br />
at 50 °C under nitrogen flow.<br />
5. Pipet 50 µL <strong>of</strong> methanol into each sample well and<br />
evaporate under nitrogen flow.<br />
6. Pipet 50 µL <strong>of</strong> 3 n-butanol HCl into each sample well<br />
and incubate at 65 °C for 20 min. Then, evaporate<br />
under nitrogen flow.<br />
7. Reconstitute each sample well with 100 µL <strong>of</strong><br />
50:50:0.02 acetonitrile/water/formic acid.<br />
Nonderivatized<br />
1. Punch one 1/8 inch diameter disc from DBS sample into<br />
a 96-well plate.<br />
2. Add 100 µL <strong>of</strong> working internal standard solution<br />
(containing internal standards <strong>of</strong> 12 amino acids,<br />
12 acylcarnitines, and SU<strong>AC</strong>) to each well.<br />
3. Shake the well plate for 45 min at 45 °C.<br />
4. Transfer the eluates to another well plate and evaporate<br />
at 50 °C under nitrogen flow.<br />
5. Pipet 50 µL <strong>of</strong> methanol into each sample well and<br />
evaporate under nitrogen flow.<br />
6. Reconstitute each sample well with 100 µL <strong>of</strong><br />
50:50:0.02 acetonitrile/water/formic acid.<br />
Liquid Chromatography<br />
Pump<br />
Autosampler<br />
HP<strong>LC</strong> column<br />
Mobile phase<br />
Thermo Scientific Dionex UltiMate HPG-3200 RS<br />
UltiMate WPS-3000 TRS<br />
None<br />
<strong>LC</strong> flow gradient Refer to Table 2<br />
Table 2. <strong>LC</strong> flow gradient.<br />
50:50:0.02 acetonitrile/water/formic acid<br />
Mass Spectrometry<br />
Flow injection <strong>MS</strong>/<strong>MS</strong> analysis was performed on a<br />
TSQ Endura triple quadrupole mass spectrometer. The<br />
mass spectrometer conditions were as follows:<br />
Ionization<br />
Spray voltage<br />
Sheath gas<br />
Aux gas<br />
Sweep gas<br />
Heated electrospray ionization (HESI)<br />
Positive, 3500 V<br />
50 Arb<br />
7 Arb<br />
0 Arb<br />
Ion transfer tube temperature 350 °C<br />
Vaporizer temperature 200 °C<br />
Data acquisition mode<br />
Cycle time<br />
Selected-reaction monitoring (SRM)<br />
1 s<br />
Q1 resolution (FWHM) 0.7<br />
Q3 resolution (FWHM) 0.7<br />
CID gas<br />
Source fragmentation<br />
Chrom filter<br />
Time (min)<br />
SRM parameters<br />
Flow Rate<br />
(mL/min)<br />
1.5 mTorr<br />
0 V<br />
3 s<br />
%A (mobile phase)<br />
0.00 0.09 100<br />
1.23 0.09 100<br />
1.25 0.30 100<br />
1.50 0.09 100<br />
Refer to Table 3 (Derivatized) and<br />
Table 4 (Nonderivatized)
Table 3. SRM parameters (derivatized).<br />
3<br />
Analyte<br />
Precursor<br />
Ion<br />
Product Ion<br />
Internal Standard<br />
Precursor<br />
Ion<br />
Product Ion<br />
Collision<br />
Energy (V)<br />
Alanine 146.20 44.20 Alanine-d 4<br />
150.20 48.18 17 62<br />
Arginine 231.28 70.13 Arginine- 13 C-d 4<br />
236.28 75.13 30 87<br />
Aspartic acid 246.18 144.13 Aspartic acid-d 3<br />
249.25 147.13 15 103<br />
Citrulline 232.28 113.13 Citrulline-d 2<br />
234.28 115.18 20 85<br />
Glutamic acid 260.28 157.93 Glutamic acid-d 3<br />
263.33 161.13 16 94<br />
Glycine 131.80 76.05 Glycine- 13 C- 15 N 134.20 78.10 8 55<br />
Leucine 188.25 86.10 Leucine-d 3<br />
191.25 89.18 15 75<br />
Methionine 206.23 104.13 Methionine-d 3<br />
209.20 107.23 16 81<br />
Ornithine 189.25 70.10 Ornithine-d 2<br />
191.18 72.13 24 79<br />
Phenylalanine 222.25 120.13 Phenylalanine- 13 C 6<br />
228.33 126.18 19 105<br />
Tyrosine 238.30 136.13 Tyrosine- 13 C 6<br />
244.28 142.15 18 93<br />
Valine 174.25 72.13 Valine-d 8<br />
182.23 80.18 16 73<br />
SU<strong>AC</strong> 211.18 137.05 SU<strong>AC</strong>- 13 C 5<br />
216.18 142.05 12 91<br />
C0-Carnitine 218.28 85.05 C0-Carnitine-d 9<br />
227.33 85.05 28 104<br />
C2-Carnitine 260.30 85.05 C2-Carnitine-d 3<br />
263.30 85.05 25 113<br />
C3-Carnitine 274.33 85.05<br />
C3DC-Carnitine 360.33 85.05<br />
C4-Carnitine 288.33 85.05<br />
C4OH-Carnitine 304.33 85.05<br />
C5-Carnitine 302.33 85.05<br />
C6-Carnitine 316.35 85.05<br />
RF Lens<br />
(V)<br />
C3-Carnitine-d 3<br />
277.33 85.05 25 121<br />
C4-Carnitine-d 3<br />
291.33 85.05 27 117<br />
C5-Carnitine-d 9<br />
311.38 85.05 30 113<br />
C5DC-Carnitine 388.35 85.05 C5DC-Carnitine-d 3<br />
391.35 85.05 31 138<br />
C5OH-Carnitine 318.38 85.05 C5OH-Carnitine-d 3<br />
321.38 85.05 31 138<br />
C8-Carnitine 344.38 85.05<br />
C10-Carnitine 372.40 85.05<br />
C8-Carnitine-d 3<br />
347.38 85.05 32 141<br />
C12-Carnitine 400.43 85.05 C12-Carnitine-d 9<br />
409.43 85.05 36 184<br />
C14-Carnitine 428.48 85.05 C14-Carnitine-d 9<br />
437.48 85.05 35 193<br />
C16-Carnitine 456.55 85.05<br />
C16OH-Carnitine 472.55 85.05<br />
C18-Carnitine 484.55 85.05<br />
C18OH-Carnitine 500.55 85.05<br />
C16-Carnitine-d 3<br />
459.55 85.05 37 183<br />
C18-Carnitine-d 3<br />
487.55 85.05 38 215
4<br />
Table 4. SRM parameters (nonderivatized).<br />
Analyte<br />
Precursor<br />
Ion<br />
Product Ion<br />
Internal Standard<br />
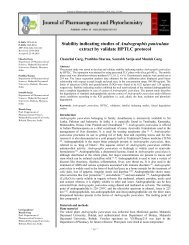
Data Processing<br />
Tandem <strong>MS</strong> data were processed using a new metacalculation<br />
s<strong>of</strong>tware, iRC PRO (2Next srl, Prato, Italy).<br />
This <strong>of</strong>f-line automated data processing tool can process<br />
peak area, concentration, and user-defined formulas<br />
(Figure 1).<br />
The metacalculation s<strong>of</strong>tware improves time effectiveness<br />
by eliminating the manual calculation process and<br />
removing transcription errors in the post-analytical phase.<br />
The processing time is reduced from hours to minutes.<br />
Precursor<br />
Ion<br />
Product Ion<br />
Collision<br />
Energy (V)<br />
Alanine 90.15 44.20 Alanine-d 4<br />
94.15 48.20 13 45<br />
Arginine 175.23 70.15 Arginine- 13 C-d 4<br />
180.23 75.15 24 92<br />
Aspartic acid 134.20 116.13 Aspartic acid-d 3<br />
137.20 119.13 6 54<br />
Citrulline 176.20 113.13 Citrulline-d 2<br />
178.20 115.13 18 59<br />
Glutamic acid 148.15 130.08 Glutamic acid-d 3<br />
151.15 133.08 9 62<br />
Glycine 76.08 30.25 Glycine- 13 C- 15 N 78.08 32.25 13 43<br />
Leucine 132.25 86.13 Leucine-d 3<br />
135.25 89.13 11 56<br />
Methionine 150.18 133.08 Methionine-d 3<br />
153.18 136.08 9 60<br />
Ornithine 133.15 70.15 Ornithine-d 2<br />
135.15 72.15 19 63<br />
Phenylalanine 166.20 120.15 Phenylalanine- 13 C 6<br />
172.20 126.15 16 69<br />
Tyrosine 182.15 136.18 Tyrosine- 13 C 6<br />
188.15 142.18 15 71<br />
Valine 118.23 72.15 Valine-d 8<br />
126.23 80.15 13 53<br />
SU<strong>AC</strong> 155.18 109.12 SU<strong>AC</strong>- 13 C 5<br />
160.18 114.12 22 63<br />
C0-Carnitine 162.23 85.05 C0-Carnitine-d 9<br />
171.23 85.05 23 69<br />
C2-Carnitine 204.23 85.05 C2-Carnitine-d 3<br />
207.23 85.05 21 96<br />
C3-Carnitine 218.23 85.05<br />
C3DC-Carnitine 248.23 85.05<br />
C4-Carnitine 232.18 85.05<br />
C4OH-Carnitine 248.25 85.05<br />
C5-Carnitine 246.30 85.05<br />
C6-Carnitine 260.30 85.05<br />
RF Lens<br />
(V)<br />
C3-Carnitine-d 3<br />
221.23 85.05 23 91<br />
C4-Carnitine-d 3<br />
235.18 85.05 21 78<br />
C5-Carnitine-d 9<br />
255.30 85.05 25 96<br />
C5DC-Carnitine 276.30 85.05 C5DC-Carnitine-d 3<br />
279.30 85.05 25 96<br />
C5OH-Carnitine 262.30 85.05 C5OH-Carnitine-d 3<br />
265.30 85.05 25 96<br />
C8-Carnitine 288.33 85.05<br />
C10-Carnitine 316.33 85.05<br />
C8-Carnitine-d 3<br />
291.33 85.05 26 108<br />
C12-Carnitine 344.45 85.05 C12-Carnitine-d 9<br />
353.45 85.05 39 152<br />
C14-Carnitine 372.45 85.05 C14-Carnitine-d 9<br />
381.45 85.05 39 152<br />
C16-Carnitine 400.45 85.05<br />
C16OH-Carnitine 416.45 85.05<br />
C18-Carnitine 428.45 85.05<br />
C18OH-Carnitine 444.45 85.05<br />
C16-Carnitine-d 3<br />
403.45 85.05 36 185<br />
C18-Carnitine-d 3<br />
431.45 85.05 36 185<br />
Assay Validation<br />
The intra-assay precision was determined at three<br />
concentrations by means <strong>of</strong> ten successive, independent<br />
measurement <strong>of</strong> DBS samples (n=10). The inter-assay<br />
precision was determined at three concentrations by<br />
means <strong>of</strong> ten independent measurement <strong>of</strong> DBS samples in<br />
seven different test series (n=70).<br />
Figure 1. iRC PRO intuitive workflow – icon-based user interface.
Results<br />
The derivatization process using butanol converted free<br />
amino acids and acylcarnitines into the butyric esters and<br />
added a mass <strong>of</strong> 56 (except for aspartic acid, glutamic<br />
acid, and C5DC, in which a mass <strong>of</strong> 112 was added).<br />
Figure 2 and 3 show full-scan spectra <strong>of</strong> derivatized and<br />
nonderivatized internal standards respectively.<br />
5<br />
Relative Abundance<br />
100<br />
95<br />
90<br />
85<br />
80<br />
75<br />
70<br />
65<br />
60<br />
55<br />
50<br />
45<br />
40<br />
35<br />
30<br />
25<br />
20<br />
15<br />
10<br />
5<br />
0<br />
134.09<br />
150.20<br />
216.20<br />
263.23<br />
191.22<br />
311.23<br />
182.17<br />
227.31<br />
209.23<br />
234.22<br />
347.33<br />
236.22 321.27<br />
291.28<br />
277.28<br />
249.23<br />
228.27<br />
244.22<br />
409.47<br />
391.36 437.46<br />
459.47<br />
487.46<br />
100 150 200 250 300 350 400 450 500<br />
m/z<br />
Internal Standard m/z Internal Standard m/z<br />
Alanine-d 4<br />
150.20 C0-Carnitine-d 9<br />
227.31<br />
Arginine- 13 C-d 4<br />
236.22 C2-Carnitine-d 3<br />
263.23<br />
Aspartic acid-d 3<br />
249.23 C3-Carnitine-d 3<br />
277.28<br />
Citrulline-d 2<br />
234.22 C4-Carnitine-d 3<br />
291.28<br />
Glutamic acid-d 3<br />
263.23 C5-Carnitine-d 9<br />
311.23<br />
Glycine- 13 C- 15 N 134.09 C5DC-Carnitine-d 3<br />
391.36<br />
Leucine-d 3<br />
191.22 C5OH-Carnitine-d 3<br />
321.27<br />
Methionine-d 3<br />
209.23 C8-Carnitine-d 3<br />
347.33<br />
Ornithine-d 2<br />
191.22 C12-Carnitine-d 9<br />
409.47<br />
Phenylalanine- 13 C 6<br />
228.27 C14-Carnitine-d 9<br />
437.46<br />
Tyrosine- 13 C 6<br />
244.22 C16-Carnitine-d 3<br />
459.47<br />
Valine-d 8<br />
182.17 C18-Carnitine-d 3<br />
487.46<br />
Succinylacetone- 13 C 5<br />
216.20<br />
Figure 2. Full-scan spectra <strong>of</strong> derivatized internal standards.
6<br />
Relative Abundance<br />
100<br />
95<br />
90<br />
85<br />
80<br />
75<br />
70<br />
65<br />
60<br />
55<br />
50<br />
45<br />
40<br />
35<br />
30<br />
25<br />
20<br />
15<br />
10<br />
5<br />
0<br />
135.19<br />
126.17<br />
78.07<br />
94.07<br />
171.24<br />
160.18<br />
403.41<br />
172.20<br />
221.18 381.42<br />
180.22<br />
153.12<br />
151.15<br />
137.20<br />
207.21<br />
279.14<br />
188.16<br />
255.27<br />
291.29<br />
235.21<br />
265.24<br />
353.36<br />
178.14<br />
431.42<br />
100 150 200 250 300 350 400 450 500<br />
m/z<br />
Internal Standard m/z Internal Standard m/z<br />
Alanine-d 4<br />
94.07 C0-Carnitine-d 9<br />
171.24<br />
Arginine- 13 C-d 4<br />
180.22 C2-Carnitine-d 3<br />
207.21<br />
Aspartic acid-d 3<br />
137.20 C3-Carnitine-d 3<br />
221.18<br />
Citrulline-d 2<br />
178.14 C4-Carnitine-d 3<br />
235.21<br />
Glutamic acid-d 3<br />
151.15 C5-Carnitine-d 9<br />
255.27<br />
Glycine- 13 C- 15 N 78.07 C5DC-Carnitine-d 3<br />
279.14<br />
Leucine-d 3<br />
135.19 C5OH-Carnitine-d 3<br />
265.24<br />
Methionine-d 3<br />
153.12 C8-Carnitine-d 3<br />
291.29<br />
Ornithine-d 2<br />
135.19 C12-Carnitine-d 9<br />
353.36<br />
Phenylalanine- 13 C 6<br />
172.20 C14-Carnitine-d 9<br />
381.42<br />
Tyrosine- 13 C 6<br />
188.16 C16-Carnitine-d 3<br />
403.41<br />
Valine-d 8<br />
126.17 C18-Carnitine-d 3<br />
431.42<br />
Succinylacetone- 13 C 5<br />
160.18<br />
Figure 3. Full-scan spectra <strong>of</strong> nonderivatized internal standards.<br />
SRM was used to acquire <strong>MS</strong>/<strong>MS</strong> data for all the analytes.<br />
Collision energy and RF lens parameters were optimized<br />
for each target and internal standard to ensure maximum<br />
selectivity and sensitivity. SRM allowed acquisition <strong>of</strong><br />
peaks with good signal-to-noise ratios even for analytes<br />
with poor ionization such as SU<strong>AC</strong> and C5DC regardless<br />
<strong>of</strong> whether derivatization was used (Figure 4 and 5).
Intensity<br />
2500000<br />
2000000<br />
1500000<br />
1000000<br />
SU<strong>AC</strong>- 13 C 5<br />
Intensity<br />
80000<br />
60000<br />
40000<br />
SU<strong>AC</strong>- 13 C 5<br />
7<br />
500000<br />
20000<br />
0<br />
250000<br />
0<br />
8000<br />
200000<br />
150000<br />
100000<br />
SU<strong>AC</strong><br />
6000<br />
4000<br />
SU<strong>AC</strong><br />
50000<br />
2000<br />
0<br />
0.0 0.2 0.4 0.6 0.8 1.0 1.2 1.4<br />
Time (min)<br />
0<br />
0.0 0.2 0.4 0.6 0.8 1.0 1.2 1.4<br />
Time (min)<br />
Intensity<br />
10000<br />
8000<br />
6000<br />
4000<br />
2000<br />
C5DC-d 3<br />
Intensity<br />
1500<br />
1000<br />
500<br />
C5DC-d 3<br />
0<br />
0<br />
2500<br />
10000<br />
5000<br />
C5DC<br />
2000<br />
1500<br />
1000<br />
C5DC<br />
500<br />
0<br />
0.0 0.2 0.4 0.6 0.8 1.0 1.2 1.4<br />
Time (min)<br />
0<br />
0.0 0.2 0.4 0.6 0.8 1.0 1.2 1.4<br />
Time (min)<br />
Figure 4. Flow injection analysis (FIA) pr<strong>of</strong>iles <strong>of</strong> SU<strong>AC</strong>- 13 C5, SU<strong>AC</strong><br />
and C5DC-D3, C5DC using derivatized method.<br />
Figure 5. Flow injection analysis (FIA) pr<strong>of</strong>iles <strong>of</strong> SU<strong>AC</strong>- 13 C5, SU<strong>AC</strong><br />
and C5DC-D3, C5DC using nonderivatized method.<br />
Intra-assay Precision<br />
For the derivatized method, the average intra-assay<br />
precisions (n=10) for 12 <strong>AA</strong> and SU<strong>AC</strong> at three<br />
concentrations were 7.9% (low), 8.0% (intermediate),<br />
and 8.0% (high). The average intra-assay precisions for<br />
18 <strong>AC</strong> at three concentrations were 8.9% (low), 8.3%<br />
(intermediate), and 9.0% (high) (Table 5).<br />
For the nonderivatized method, the average intra-assay<br />
precisions (n=10) for <strong>AA</strong> and SU<strong>AC</strong> at three<br />
concentrations were 6.1% (low), 7.2% (intermediate),<br />
and 9.8% (high). The average intra-assay precisions for<br />
<strong>AC</strong> at three concentrations were 7.6% (low), 6.2%<br />
(intermediate), and 8.2% (high) (Table 6).
8<br />
Table 5. Derivatized method intra-assay precision at three concentrations (low, intermediate, and high). n=10.<br />
Analyte<br />
Coefficient <strong>of</strong> Variation (%)<br />
Concentrations in µmol/L<br />
Low Intermediate High Low Intermediate High<br />
Alanine 9.5 8.9 11.5 552.3 710.2 890.3<br />
Arginine 5.4 9.6 7.6 111.2 211.4 317.8<br />
Aspartic acid 9.0 6.5 8.0 N/A N/A N/A<br />
Citrulline 6.8 4.0 5.6 55.8 131.6 277.4<br />
Glutamic acid 10.1 5.9 4.7 N/A N/A N/A<br />
Glycine 8.8 8.2 6.8 N/A N/A N/A<br />
Leucine 8.5 8.4 6.8 225.1 378.8 633.0<br />
Methionine 7.7 6.4 8.7 65.1 154.6 257.5<br />
Ornithine 8.4 12.3 8.4 N/A N/A N/A<br />
Phenylalanine 7.5 8.5 5.5 169.8 274.9 369.7<br />
Tyrosine 7.8 10.8 8.6 236.6 416.5 605.0<br />
Valine 9.6 8.3 8.1 289.5 410.0 547.8<br />
SU<strong>AC</strong> 8.2 7.2 9.4 1.9 4.6 9.9<br />
C0-Carnitine 12.2 5.0 6.8 35.3 54.4 70.6<br />
C2-Carnitine 10.8 8.6 7.6 24.6 37.6 47.9<br />
C3-Carnitine 11.6 12.7 11.7 4.9 10.1 14.6<br />
C3DC-Carnitine 7.4 6.9 9.0 0.2 0.6 1.1<br />
C4-Carnitine 6.7 6.5 10.6 1.1 2.8 5.0<br />
C4OH-Carnitine 7.1 6.1 8.6 0.3 0.6 1.4<br />
C5-Carnitine 6.9 5.4 10.6 0.6 1.7 3.2<br />
C6-Carnitine 8.1 5.7 5.9 0.7 1.3 3.3<br />
C5DC-Carnitine 4.7 8.6 8.3 1.0 2.2 3.1<br />
C5OH-Carnitine 8.4 7.3 9.1 0.6 1.2 2.8<br />
C8-Carnitine 9.0 9.5 4.0 0.6 1.2 2.7<br />
C10-Carnitine 7.4 6.8 6.9 0.6 1.2 3.1<br />
C12-Carnitine 6.1 6.7 8.8 0.7 1.3 2.8<br />
C14-Carnitine 8.9 10.8 8.7 0.6 1.5 2.9<br />
C16-Carnitine 10.7 10.9 10.8 3.5 7.8 11.8<br />
C16OH-Carnitine 12.6 13.0 12.6 0.1 0.4 0.7<br />
C18-Carnitine 10.2 7.4 13.6 1.6 2.6 5.6<br />
C18OH-Carnitine 10.9 11.1 8.8 0.4 0.7 1.1<br />
N/A, the analytes were not enriched in QC samples.
Table 6. Nonderivatized method intra-assay precision at three concentrations (low, intermediate, and high). n=10.<br />
9<br />
Analyte<br />
Coefficient <strong>of</strong> Variation (%)<br />
Inter-assay Precision<br />
For the derivatized method, the average inter-assay<br />
precisions (n=70) for 12 <strong>AA</strong> and SU<strong>AC</strong> at three<br />
concentrations were 13.5% (low), 12.9% (intermediate),<br />
and 12.5% (high). The average inter-assay precisions for<br />
18 <strong>AC</strong> at three concentrations were 15.0% (low), 15.6%<br />
(intermediate), and 16.1% (high) (Table 7).<br />
For the nonderivatized method, the average inter-assay<br />
precisions (n=70) for <strong>AA</strong> and SU<strong>AC</strong> at three<br />
concentrations were 12.8% (low), 12.8% (intermediate),<br />
and 12.6% (high). The average inter-assay precisions for<br />
<strong>AC</strong> at three concentrations were 12.7% (low), 10.5%<br />
(intermediate), and 11.8% (high) (Table 8).<br />
Concentrations in µmol/L<br />
Low Intermediate High Low Intermediate High<br />
Alanine 4.7 7.2 11.7 531.2 749.2 894.0<br />
Arginine 6.1 7.2 9.7 104.8 206.2 303.3<br />
Aspartic acid 13.0 13.7 15.1 N/A N/A N/A<br />
Citrulline 4.4 7.8 8.0 54.0 127.3 269.0<br />
Glutamic acid 8.0 3.8 7.3 N/A N/A N/A<br />
Glycine 8.6 9.7 10.6 N/A N/A N/A<br />
Leucine 5.5 6.3 9.2 252.9 416.0 637.4<br />
Methionine 8.1 4.8 9.7 65.0 155.7 253.7<br />
Ornithine 5.4 7.7 9.4 N/A N/A N/A<br />
Phenylalanine 4.9 5.7 9.4 164.1 266.2 347.7<br />
Tyrosine 5.2 5.9 7.5 240.4 431.7 <strong>623</strong>.5<br />
Valine 5.1 6.3 10.1 295.9 439.5 547.3<br />
SU<strong>AC</strong> 10.5 14.1 13.0 1.9 4.2 9.1<br />
C0-Carnitine 5.6 6.0 6.6 30.8 43.4 56.9<br />
C2-Carnitine 6.7 5.4 6.8 24.1 38.3 48.5<br />
C3-Carnitine 8.7 3.9 8.9 4.6 10.1 14.6<br />
C3DC-Carnitine 6.9 6.5 5.9 0.3 0.6 1.4<br />
C4-Carnitine 9.6 5.2 8.5 1.1 2.8 5.3<br />
C4OH-Carnitine 5.2 5.5 7.3 0.3 0.7 1.4<br />
C5-Carnitine 7.8 7.3 9.0 0.6 1.7 3.2<br />
C6-Carnitine 6.3 6.8 10.8 0.7 1.4 3.3<br />
C5DC-Carnitine 8.7 7.1 10.3 1.1 1.9 2.7<br />
C5OH-Carnitine 10.1 7.8 10.3 0.5 1.0 2.3<br />
C8-Carnitine 8.3 5.2 7.8 0.6 1.1 2.7<br />
C10-Carnitine 9.6 6.8 9.2 0.8 1.6 3.9<br />
C12-Carnitine 6.7 4.6 6.5 0.4 0.9 2.1<br />
C14-Carnitine 5.8 8.2 5.9 0.5 1.4 2.6<br />
C16-Carnitine 7.8 4.0 5.5 3.7 8.9 12.2<br />
C16OH-Carnitine 5.9 8.3 8.7 0.1 0.4 0.7<br />
C18-Carnitine 7.1 3.4 9.5 1.7 2.7 5.6<br />
C18OH-Carnitine 9.6 10.1 10.4 0.4 0.8 1.4<br />
N/A, the analytes were not enriched in QC samples.
10<br />
Table 7. Derivatized method inter-assay precision at three concentrations (low, intermediate, and high). n=70.<br />
Analyte<br />
Coefficient <strong>of</strong> Variation (%)<br />
Concentrations in µmol/L<br />
Low Intermediate High Low Intermediate High<br />
Alanine 12.2 9.6 10.3 538.1 711.4 882.2<br />
Arginine 17.1 16.6 18.6 123.8 222.5 326.0<br />
Aspartic acid 11.2 10.7 7.9 N/A N/A N/A<br />
Citrulline 17.0 14.8 12.5 58.9 132.6 285.3<br />
Glutamic acid 13.0 10.8 10.4 N/A N/A N/A<br />
Glycine 10.3 12.2 10.4 N/A N/A N/A<br />
Leucine 12.2 12.2 12.1 224.2 381.2 640.3<br />
Methionine 13.2 11.6 11.5 66.2 154.5 246.3<br />
Ornithine 17.2 15.4 17.5 N/A N/A N/A<br />
Phenylalanine 11.8 12.8 12.5 172.1 271.6 362.2<br />
Tyrosine 13.6 12.5 14.0 232.9 400.9 604.1<br />
Valine 11.4 12.8 11.5 290.4 409.3 539.3<br />
SU<strong>AC</strong> 13.0 13.4 9.4 2.0 4.7 9.9<br />
C0-Carnitine 15.7 15.1 13.4 36.4 51.7 71.8<br />
C2-Carnitine 13.8 14.1 15.1 24.2 37.1 49.4<br />
C3-Carnitine 16.3 15.3 16.6 4.8 9.5 14.2<br />
C3DC-Carnitine 13.8 14.1 16.1 0.2 0.5 1<br />
C4-Carnitine 16.3 13.4 17.5 1.0 2.5 4.7<br />
C4OH-Carnitine 16.2 18.4 15.5 0.3 0.6 1.3<br />
C5-Carnitine 15.1 14.6 16.6 0.6 1.5 2.9<br />
C6-Carnitine 14.9 12.3 14.2 0.7 1.3 3.1<br />
C5DC-Carnitine 13.7 15.6 15.2 1.1 2.1 3.1<br />
C5OH-Carnitine 13.4 16.2 14.7 0.6 1.1 2.7<br />
C8-Carnitine 15.4 13.8 16.6 0.6 1.1 2.6<br />
C10-Carnitine 17.4 16.9 18.0 0.6 1.1 2.8<br />
C12-Carnitine 15.4 17.1 17.3 0.7 1.2 2.6<br />
C14-Carnitine 14.5 14.9 17.1 0.6 1.4 2.7<br />
C16-Carnitine 14.7 16.1 16.2 3.7 7.9 11.5<br />
C16OH-Carnitine 13.0 17.6 18.3 0.1 0.4 0.7<br />
C18-Carnitine 14.7 18.2 15.5 1.7 2.5 5.1<br />
C18OH-Carnitine 15.2 17.1 16.5 0.4 0.7 1.1<br />
N/A, the analytes were not enriched in QC samples.
Table 8. Nonderivatized method inter-assay precision at three concentrations (low, intermediate, and high). n=70.<br />
11<br />
Analyte<br />
Coefficient <strong>of</strong> Variation (%)<br />
Concentrations in µmol/L<br />
Low Intermediate High Low Intermediate High<br />
Alanine 20.0 16.1 15.6 632.1 863.2 1002.4<br />
Arginine 12.0 11.3 12.2 103.3 204.2 303.2<br />
Aspartic acid 13.4 17.5 18.1 N/A N/A N/A<br />
Citrulline 10.7 11.4 9.7 54.3 129.0 263.3<br />
Glutamic acid 10.4 9.1 10.6 N/A N/A N/A<br />
Glycine 13.4 13.7 14.8 N/A N/A N/A<br />
Leucine 10.8 9.7 10.2 260.6 414.2 646.0<br />
Methionine 18.8 17.5 20.2 53.8 129.2 200.1<br />
Ornithine 8.6 8.8 8.8 N/A N/A N/A<br />
Phenylalanine 7.7 8.7 11.2 162.9 268.8 351.3<br />
Tyrosine 8.1 10.0 10.8 239.7 435.9 615.8<br />
Valine 9.1 9.3 10.1 300.1 432.9 539.5<br />
SU<strong>AC</strong> 18.1 21.0 13.7 2.7 4.9 9.3<br />
C0-Carnitine 12.5 11.3 12.0 29.4 40.3 51.9<br />
C2-Carnitine 10.3 10.0 10.9 24.1 38.1 47.8<br />
C3-Carnitine 9.8 9.7 11.8 4.5 9.9 14.3<br />
C3DC-Carnitine 12.4 11.8 9.1 0.3 0.6 1.3<br />
C4-Carnitine 10.3 10.8 11.6 1.1 2.7 5.2<br />
C4OH-Carnitine 11.3 10.5 10.6 0.3 0.6 1.4<br />
C5-Carnitine 11.2 11.6 11.6 0.6 1.7 3.2<br />
C6-Carnitine 16.9 16.5 12.7 0.7 1.4 3.2<br />
C5DC-Carnitine 11.3 9.1 10.1 1.0 1.9 2.6<br />
C5OH-Carnitine 12.8 11.3 12.3 0.5 1.0 2.4<br />
C8-Carnitine 9.9 8.6 10.7 0.6 1.1 2.6<br />
C10-Carnitine 18.4 13.5 13.2 0.8 1.6 4.0<br />
C12-Carnitine 12.2 8.7 9.8 0.4 0.9 2.1<br />
C14-Carnitine 11.3 8.0 10.0 0.5 1.4 2.7<br />
C16-Carnitine 10.9 8.4 12.2 3.6 8.7 12.2<br />
C16OH-Carnitine 14.3 9.6 13.9 0.1 0.4 0.7<br />
C18-Carnitine 12.1 7.8 11.6 1.7 2.7 5.7<br />
C18OH-Carnitine 21.3 11.2 17.8 0.4 0.9 1.5<br />
N/A, the analytes were not enriched in QC samples.<br />
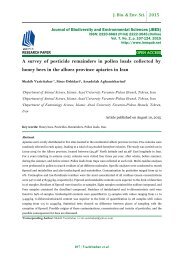
Method Comparison<br />
The concentration <strong>of</strong> analytes obtained from<br />
nonderivatized and derivatized methods were compared.<br />
The average method differences <strong>of</strong> 12 <strong>AA</strong> and SU<strong>AC</strong><br />
between quantitative values resulting from derivatization<br />
and nonderivatization methods at three concentrations<br />
were 3.8% (low), 4.8% (intermediate), and 3.2% (high).<br />
The average method differences <strong>of</strong> 18 <strong>AC</strong> at three<br />
concentrations were 14.2% (low), 11.4% (intermediate),<br />
and 10.5% (high) (Figure 6). Therefore the two methods<br />
were highly correlated. Our data are consistent with the<br />
reported results from a comprehensive empirical analysis. 5<br />
Derivatized ( mol/L)<br />
1000<br />
900<br />
800<br />
700<br />
600<br />
500<br />
400<br />
300<br />
200<br />
100<br />
60<br />
40<br />
20<br />
0<br />
0 20 40 60<br />
Low<br />
Intermediate<br />
High<br />
0<br />
0 100 200 300 400 500 600 700 800 900 1000<br />
Nonderivatized ( mol/L)<br />
Figure 6. Comparisons between quantitative values <strong>of</strong> 12 <strong>AA</strong>, SU<strong>AC</strong>, and 18 <strong>AC</strong> resulting<br />
from nonderivatized and derivatized methods.
Conclusion<br />
• Flow injection-tandem mass spectrometry methods<br />
were developed to simultaneously detect and quantify<br />
amino acids, acylcarnitines, and succinylacetone in a<br />
single extraction process in <strong>dried</strong> <strong>blood</strong> <strong>spot</strong>s for<br />
research. Rapid data processing was performed using<br />
iRC Pro metacalculation s<strong>of</strong>tware.<br />
• Both derivatization and nonderivatization sample<br />
preparation methods were capable <strong>of</strong> accurately<br />
quantifying <strong>AA</strong>/<strong>AC</strong>/SU<strong>AC</strong> on TSQ Endura triple<br />
quadrupole <strong>MS</strong> with a run time <strong>of</strong> 1.5 min.<br />
• SRM data acquisition mode optimized for each analyte<br />
and internal standard guarantees both high sensitivity<br />
and high selectivity.<br />
• The TSQ Endura <strong>MS</strong> system can provide average<br />
intra-assay precision (n=10) at three enriched<br />
concentrations <strong>of</strong> less than 10% and average inter-assay<br />
precision (n=70) <strong>of</strong> less than 15% for both<br />
nonderivatized and derivatized methods.<br />
• The method difference between quantitative values<br />
resulting from nonderivatized and derivatized methods<br />
was minor and both methods are highly correlated.<br />
References<br />
1. Chace, D.H.; Kalas, T.A.; Naylor, E.W. Use <strong>of</strong> tandem<br />
mass spectrometry for multianalyte screening <strong>of</strong> <strong>dried</strong><br />
<strong>blood</strong> specimens from newborns. Clin. Chem., 2003,<br />
49(11), 1797-817.<br />
2. Chace, D.H., et al. Rapid diagnosis <strong>of</strong> phenylketonuria<br />
by quantitative analysis for phenylalanine and tyrosine<br />
in neonatal <strong>blood</strong> <strong>spot</strong>s by tandem mass spectrometry.<br />
Clin. Chem., 1993, 39(1), 66-71.<br />
3. Millington, D.S., et al. Tandem mass spectrometry: a<br />
new method for acylcarnitine pr<strong>of</strong>iling with potential<br />
for neonatal screening for inborn errors <strong>of</strong> metabolism.<br />
J. Inherit. Metab. Dis., 1990, 13(3), 321-4.<br />
4. Dhillon, K.S., et al. Improved tandem mass<br />
spectrometry (<strong>MS</strong>/<strong>MS</strong>) derivatized method for the<br />
detection <strong>of</strong> tyrosinemia type I, amino acids and<br />
acylcarnitine disorders using a single extraction process.<br />
Clin. Chim. Acta, 2011, 412(11-12), 873-9.<br />
5. De Jesus, V.R., et al. Comparison <strong>of</strong> amino acids and<br />
acylcarnitines assay methods used in newborn screening<br />
assays by tandem mass spectrometry. Clin. Chim. Acta,<br />
2010, 411(9-10), 684-9.<br />
Application Note <strong>623</strong><br />
For research use only. Not for use in diagnostic procedures.<br />
www.thermoscientific.com<br />
©2015 Thermo Fisher Scientific Inc. All rights reserved. Sigma-Aldrich is a registered trademark <strong>of</strong> Sigma-Aldrich Co. ISO is a trademark<br />
<strong>of</strong> the International Standards Organization. All other trademarks are the property <strong>of</strong> Thermo Fisher Scientific and its subsidiaries. This<br />
information is presented as an example <strong>of</strong> the capabilities <strong>of</strong> Thermo Fisher Scientific products. It is not intended to encourage use <strong>of</strong> these<br />
products in any manners that might infringe the intellectual property rights <strong>of</strong> others. Specifications, terms and pricing are subject to change.<br />
Not all products are available in all countries. Please consult your local sales representative for details.<br />
Thermo Fisher Scientific,<br />
San Jose, CA USA is<br />
ISO 13485 Certified.<br />
ISO 13485<br />
Africa +43 1 333 50 34 0<br />
Australia +61 3 9757 4300<br />
Austria +43 810 282 206<br />
Belgium +32 53 73 42 41<br />
Canada +1 800 530 8447<br />
China 800 810 5118 (free call domestic)<br />
400 650 5118<br />
<strong>AN</strong>64265-<strong>EN</strong> 0115S<br />
Denmark +45 70 23 62 60<br />
Europe-Other +43 1 333 50 34 0<br />
Finland +358 9 3291 0200<br />
France +33 1 60 92 48 00<br />
Germany +49 6103 408 1014<br />
India +91 22 6742 9494<br />
Italy +39 02 950 591<br />
Japan +81 45 453 9100<br />
Korea +82 2 3420 8600<br />
Latin America +1 561 688 8700<br />
Middle East +43 1 333 50 34 0<br />
Netherlands +31 76 579 55 55<br />
New Zealand +64 9 980 6700<br />
Norway +46 8 556 468 00<br />
Russia/CIS +43 1 333 50 34 0<br />
Singapore +65 6289 1190<br />
Spain +34 914 845 965<br />
Sweden +46 8 556 468 00<br />
Switzerland +41 61 716 77 00<br />
UK +44 1442 233555<br />
USA +1 800 532 4752