Wu,J.H.,Peng,B.,Zhou,X.,Ma,J.,Jiang,Z.J.,Chen ... - BATC home page
Wu,J.H.,Peng,B.,Zhou,X.,Ma,J.,Jiang,Z.J.,Chen ... - BATC home page
Wu,J.H.,Peng,B.,Zhou,X.,Ma,J.,Jiang,Z.J.,Chen ... - BATC home page

Create successful ePaper yourself
Turn your PDF publications into a flip-book with our unique Google optimized e-Paper software.
OPTICAL MONITORING OF S5 0716+714 1823<br />
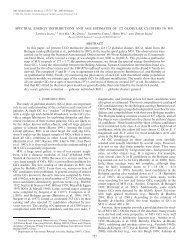
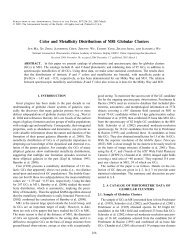
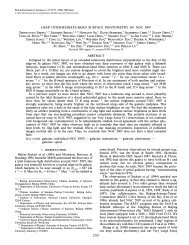
Fig. 4.—Structure function of S5 0716+714 on JD 2,453,006 (left) and 2,453,007 (right). The dashed lines indicate timescales at the maxima and periods at the<br />
minima of the structure functions.<br />
that on JD 2,452,956. The object appeared in a relatively quiescent<br />
state.<br />
The observational accuracy in period 2 is higher than in period<br />
1 as a result of better weather conditions. The light curves are<br />
characterized by a continuous (except on JD 2,453,006) increase<br />
in brightness. Two outbursts were observed on JD 2,453,005<br />
and 2,453,009 with rapid brightening of more than 0.3 mag<br />
within 0.4 days. The most sharp increase in brightness occurred<br />
on JD 2,453,005. The i magnitude changed from 13.896 on<br />
JD 2,453,005.328 to 13.716 on JD 2,453,005.400 (see Table 6),<br />
resulting in a rising rate of 0.1 mag hr 1 . The total magnitude<br />
change is about 0.8 mag in period 2, which is a factor of 2 larger<br />
than that in period 1, and the object appeared to be in an active or<br />
flaring state.<br />
The most unusual variation in period 2 was observed on JD<br />
2,453,006: all three light curves look very close to sine curves<br />
(see Fig. 3), with an amplitude of about 0.1 mag and a period of<br />
about 0.21 days (5 hr). This kind of variation is of particular<br />
interest and is discussed in x 3.4.<br />
In order to establish whether there is a time lag between the<br />
variations in different wave bands, we have calculated the<br />
z-transformed discrete correlation function (Alexander 1997)<br />
for periods 1 and 2 and for several individual nights. No significant<br />
time lag has been identified, except that a couple of<br />
nights show time lags from a few to less than 20 minutes between<br />
different wave bands. A time lag between variations in<br />
different wave bands will lead to an oscillating color index with<br />
respect to brightness rather than the bluer-when-brighter trend<br />
reported in x 3.3.<br />
In both periods the light curves in different bands are consistent<br />
with one another. The rms values of the differential magnitudes<br />
between the fifth comparison star and the average of all<br />
eight are 0.011, 0.010, 0.012, 0.009, 0.008, and 0.010 mag in<br />
the six small panels in Figures 2 and 3, respectively. These results<br />
demonstrate the accuracy of our magnitude measurements.<br />
3.2. Timescales of Variability<br />
A structure function (Simonetti et al. 1985) can be used to<br />
search for the typical timescales and periodicities of the variability.<br />
The characteristic timescale in a light curve, defined as<br />
the time interval between a maximum and an adjacent minimum<br />
or vice versa, is indicated by a maximum of the structure function,<br />
whereas the periodicity in a light curve causes a minimum<br />
of the structure function (Heidt & Wagner 1996).<br />
For S5 0716+714, structure function analysis was performed<br />
on the light curves of each individual night. Short timescales of<br />
a few hours were derived, but the results were different from<br />
night to night. For example, the structure function analysis (see<br />
Fig. 4, left) identified a timescale of 0.11 days (2.5 hr) and a<br />
period of 0.21 days (5 hr) for JD 2,453,006, which is consistent<br />
with the period clearly visible for the sinelike light curves on<br />
that night. Another example is that the same analysis on the<br />
light curves of JD 2,453,007 revealed timescales of 0.07 and<br />
0.17 days (1.7 and 4.1 hr) and periods of 0.11 and 0.23 days (2.6<br />
and 5.5 hr; see Fig. 4, right). All timescales and periods are<br />
shown by dashed lines in Figure 4. There is also a common<br />
timescale of about 20 minutes in all structure functions, but this<br />
timescale is identical to the temporal resolution of our monitoring<br />
and cannot be associated with the intrinsic variability.<br />
IDV has been frequently reported at radio and optical wavelengths<br />
in BL Lac object S5 0716+714; our observations at<br />
optical bands reconfirmed such IDV phenomena in this source.<br />
Instead of the much longer optical timescales of 4–10 days<br />
derived by other authors (e.g., Heidt & Wagner 1996; Qian et al.<br />
2002), our dense monitoring enabled us to derive much shorter<br />
timescales for this object, which may constrain the physical<br />
processes that result in its fast microvariability (see discussion<br />
in x 3.4).<br />
3.3. Spectral Behavvior<br />
The optical spectral change with brightness has been investigated<br />
for S5 0716+714 (e.g., Ghisellini et al. 1997; Raiteri et al.<br />
2003; Villata et al. 2000, 2004) and for other BL Lac objects<br />
(e.g., Carini et al. 1992; Romero et al. 2000; Speziali & Natali<br />
1998; Villata et al. 2002). Most authors have reported a bluerwhen-brighter<br />
chromatism when the objects show fast flares<br />
and an ‘‘achromatic’’ trend for their long-term variability. However,<br />
Raiteri et al. (2003) also noted for S5 0716+714 that, on<br />
short timescales, ‘‘different behaviours have been found: sometimes<br />
a bluer-when-brighter trend is recognizable, while in<br />
some other cases the opposite is true; there are also cases where<br />
magnitude variations do not imply spectral changes.’’ They<br />
suggested very dense monitoring with high-precision data to<br />
distinguish trends in the short-term spectral behavior of this<br />
source.<br />
Our monitoring of S5 0716+714 with high temporal resolution<br />
enables us to study its spectral behavior with a high<br />
confidence level. Following most authors mentioned above, we