Wu,J.H.,Peng,B.,Zhou,X.,Ma,J.,Jiang,Z.J.,Chen ... - BATC home page
Wu,J.H.,Peng,B.,Zhou,X.,Ma,J.,Jiang,Z.J.,Chen ... - BATC home page
Wu,J.H.,Peng,B.,Zhou,X.,Ma,J.,Jiang,Z.J.,Chen ... - BATC home page

You also want an ePaper? Increase the reach of your titles
YUMPU automatically turns print PDFs into web optimized ePapers that Google loves.
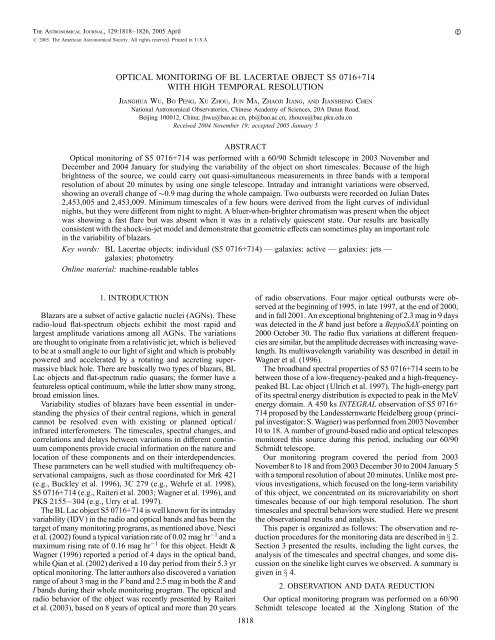
The Astronomical Journal, 129:1818–1826, 2005 April<br />
# 2005. The American Astronomical Society. All rights reserved. Printed in U.S.A.<br />
A<br />
OPTICAL MONITORING OF BL LACERTAE OBJECT S5 0716+714<br />
WITH HIGH TEMPORAL RESOLUTION<br />
<strong>Jiang</strong>hua <strong>Wu</strong>, Bo <strong>Peng</strong>, Xu <strong>Zhou</strong>, Jun <strong>Ma</strong>, Zhaoji <strong>Jiang</strong>, and Jiansheng <strong>Chen</strong><br />
National Astronomical Observatories, Chinese Academy of Sciences, 20A Datun Road,<br />
Beijing 100012, China; jhwu@bao.ac.cn, pb@bao.ac.cn, zhouxu@bac.pku.edu.cn<br />
Receivved 2004 November 19; accepted 2005 January 5<br />
ABSTRACT<br />
Optical monitoring of S5 0716+714 was performed with a 60/90 Schmidt telescope in 2003 November and<br />
December and 2004 January for studying the variability of the object on short timescales. Because of the high<br />
brightness of the source, we could carry out quasi-simultaneous measurements in three bands with a temporal<br />
resolution of about 20 minutes by using one single telescope. Intraday and intranight variations were observed,<br />
showing an overall change of 0.9 mag during the whole campaign. Two outbursts were recorded on Julian Dates<br />
2,453,005 and 2,453,009. Minimum timescales of a few hours were derived from the light curves of individual<br />
nights, but they were different from night to night. A bluer-when-brighter chromatism was present when the object<br />
was showing a fast flare but was absent when it was in a relatively quiescent state. Our results are basically<br />
consistent with the shock-in-jet model and demonstrate that geometric effects can sometimes play an important role<br />
in the variability of blazars.<br />
Key words: BL Lacertae objects: individual (S5 0716+714) — galaxies: active — galaxies: jets —<br />
galaxies: photometry<br />
Online material: machine-readable tables<br />
1. INTRODUCTION<br />
Blazars are a subset of active galactic nuclei (AGNs). These<br />
radio-loud flat-spectrum objects exhibit the most rapid and<br />
largest amplitude variations among all AGNs. The variations<br />
are thought to originate from a relativistic jet, which is believed<br />
to be at a small angle to our light of sight and which is probably<br />
powered and accelerated by a rotating and accreting supermassive<br />
black hole. There are basically two types of blazars, BL<br />
Lac objects and flat-spectrum radio quasars; the former have a<br />
featureless optical continuum, while the latter show many strong,<br />
broad emission lines.<br />
Variability studies of blazars have been essential in understanding<br />
the physics of their central regions, which in general<br />
cannot be resolved even with existing or planned optical/<br />
infrared interferometers. The timescales, spectral changes, and<br />
correlations and delays between variations in different continuum<br />
components provide crucial information on the nature and<br />
location of these components and on their interdependencies.<br />
These parameters can be well studied with multifrequency observational<br />
campaigns, such as those coordinated for Mrk 421<br />
(e.g., Buckley et al. 1996), 3C 279 (e.g., Wehrle et al. 1998),<br />
S5 0716+714 (e.g., Raiteri et al. 2003; Wagner et al. 1996), and<br />
PKS 2155 304 (e.g., Urry et al. 1997).<br />
The BL Lac object S5 0716+714 is well known for its intraday<br />
variability (IDV) in the radio and optical bands and has been the<br />
target of many monitoring programs, as mentioned above. Nesci<br />
et al. (2002) found a typical variation rate of 0.02 mag hr 1 and a<br />
maximum rising rate of 0.16 mag hr 1 for this object. Heidt &<br />
Wagner (1996) reported a period of 4 days in the optical band,<br />
while Qian et al. (2002) derived a 10 day period from their 5.3 yr<br />
optical monitoring. The latter authors also discovered a variation<br />
range of about 3 mag in the V band and 2.5 mag in both the R and<br />
I bands during their whole monitoring program. The optical and<br />
radio behavior of the object was recently presented by Raiteri<br />
et al. (2003), based on 8 years of optical and more than 20 years<br />
1818<br />
of radio observations. Four major optical outbursts were observed<br />
at the beginning of1995, in late 1997, at the end of 2000,<br />
and in fall 2001. An exceptional brightening of 2.3 mag in 9 days<br />
was detected in the R band just before a BeppoSAX pointing on<br />
2000 October 30. The radio flux variations at different frequencies<br />
are similar, but the amplitude decreases with increasing wavelength.<br />
Its multiwavelength variability was described in detail in<br />
Wagner et al. (1996).<br />
The broadband spectral properties of S5 0716+714 seem to be<br />
between those of a low-frequency-peaked and a high-frequencypeaked<br />
BL Lac object (Ulrich et al. 1997). The high-energy part<br />
of its spectral energy distribution is expected to peak in the MeV<br />
energy domain. A 450 ks INTEGRAL observation of S5 0716+<br />
714 proposed by the Landessternwarte Heidelberg group (principal<br />
investigator: S. Wagner) was performed from 2003 November<br />
10 to 18. A number of ground-based radio and optical telescopes<br />
monitored this source during this period, including our 60/90<br />
Schmidt telescope.<br />
Our monitoring program covered the period from 2003<br />
November 8 to 18 and from 2003 December 30 to 2004 January 5<br />
with a temporal resolution of about 20 minutes. Unlike most previous<br />
investigations, which focused on the long-term variability<br />
of this object, we concentrated on its microvariability on short<br />
timescales because of our high temporal resolution. The short<br />
timescales and spectral behaviors were studied. Here we present<br />
the observational results and analysis.<br />
This paper is organized as follows: The observation and reduction<br />
procedures for the monitoring data are described in x 2.<br />
Section 3 presented the results, including the light curves, the<br />
analysis of the timescales and spectral changes, and some discussion<br />
on the sinelike light curves we observed. A summary is<br />
given in x 4.<br />
2. OBSERVATION AND DATA REDUCTION<br />
Our optical monitoring program was performed on a 60/90<br />
Schmidt telescope located at the Xinglong Station of the
TABLE 1<br />
Observational Log and Results in the <strong>BATC</strong> e Band in Period 1<br />
Observation Date<br />
(UT) a<br />
Observation Time<br />
(UT) a<br />
Exposure Time<br />
(s)<br />
JD<br />
e<br />
(mag)<br />
e err<br />
(mag)<br />
2003 11 08............................... 16:04:57 100 2452952.171 14.285 0.026<br />
2003 11 08............................... 17:43:46 300 2452952.241 14.329 0.014<br />
2003 11 08............................... 18:19:14 300 2452952.265 14.327 0.014<br />
2003 11 08............................... 18:54:11 300 2452952.289 14.312 0.013<br />
2003 11 12 ............................... 16:36:29 300 2452956.194 14.522 0.014<br />
Notes.—Table 1 is published in its entirety in the electronic edition of the Astronomical Journal. A portion is shown here<br />
for guidance regarding its form and content.<br />
a The obs. date and time are of universal time. They are the same for Tables 3–7.<br />
TABLE 2<br />
Observational Log and Results in the <strong>BATC</strong> f Band in Period 1<br />
Observation Date<br />
(UT)<br />
Observation Time<br />
(UT)<br />
Exposure Time<br />
(s)<br />
JD<br />
f<br />
(mag)<br />
f err<br />
(mag)<br />
2003 11 08...................... 16:16:03 100 2452952.178 14.221 0.022<br />
2003 11 08...................... 17:51:25 300 2452952.246 14.247 0.012<br />
2003 11 08...................... 18:26:52 300 2452952.270 14.272 0.012<br />
2003 11 08...................... 19:01:50 300 2452952.295 14.234 0.011<br />
2003 11 08...................... 19:29:07 300 2452952.314 14.256 0.011<br />
Notes.—Table 2 is published in its entirety in the electronic edition of the Astronomical Journal. A portion is shown<br />
here for guidance regarding its form and content.<br />
TABLE 3<br />
Observational Log and Results in the <strong>BATC</strong> k Band in Period 1<br />
Observation Date<br />
(UT)<br />
Observation Time<br />
(UT)<br />
Exposure Time<br />
(s)<br />
JD<br />
k<br />
(mag)<br />
k err<br />
(mag)<br />
2003 11 08...................... 16:33:17 100 2452952.190 13.869 0.021<br />
2003 11 08...................... 18:11:18 300 2452952.260 13.882 0.010<br />
2003 11 08...................... 18:46:28 300 2452952.284 13.879 0.010<br />
2003 11 08...................... 19:21:27 300 2452952.308 13.867 0.010<br />
2003 11 08...................... 19:48:44 300 2452952.327 13.869 0.010<br />
Notes.—Table 3 is published in its entirety in the electronic edition of the Astronomical Journal. A portion is shown<br />
here for guidance regarding its form and content.
TABLE 4<br />
Observational Log and Results in the <strong>BATC</strong> e Band in Period 2<br />
Observation Date<br />
(UT)<br />
Observation Time<br />
(UT)<br />
Exposure Time<br />
(s)<br />
JD<br />
e<br />
(mag)<br />
e err<br />
(mag)<br />
2003 12 30....................... 12:31:07 300 2453004.023 14.535 0.015<br />
2003 12 30....................... 12:42:56 300 2453004.032 14.505 0.014<br />
2003 12 30....................... 12:59:40 300 2453004.043 14.506 0.013<br />
2003 12 30....................... 13:16:10 300 2453004.055 14.514 0.014<br />
2003 12 30....................... 13:32:42 300 2453004.066 14.534 0.014<br />
Notes.—Table 4 is published in its entirety in the electronic edition of the Astronomical Journal. A portion is shown<br />
here for guidance regarding its form and content.<br />
TABLE 5<br />
Observational Log and Results in the <strong>BATC</strong> f Band in Period 2<br />
Observation Date<br />
(UT)<br />
Observation Time<br />
(UT)<br />
Exposure Time<br />
(s)<br />
JD<br />
f<br />
(mag)<br />
f err<br />
(mag)<br />
2003 12 30...................... 12:49:12 300 2453004.036 14.430 0.012<br />
2003 12 30...................... 13:05:58 300 2453004.047 14.445 0.012<br />
2003 12 30...................... 13:22:14 300 2453004.059 14.436 0.012<br />
2003 12 30...................... 13:38:47 300 2453004.070 14.448 0.011<br />
2003 12 30...................... 13:59:29 300 2453004.085 14.426 0.012<br />
Notes.—Table 5 is published in its entirety in the electronic edition of the Astronomical Journal. A portion is shown<br />
here for guidance regarding its form and content.<br />
TABLE 6<br />
Observational Log and Results in the <strong>BATC</strong> i Band in Period 2<br />
Observation Date<br />
(UT)<br />
Observation Time<br />
(UT)<br />
Exposure Time<br />
(s)<br />
JD<br />
i<br />
(mag)<br />
i err<br />
(mag)<br />
2003 12 30..................... 12:26:59 180 2453004.020 14.152 0.007<br />
2003 12 30..................... 12:38:17 180 2453004.028 14.163 0.007<br />
2003 12 30..................... 12:55:21 180 2453004.040 14.161 0.007<br />
2003 12 30..................... 13:12:06 180 2453004.051 14.164 0.007<br />
2003 12 30..................... 13:28:21 180 2453004.062 14.149 0.007<br />
Notes.—Table 6 is published in its entirety in the electronic edition of the Astronomical Journal. A portion is shown<br />
here for guidance regarding its form and content.
OPTICAL MONITORING OF S5 0716+714 1821<br />
TABLE 7<br />
<strong>BATC</strong> <strong>Ma</strong>gnitudes of Eight Comparison Stars<br />
Star e f i k<br />
1.................................. 11.207 11.174 11.075 11.007<br />
2.................................. 11.656 11.615 11.508 11.490<br />
3.................................. 12.663 12.564 12.428 12.361<br />
4.................................. 13.366 13.296 13.245 13.211<br />
5.................................. 13.760 13.661 13.511 13.449<br />
6.................................. 13.839 13.747 13.590 13.564<br />
7.................................. 14.049 13.962 13.628 13.645<br />
8.................................. 14.335 14.284 14.113 14.106<br />
Fig. 1.—Finding chart of S5 0716+714 and the eight comparison stars taken<br />
with the 60/90 Schmidt telescope and filter i on JD 2,453,008. The size is<br />
14A5 ; 14A5(or512; 512 in pixels). The eight comparison stars are the same as<br />
in Villata et al. (1998).<br />
National Astronomical Observatories of China (NAOC). A Ford<br />
Aerospace 2048 ; 2048 CCD camera is mounted at its main focus.<br />
The CCD has a pixel size of 15 m, and its field of view is<br />
58 0 ; 58 0 , resulting in a resolution of 1B7pixel 1 .Thetelescopeis<br />
equipped with a 15 color intermediate-band photometric system,<br />
covering a wavelength range from 3000 to 10,000 8. The telescope<br />
and the photometric system are mainly used to carry out the<br />
Beijing-Arizona-Taiwan-Connecticut (<strong>BATC</strong>) survey and have<br />
shown their efficiency in detecting fast variabilities in blazars<br />
(e.g., <strong>Peng</strong> et al. 2003).<br />
The observations with the telescope are now highly automated.<br />
The telescope and filters can be controlled by a single<br />
computer command with a parameter file that specifies the telescope<br />
pointing, the filter change, the exposure time, etc. Once<br />
the observation starts, the work remaining for the observers is to<br />
check the quality of the observed CCD images and to pay attention<br />
to the weather conditions. In fact, after the night assistant<br />
prepared the hardware, the monitoring of S5 0716+714<br />
was controlled remotely by a computer at the headquarters<br />
of NAOC in Beijing, which is about 140 km away from the<br />
telescope.<br />
Our monitoring of S5 0716+714 was divided into two periods,<br />
one from 2003 November 8 to 18 (six nights, in fact, as a<br />
result of weather conditions) and the other from 2003 December<br />
30 to 2004 January 5 (seven successive nights). The first period<br />
(period 1) covered the duration of the INTEGRAL observation,<br />
and the second period (period 2) was an extension of period 1.<br />
A filter cycle of e, f, andk (central wavelengths of 4873, 5248,<br />
and 7528 8, respectively) was used in period 1, and a typical<br />
exposure time of 200–300 s was able to produce an image with<br />
a good signal-to-noise ratio. Only the central 512 ; 512 pixels<br />
were read out for the CCD images, and the readout time was<br />
about 5.6 s. Accounting for the time for the filter changes, we<br />
achieved a temporal resolution of about 20 minutes in each<br />
band. This enabled us to realize quasi-simultaneous measurements<br />
in three <strong>BATC</strong> bands with a high temporal resolution by<br />
using only one telescope. The size of the 512 ; 512 image is<br />
14A5 ; 14A5 and is enough to cover the BL Lac object and eight<br />
previously published comparison stars (Villata et al. 1998).<br />
During period 2 we changed the k filter to the more sensitive<br />
i filter (central wavelength of 6711 8), with which a shorter<br />
exposure time can produce images with the same quality as in<br />
the k band. The other observational procedures and constraints<br />
were the same as in period 1. The observational log and parameters<br />
are presented in Tables 1–6, with the observation date<br />
and time (UT), exposure time, Julian Date (JD), and <strong>BATC</strong><br />
magnitude and error. The finding chart of S5 0716+714 and the<br />
comparison stars is illustrated in Figure 1.<br />
In order to obtain in real time the light curves of the BL Lac<br />
object, we developed an automatic procedure. The procedure<br />
includes the following steps: The CCD images were first flatfielded,<br />
then Bertin’s SExtractor (Bertin & Arnouts 1996) was<br />
run on the CCD frames, and the instrumental magnitudes and<br />
errors of S5 0716+714 and the eight comparison stars were extracted.<br />
The average FWHM of the stellar images is about 4B0.<br />
A photometric aperture of 5 pixel (8B5) diameter was adopted<br />
during the extraction. The <strong>BATC</strong> e, f, i,andk magnitudes of the<br />
eight comparison stars were obtained by observing them and<br />
the <strong>BATC</strong> standard star HD 19445 in the same night and are<br />
listed in Table 7. Then, by comparing the instrumental magnitudes<br />
of the eight comparison stars with their <strong>BATC</strong> magnitudes,<br />
the instrumental magnitudes of S5 0716+714 were calibrated<br />
into the <strong>BATC</strong> e, f, i, andk magnitudes, and the light curves in<br />
the four <strong>BATC</strong> bands were obtained.<br />
3. RESULTS<br />
3.1. Ligght Curvves<br />
The light curves are displayed in Figures 2 and 3 for periods 1<br />
and 2, respectively. The large panels show the light curves of<br />
the BL Lac object, and the small ones present the differential<br />
magnitudes (average set to 0) between the fifth comparison star<br />
and the average of all eight. In order to show the variation<br />
clearly, we plot only the times when the BL Lac object was<br />
observed and exclude the daytime periods when no observations<br />
could be made.<br />
All light curves show intranight fluctuations superposed on<br />
longer timescale variations. In period 1 (see Fig. 2) the variation<br />
is characterized by fast oscillations with small amplitudes. In the<br />
first night, or on JD 2,452,952, the BL Lac object was in a relatively<br />
high state. Then its brightness dropped in the following<br />
days and reached a minimum on JD 2,452,956. In the following<br />
2 days, the BL Lac object got brighter, reaching another high<br />
state around the beginning of JD 2,452,959. The total magnitude<br />
change was about 0.4 mag in period 1, and the magnitude changes<br />
within individual nights were mostly about 0.1 mag, except for
Fig. 2.—Light curves of S5 0716+714 in the <strong>BATC</strong> e, f, andk bands in<br />
period 1. The large panels show the light curves of the BL Lac object, and<br />
small ones show the differential magnitudes between the fifth comparison star<br />
and the average of all eight.<br />
Fig. 3.—Light curves of S5 0716+714 in the <strong>BATC</strong> e, f, andi bands in<br />
period 2. The large panels show the light curves of the BL Lac object, and<br />
small ones show the differential magnitudes between the fifth comparison star<br />
and the average of all eight.
OPTICAL MONITORING OF S5 0716+714 1823<br />
Fig. 4.—Structure function of S5 0716+714 on JD 2,453,006 (left) and 2,453,007 (right). The dashed lines indicate timescales at the maxima and periods at the<br />
minima of the structure functions.<br />
that on JD 2,452,956. The object appeared in a relatively quiescent<br />
state.<br />
The observational accuracy in period 2 is higher than in period<br />
1 as a result of better weather conditions. The light curves are<br />
characterized by a continuous (except on JD 2,453,006) increase<br />
in brightness. Two outbursts were observed on JD 2,453,005<br />
and 2,453,009 with rapid brightening of more than 0.3 mag<br />
within 0.4 days. The most sharp increase in brightness occurred<br />
on JD 2,453,005. The i magnitude changed from 13.896 on<br />
JD 2,453,005.328 to 13.716 on JD 2,453,005.400 (see Table 6),<br />
resulting in a rising rate of 0.1 mag hr 1 . The total magnitude<br />
change is about 0.8 mag in period 2, which is a factor of 2 larger<br />
than that in period 1, and the object appeared to be in an active or<br />
flaring state.<br />
The most unusual variation in period 2 was observed on JD<br />
2,453,006: all three light curves look very close to sine curves<br />
(see Fig. 3), with an amplitude of about 0.1 mag and a period of<br />
about 0.21 days (5 hr). This kind of variation is of particular<br />
interest and is discussed in x 3.4.<br />
In order to establish whether there is a time lag between the<br />
variations in different wave bands, we have calculated the<br />
z-transformed discrete correlation function (Alexander 1997)<br />
for periods 1 and 2 and for several individual nights. No significant<br />
time lag has been identified, except that a couple of<br />
nights show time lags from a few to less than 20 minutes between<br />
different wave bands. A time lag between variations in<br />
different wave bands will lead to an oscillating color index with<br />
respect to brightness rather than the bluer-when-brighter trend<br />
reported in x 3.3.<br />
In both periods the light curves in different bands are consistent<br />
with one another. The rms values of the differential magnitudes<br />
between the fifth comparison star and the average of all<br />
eight are 0.011, 0.010, 0.012, 0.009, 0.008, and 0.010 mag in<br />
the six small panels in Figures 2 and 3, respectively. These results<br />
demonstrate the accuracy of our magnitude measurements.<br />
3.2. Timescales of Variability<br />
A structure function (Simonetti et al. 1985) can be used to<br />
search for the typical timescales and periodicities of the variability.<br />
The characteristic timescale in a light curve, defined as<br />
the time interval between a maximum and an adjacent minimum<br />
or vice versa, is indicated by a maximum of the structure function,<br />
whereas the periodicity in a light curve causes a minimum<br />
of the structure function (Heidt & Wagner 1996).<br />
For S5 0716+714, structure function analysis was performed<br />
on the light curves of each individual night. Short timescales of<br />
a few hours were derived, but the results were different from<br />
night to night. For example, the structure function analysis (see<br />
Fig. 4, left) identified a timescale of 0.11 days (2.5 hr) and a<br />
period of 0.21 days (5 hr) for JD 2,453,006, which is consistent<br />
with the period clearly visible for the sinelike light curves on<br />
that night. Another example is that the same analysis on the<br />
light curves of JD 2,453,007 revealed timescales of 0.07 and<br />
0.17 days (1.7 and 4.1 hr) and periods of 0.11 and 0.23 days (2.6<br />
and 5.5 hr; see Fig. 4, right). All timescales and periods are<br />
shown by dashed lines in Figure 4. There is also a common<br />
timescale of about 20 minutes in all structure functions, but this<br />
timescale is identical to the temporal resolution of our monitoring<br />
and cannot be associated with the intrinsic variability.<br />
IDV has been frequently reported at radio and optical wavelengths<br />
in BL Lac object S5 0716+714; our observations at<br />
optical bands reconfirmed such IDV phenomena in this source.<br />
Instead of the much longer optical timescales of 4–10 days<br />
derived by other authors (e.g., Heidt & Wagner 1996; Qian et al.<br />
2002), our dense monitoring enabled us to derive much shorter<br />
timescales for this object, which may constrain the physical<br />
processes that result in its fast microvariability (see discussion<br />
in x 3.4).<br />
3.3. Spectral Behavvior<br />
The optical spectral change with brightness has been investigated<br />
for S5 0716+714 (e.g., Ghisellini et al. 1997; Raiteri et al.<br />
2003; Villata et al. 2000, 2004) and for other BL Lac objects<br />
(e.g., Carini et al. 1992; Romero et al. 2000; Speziali & Natali<br />
1998; Villata et al. 2002). Most authors have reported a bluerwhen-brighter<br />
chromatism when the objects show fast flares<br />
and an ‘‘achromatic’’ trend for their long-term variability. However,<br />
Raiteri et al. (2003) also noted for S5 0716+714 that, on<br />
short timescales, ‘‘different behaviours have been found: sometimes<br />
a bluer-when-brighter trend is recognizable, while in<br />
some other cases the opposite is true; there are also cases where<br />
magnitude variations do not imply spectral changes.’’ They<br />
suggested very dense monitoring with high-precision data to<br />
distinguish trends in the short-term spectral behavior of this<br />
source.<br />
Our monitoring of S5 0716+714 with high temporal resolution<br />
enables us to study its spectral behavior with a high<br />
confidence level. Following most authors mentioned above, we
1824 WU ET AL.<br />
Vol. 129<br />
Fig. 5.—Color index vs. brightness in the two periods. The lines are best fits to the points. The bluer-when-brighter chromatism is clear in period 2 (right) but<br />
absent in period 1 (left). The two panels are set to have the same scales on both coordinates for comparison.<br />
use the color index to denote the spectral shape. The color index<br />
and brightness are taken as e k and ðe þ kÞ=2 for period 1 and<br />
e i and ðe þ iÞ=2 for period 2. The changes of the color index<br />
with brightness in the two periods are shown in Figure 5. The<br />
solid lines show the best fits to the points and take the errors in<br />
both coordinates into consideration (Press et al. 1992).<br />
In period 1, or when the object was in a relatively quiescent<br />
state, the distribution in the color-brightness diagram is quite<br />
dispersed, and there is not an overall color change. However, in<br />
period 2, or when the object was in a flaring state, a clear bluerwhen-brighter<br />
chromatism is found. The linear fit has a slope of<br />
0.077. The Pearson correlation coefficient is 0.636, and the<br />
significance level is 5:014 ; 10 18 , suggesting a strong correlation<br />
between color index and brightness. This is in agreement<br />
with the results obtained by most authors mentioned above.<br />
Ghisellini et al. (1997) have deduced from their monitoring that<br />
two processes may be operating in this source: the first one<br />
would cause the achromatic long-term flux variations, while the<br />
second would be responsible for the short-term fast variations.<br />
Our results are somewhat different but still consistent with<br />
theirs; during the quiescent or low state, the variation may be<br />
dominated by the long-term component and does not show an<br />
overall spectral change, while in the active or flaring state, the<br />
variation is dominated by the short-term component and has a<br />
bluer-when-brighter chromatism.<br />
That the spectra of S5 0716+714 change with its brightness<br />
has been observed at other wavelengths. For instance, Raiteri<br />
et al. (2003) reported a flatter-when-brighter trend in the radio<br />
wave band, and Cappi et al. (1994) discovered a steeper-whenfainter<br />
phenomenon in the soft X-ray. In fact, the spectrum changing<br />
with the flux at multiple wavelengths is a common feature in<br />
blazars (e.g., Aller et al. 1985; Urry et al. 1986; Sembay et al.<br />
1993; Kniffen et al. 1993; Mukherjee et al. 1996). This universal<br />
spectral behavior is nontrivial. It suggests a close relationship<br />
between the mechanisms responsible for the emission and variation<br />
in different wave bands. The analysis of spectral changes<br />
of blazars can put some strong constraints on the physical processes<br />
that are responsible for these variations (see discussion in<br />
x 3.4).<br />
3.4. The Sine Ligght Curvves<br />
The perfect sine light curves observed on JD 2,453,006 are of<br />
particular interest because very few of this kind of light curve<br />
have been reported before. They mimic a periodic variation, but<br />
there is only one complete period (it is a great pity that our<br />
weather became bad just at the end of this period). Webb (1990)<br />
detected a sinusoidal component in the variations of 3C 120, but<br />
the period was much longer (13 yr). For S5 0716+714, quasiperiodic<br />
oscillations have been detected by Quirrenbach et al.<br />
(1991). Their light curves, however, are very different: they are<br />
sawtooth-like with sharp turnoffs, while our light curves are<br />
sinelike with smooth turns. Therefore, we come to the question:<br />
What mechanism can produce such sinelike light curves<br />
Some mechanisms have been proposed to explain the IDV<br />
phenomena of blazars. They can be largely classified into two<br />
types, extrinsic and intrinsic, as reviewed by Wagner & Witzel<br />
(1995). The extrinsic mechanisms include interstellar scintillation<br />
(ISS) and gravitational microlensing. ISS is highly frequency<br />
dependent and only operates at low radio frequencies.<br />
The IDV in the millimeter regime and the fast variability in the<br />
optical regime, as observed by us, cannot be caused by the ISS<br />
mechanism. On the other hand, microlensing is an achromatic<br />
process and results in symmetric light curves. However, color<br />
or spectral changes have been frequently observed in radio to<br />
X-ray wave bands for S5 0716+714, as mentioned in x 3.3. We<br />
have also detected a clear bluer-when-brighter chromatism. In<br />
addition, the light curves at all wavelengths, including our optical<br />
ones, are generally asymmetric. Therefore, the fast variation<br />
of S5 0716+714 is not likely to be due to microlensing. In<br />
fact, the close correlation between the optical and radio bands<br />
observed in S5 0716+714 (e.g., Quirrenbach et al. 1991; Wagner<br />
et al. 1996) provides strong evidence against an extrinsic origin<br />
for its variability.<br />
The intrinsic interpretations mainly include accretion disk<br />
instabilities and the shock-in-jet model. The accretion disk<br />
model is able to explain some of the phenomena seen in the<br />
optical to X-ray range but cannot explain the radio IDV (e.g.,<br />
Wagner & Witzel 1995). The most frequently cited model is<br />
the shock-in-jet model, which has been widely used to explain<br />
the variability of blazars and quasars (e.g., Guetta et al. 2004;<br />
Jia et al. 1998; Qian et al. 1991; Romero et al. 2000; Wagner &<br />
Witzel 1995; and references therein). The main idea of the<br />
model is that shocks propagate down the relativistic jet, whose<br />
plasma is hydromagnetically turbulent. At sites where the shocks<br />
encounter particles or magnetic field overdensities, the optical<br />
synchrotron emission is enhanced. The amplitude and timescale
No. 4, 2005<br />
OPTICAL MONITORING OF S5 0716+714 1825<br />
Fig. 6.—Color index vs. brightness on JD 2,453,006. The solid line indicates<br />
only a very weak correlation between the color index and brightness.<br />
of the resulting variation depend on the power spectrum of the<br />
turbulence and the shock thickness. This kind of shock-injet<br />
model will naturally lead to the prediction of a bluer-whenbrighter<br />
phenomenon (<strong>Ma</strong>rscher 1998), as observed in our case.<br />
The shock-in-jet model still suffers from a number of problems<br />
in explaining IDV, such as the close correlation between<br />
the radio and optical variations. Therefore, geometric effects are<br />
sometimes invoked to account for some observational facts that<br />
cannot be interpreted satisfactorily by the shock-in-jet model.<br />
Geometric modulation in the context of shock-in-jet models is<br />
detailed by Camenzind & Krockenberger (1992). They argued<br />
that knots of enhanced particle density are injected at a finite jet<br />
radius. In knots moving relativistically on helical trajectories,<br />
the direction of forward beaming varies with time. For an observer<br />
close to the jet axis, the sweeping of the beam will introduce<br />
flares as a result of the lighthouse effect. This will lead<br />
to quasi-periodic variations of a few oscillations; the variations<br />
are basically achromatic.<br />
It is tempting to examine the color change on only JD<br />
2,453,006, since perfect sinelike light curves were observed on<br />
that night. Figure 6 illustrates the color index versus brightness<br />
relation. The linear fit gives a slope of 0.256, which is very<br />
different from the overall slope of period 2. The correlation<br />
coefficient is 0.361, and the significance level is 0.170, which<br />
means a poor fit or no clear correlation between the color index<br />
and brightness. That is to say, the brightness changed nearly<br />
achromatically on JD 2,453,006. The only two known processes<br />
that can cause achromatic variability are microlensing<br />
and the lighthouse effect. Although microlensing has been ruled<br />
out as the dominant mechanism of the variability of S5 0716+<br />
714, it may still make some contribution. The symmetry in the<br />
sine light curves may indicate a microlensing event, but the concave<br />
shape of the second halves of the light curves cannot be<br />
explained in terms of microlensing. In addition, this very short<br />
timescale would require a transverse speed of v trans c when<br />
microlensing. Therefore, the most probable mechanism responsible<br />
for the sine light curves is the lighthouse effect. It<br />
may produce a periodic variation according to Camenzind &<br />
Krockenberger (1992); the variation is achromatic. In other<br />
words, the variation observed on JD 2,453,006 is likely due to<br />
geometric effects.<br />
It is unclear whether all fast IDVs, especially the quasiperiodic<br />
ones such as those observed by Quirrenbach et al.<br />
(1991), can also be explained in terms of geometric effects<br />
within the context of the shock-in-jet model. If the answer is<br />
yes, the actual timescales of the intrinsic flux changes will be<br />
longer by a factor of a few, and the deduced extremely high<br />
brightness temperature will be reduced by 1 or more orders of<br />
magnitude. This will help to resolve the large difference between<br />
the high brightness temperature (10 17 K) and the<br />
Compton limit (
1826<br />
WU ET AL.<br />
Qian, B., Tao, J., & Fan, J. 2002, AJ, 123, 678<br />
Qian, S. J., Quirrenbach, A., Witzel, A., Krichbaum, T. P., Hummel, C. A., &<br />
Zensus, J. A. 1991, A&A, 241, 15<br />
Quirrenbach, A., et al. 1991, ApJ, 372, L71<br />
Raiteri, C. M., et al. 2003, A&A, 402, 151<br />
Romero, G. E., Cellone, S. A., & Combi, J. A. 2000, AJ, 120, 1192<br />
Sembay, S., Warwick, R. S., Urry, C. M., Sokoloski, J., George, I. M., <strong>Ma</strong>kino, F.,<br />
Ohashi, T., & Tashiro, M. 1993, ApJ, 404, 112<br />
Simonetti, J. H., Cordes, J. M., & Heeschen, D. S. 1985, ApJ, 296, 46<br />
Speziali, R., & Natali, G. 1998, A&A, 339, 382<br />
Ulrich, M., <strong>Ma</strong>raschi, L., & Urry, C. M. 1997, ARA&A, 35, 445<br />
Urry, C. M., Mushotzky, R. F., & Holt, S. S. 1986, ApJ, 305, 369<br />
Urry, C. M., et al. 1997, ApJ, 486, 799<br />
Villata, M., Raiteri, C. M., Lanteri, L., Sobrito, G., & Cavallone, M. 1998,<br />
A&AS, 130, 305<br />
Villata, M., et al. 2000, A&A, 363, 108<br />
———. 2002, A&A, 390, 407<br />
———. 2004, A&A, 421, 103<br />
Wagner, S. J., & Witzel, A. 1995, ARA&A, 33, 163<br />
Wagner, S. J., et al. 1996, AJ, 111, 2187<br />
Webb, J. R. 1990, AJ, 99, 49<br />
Wehrle, A. E., et al. 1998, ApJ, 497, 178