Wen,Z.L.,Yang,Y.B.,Zhou,X.,Yuan,Q.R.,Ma,J ... - BATC home page
Wen,Z.L.,Yang,Y.B.,Zhou,X.,Yuan,Q.R.,Ma,J ... - BATC home page
Wen,Z.L.,Yang,Y.B.,Zhou,X.,Yuan,Q.R.,Ma,J ... - BATC home page

You also want an ePaper? Increase the reach of your titles
YUMPU automatically turns print PDFs into web optimized ePapers that Google loves.
526 Z. L. <strong>Wen</strong>, Y. B. <strong>Yang</strong>, X. <strong>Zhou</strong> et al.<br />
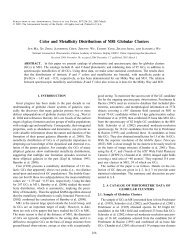
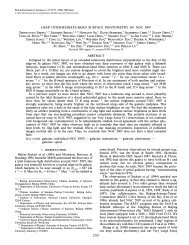
Fig. 6 Best-fit of the observed correlation with the SIS and NFW models. The SIS best fit is at velocity<br />
dispersion σ v = 766 km s −1 ; the NFW best fit is at dark matter halo mass within 1.5 h −1 Mpc equal to<br />
4.6 × 10 14 h −1 M ⊙.<br />
Figure 6 displays the cluster-QSO two point angular cross-correlation (positive values shown). Based<br />
on the weak lensing model, we determine the best-fit SIS and NFW profile halo models by minimizing the<br />
χ 2 statistic. For the SIS, the best fit is at velocity σ v = 766 ± 14 km s −1 ; for the NFW, at halo mass within<br />
1.5 h −1 Mpc equal to 4.6 ± 0.4 × 10 14 h −1 M ⊙ . When the corrected number-magnitude slope is used,<br />
these values decrease to σ v = 738 km s −1 and M 1.5 =4.3 × 10 14 h −1 M ⊙ .<br />
4.3 Total <strong>Ma</strong>ss Estimation<br />
From given mass or velocity dispersion of the individual clusters, we can express the total mass in clusters<br />
as a product of the space density of clusters and an average mass. Following the method of Croom & Shanks<br />
(1999), we derive the space density of the clusters to be n =5× 10 −5 h 3 Mpc −3 by integrating the proper<br />
volume to 0.35 and assuming that all clusters are detected to this redshift. The SIS model gives the mass<br />
parameter of the cluster sample<br />
(<br />
r<br />
)(<br />
σ<br />
)<br />
v<br />
2,<br />
Ω cl =0.077<br />
(8)<br />
1 h −1 Mpc 766 km s −1<br />
where r is the extent of the cross-correlation. We adopt the value r =1h −1 Mpc given by Croom & Shanks<br />
(1999) and Myers et al. (2003). The NFW model gives<br />
M NFW<br />
Ω cl =0.083<br />
4.6 × 10 14 h −1 . (9)<br />
M ⊙<br />
The results show that Ω cl =0.077 ± 0.003 for SIS and Ω cl =0.083 ± 0.06 for NFW halo. Note we<br />
only take into account the errors of velocity dispersion and M 1.5 . Other errors are difficult to estimate. The<br />
cluster selection based on photometric redshifts could lead to a redshift dependence of the space density. See<br />
Figure 1. Moreover, the presence of substructures in the clusters and the line-of-sight effect of environment<br />
would cause systematic errors.<br />
5 DISCUSSION<br />
Both SIS and NFW models give Ω cl ∼ 0.08, which is nearly three times larger than the observational<br />
value Ω cl =0.028 obtained by Fukugita et al. (1998). In our analysis, we model clusters as isolated halos.