Wen,Z.L.,Yang,Y.B.,Zhou,X.,Yuan,Q.R.,Ma,J ... - BATC home page
Wen,Z.L.,Yang,Y.B.,Zhou,X.,Yuan,Q.R.,Ma,J ... - BATC home page
Wen,Z.L.,Yang,Y.B.,Zhou,X.,Yuan,Q.R.,Ma,J ... - BATC home page

Create successful ePaper yourself
Turn your PDF publications into a flip-book with our unique Google optimized e-Paper software.
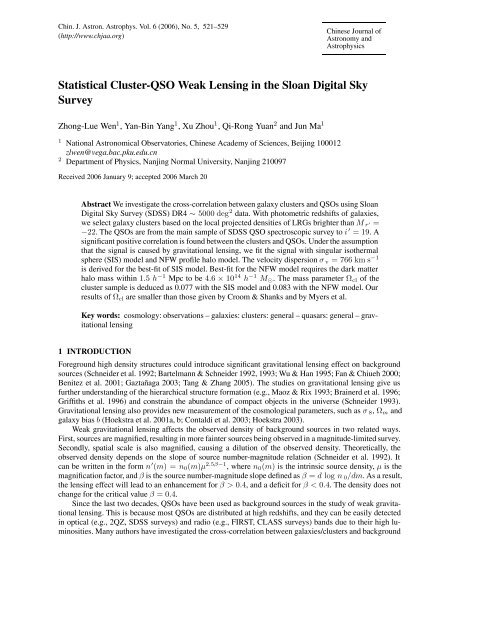
Chin. J. Astron. Astrophys. Vol. 6 (2006), No. 5, 521–529<br />
(http://www.chjaa.org)<br />
Chinese Journal of<br />
Astronomy and<br />
Astrophysics<br />
Statistical Cluster-QSO Weak Lensing in the Sloan Digital Sky<br />
Survey<br />
Zhong-Lue <strong>Wen</strong> 1 , Yan-Bin <strong>Yang</strong> 1 , Xu <strong>Zhou</strong> 1 , Qi-Rong <strong>Yuan</strong> 2 and Jun <strong>Ma</strong> 1<br />
1 National Astronomical Observatories, Chinese Academy of Sciences, Beijing 100012<br />
zlwen@vega.bac.pku.edu.cn<br />
2 Department of Physics, Nanjing Normal University, Nanjing 210097<br />
Received 2006 January 9; accepted 2006 <strong>Ma</strong>rch 20<br />
Abstract We investigate the cross-correlation between galaxy clusters and QSOs using Sloan<br />
Digital Sky Survey (SDSS) DR4 ∼ 5000 deg 2 data. With photometric redshifts of galaxies,<br />
we select galaxy clusters based on the local projected densities of LRGs brighter than M r ′ =<br />
−22. The QSOs are from the main sample of SDSS QSO spectroscopic survey to i ′ =19.A<br />
significant positive correlation is found between the clusters and QSOs. Under the assumption<br />
that the signal is caused by gravitational lensing, we fit the signal with singular isothermal<br />
sphere (SIS) model and NFW profile halo model. The velocity dispersion σ v = 766 km s −1<br />
is derived for the best-fit of SIS model. Best-fit for the NFW model requires the dark matter<br />
halo mass within 1.5 h −1 Mpc to be 4.6 × 10 14 h −1 M ⊙ . The mass parameter Ω cl of the<br />
cluster sample is deduced as 0.077 with the SIS model and 0.083 with the NFW model. Our<br />
results of Ω cl are smaller than those given by Croom & Shanks and by Myers et al.<br />
Key words: cosmology: observations – galaxies: clusters: general – quasars: general – gravitational<br />
lensing<br />
1 INTRODUCTION<br />
Foreground high density structures could introduce significant gravitational lensing effect on background<br />
sources (Schneider et al. 1992; Bartelmann & Schneider 1992, 1993; Wu & Han 1995; Fan & Chiueh 2000;<br />
Benitez et al. 2001; Gaztañaga 2003; Tang & Zhang 2005). The studies on gravitational lensing give us<br />
further understanding of the hierarchical structure formation (e.g., <strong>Ma</strong>oz & Rix 1993; Brainerd et al. 1996;<br />
Griffiths et al. 1996) and constrain the abundance of compact objects in the universe (Schneider 1993).<br />
Gravitational lensing also provides new measurement of the cosmological parameters, such as σ 8 , Ω m and<br />
galaxy bias b (Hoekstra et al. 2001a, b; Contaldi et al. 2003; Hoekstra 2003).<br />
Weak gravitational lensing affects the observed density of background sources in two related ways.<br />
First, sources are magnified, resulting in more fainter sources being observed in a magnitude-limited survey.<br />
Secondly, spatial scale is also magnified, causing a dilution of the observed density. Theoretically, the<br />
observed density depends on the slope of source number-magnitude relation (Schneider et al. 1992). It<br />
can be written in the form n ′ (m) =n 0 (m)µ 2.5β−1 , where n 0 (m) is the intrinsic source density, µ is the<br />
magnification factor, and β is the source number-magnitude slope defined as β = d log n 0 /dm. As a result,<br />
the lensing effect will lead to an enhancement for β>0.4, and a deficit for β
522 Z. L. <strong>Wen</strong>, Y. B. <strong>Yang</strong>, X. <strong>Zhou</strong> et al.<br />
QSOs. With radio-selected QSOs, positive correlations have been found (Seldner & Peebles 1979; Chu &<br />
Zhu 1984; Fugmann 1988, 1990; Bartelmann & Schneider 1994; Bartsch et al. 1997; Norman & Impey<br />
1999, 2001). With optical-selected QSOs, positive (Williams & Irwin 1998), negative (Boyle et al. 1988;<br />
Benítez et al. 2001), and null (<strong>Ma</strong>rtínez et al. 1999) correlations were found. Recently, Gaztañaga (2003)<br />
reported a positive galaxy-QSO cross-correlation using bright QSOs (i ′ < 18.8) from the SDSS QSO spectroscopic<br />
survey. Myers et al. (2003, 2005) detected negative correlations between 23 000 2QZ QSOs and<br />
foreground galaxies/clusters. Scranton et al. (2005), for the first time, detected positive, negative and null<br />
correlations in their analysis with SDSS 3800 deg 2 photometric data containing ∼ 200 000 QSOs and 13<br />
million galaxies.<br />
Although these results are in qualitative agreement with the gravitational lensing effect, in most cases<br />
the amplitude of observed correlation is much higher than the theoretical prediction. Webster et al. (1988),<br />
Rodrigues-Williams & Hogan (1994), Williams & Irwin 1998, and Gaztañaga (2003) found positive correlations<br />
that are much stronger than the predictions. Croom & Shanks (1999) reanalyzed the result of Boyle<br />
et al. (1988) in term of gravitational lensing, showing that the amplitude requires the velocity dispersion<br />
in clusters to be 1286 km s −1 , much higher than expected for the detected clusters. Similar problem also<br />
exists in Myers et al. (2003). Effort has been made to explain these disagreements. Wu & Fang (1996) considered<br />
environmental mass around the clusters, but contribution from environment remains insufficient to<br />
account for the observed correlations. Scranton et al. (2005) pointed out that the discrepancy is possibly due<br />
to systematic effects in the datasets. For example, the QSO sample is 20% contaminated by Galactic stars<br />
in Boyle et al. (1988), and the 2dF QSO survey is found to be less complete beyond b J =20.2 (Richards et<br />
al. 2005). However, how much these factors affect the result is still not very clear. In this paper, we address<br />
the question utilizing an unprecedented cluster sample and more complete QSO sample from the SDSS.<br />
This paper is organized as follows: In Section 2 we describe the galaxy cluster selection algorithm. In<br />
Section 3 we describe the QSO sample used in this paper. In Section 4 we measure the two point angular<br />
cross-correlation function between the clusters and QSOs, and model the clusters as Singular Isothermal<br />
Spheres and NFW profile halos. We give a discussion in Section 5 and our conclusions in Section 6.<br />
Throughout this paper we adopt the ΛCDM cosmology model with h = H 0 /100 km s −1 Mpc −1 =0.75,<br />
Ω m =0.3 and Ω Λ =0.7.<br />
2 GALAXY CLUSTER SELECTION<br />
The Sloan Digital Sky Survey is a wide-field photometric and spectroscopic survey. It will provide five<br />
broad bands (u ′ , g ′ , r ′ , i ′ and z ′ ) photometry over 10000 deg 2 and follow-up spectroscopy of 10 6 galaxies<br />
(http://www.sdss.org). The spectroscopic galaxy survey observes galaxies with extinction-corrected<br />
Petrosian magnitude r ′ < 17.77 for the main sample (Strauss et al. 2002) and r ′ < 19.5 for the luminous<br />
red galaxy (LRG) sample (Eisenstein et al. 2001).<br />
The galaxy sample is taken from SDSS DR4. With the five-band photometry, we estimate the photometric<br />
redshifts of galaxies down to r ′ =21using the technique of <strong>Yang</strong> et al. (2005). The algorithm can<br />
provide the photometric redshifts of galaxies with uncertainty σ z ∼ 0.03, on which we base to present<br />
galaxy cluster selection. The method of selection is similar to the classical one of Abell (1958) who selected<br />
clusters by counting the numbers of galaxies. With the photometric redshifts, we can count the numbers<br />
within a proper radius, excluding foreground and background galaxies. First, we select a sample of<br />
LRGs brighter than M r ′ = −22 as cluster galaxy candidates. This is because LRGs have more precise<br />
photometric redshifts and they are more likely to be in the clusters. We note that spectroscopic redshifts<br />
are adopted as long as they are available and we apply the k-correction following Fukugita et al. (1995).<br />
Secondly, for each candidate at redshift z, we count the numbers of galaxies N within 0.5 h −1 Mpc and<br />
z ± 0.05 based on the photometric redshifts. Thirdly, defining the density contrast of the environment of the<br />
LRG as δ = N/〈N〉−1, where 〈N〉 is the mean counts with the same range at z, candidates with δ>2<br />
are identified as cluster galaxies. Center of cluster is defined by the position of the LRG with the highest<br />
density contrast within 1 h −1 Mpc and z ± 0.05, and the cluster redshift, by that of the central LRG. At<br />
high redshift, the mean density of galaxies is low, and a few counts could give a high ensity contrast. Some<br />
of these galaxies may not lie in the clusters. To reduce false selection, we eliminate those candidates with
Statistical Cluster-QSO Weak Lensing 523<br />
Fig. 1 Redshift distribution for the cluster sample.<br />
The dashed line represents the expected redshift<br />
distribution.<br />
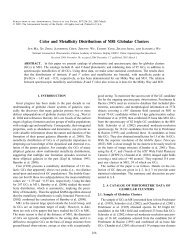
Fig. 2 Local projected density distribution for the selected<br />
clusters together with SDSS CE, maxBCG and<br />
Abell clusters containing selected LRGs. For comparison,<br />
the histograms are normalised to the same total.<br />
galaxy counts less than N =12. Figure 1 shows the redshift distribution of the cluster sample. 1 The dashed<br />
line represents the expected distribution.<br />
Statistically, the value of δ reflects the richness of the cluster: richer clusters go with higher density<br />
contrasts. Figure 2 shows the histogram of δ for the clusters together with SDSS CE (Goto et al. 2002),<br />
SDSS maxBCG (Bahcall et al. 2003) and Abell (Abell 1958) cluster samples, in which clusters not containing<br />
the selected LRGs are excluded. There are 640 clusters in SDSS maxBCG sample (90%) contain the<br />
selected LRGs, and the histograms are normalized to this number. The figure shows that the median value<br />
of δ is ∼ 2 for the SDSS CE and maxBCG samples, 3.5 for our sample and 4.5 for the Abell sample. For the<br />
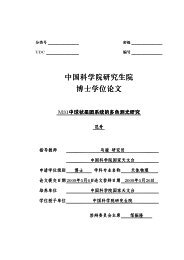
following analysis, the velocity dispersion of the clusters is estimated. We adopt the velocity dispersions<br />
of the clusters given by Struble & Rood (1999) and we consider only those clusters that contain at least<br />
10 known redshift members. Figure 3 plots the velocity dispersion against the density contrast: for clusters<br />
with δ ∼ 3.5 we find velocity dispersions in the range 400 − 600 km s −1 .<br />
3 QSO SAMPLE<br />
The SDSS imaging data reach a depth of r ′ ∼ 22.2 for point sources (Abazajian et al. 2004). The QSO<br />
spectroscopic survey observes point objects down to a limiting PSF magnitude of i ′ =19.1 for z < 3<br />
QSOs and i ′ =20.2 for high-z (z >3) QSOs (Richards et al. 2002). Vanden Berk et al. (2005) have shown<br />
that the completeness of the selection algorithm is approximately 95%, and the overall completeness of the<br />
SDSS QSO survey is 89%. Figure 4 shows the redshift distribution of the QSO sample. Here, we restrict<br />
the sample to 0.6
524 Z. L. <strong>Wen</strong>, Y. B. <strong>Yang</strong>, X. <strong>Zhou</strong> et al.<br />
Fig. 3 Density contrast against velocity dispersion<br />
for 35 Abell clusters that contain at least 10 known<br />
redshift members.<br />
Fig. 4 Redshift distribution of the SDSS QSOs.<br />
Fig. 5 Number-magnitude relation in i ′ for QSOs with 0.6
Statistical Cluster-QSO Weak Lensing 525<br />
α = 4GM(b)<br />
bc 2<br />
= D s<br />
D ls<br />
(θ − θ q ), (1)<br />
where M(b) is the projected mass within impact parameter b, D s is the angular diameter distance of the<br />
source from the observer, D ls is the angular diameter distance of the source from the lens, θ q and θ are<br />
the angular distances of the lens to the source and to the image, respectively. The flux of sources will be<br />
magnified by a factor (Turner et al. 1984)<br />
µ(θ) = ∣ θ dθ<br />
∣ ∣∣. (2)<br />
θ q dθ q<br />
The two point angular cross-correlation function ω cq (θ) is defined as the excess probability of finding<br />
a source at an angular distance from a given cluster:<br />
〈 n ′ (m) − n 0 (m)<br />
〉<br />
ω(θ) ≡<br />
= µ(θ) 2.5β−1 − 1. (3)<br />
n 0 (m)<br />
Therefore, the observed correlation allows us to determine the mass distribution of a cluster. One general<br />
way is to assume a parameterized mass profile and we find the parameters that give the best fit tothe<br />
observed correlation.<br />
For simplicity, we assume that the clusters are isolated halos and ignore their shapes and substructures,<br />
and that the contribution to the ω cq comes all from the considered central cluster while no contribution from<br />
the other clusters. The simplest model is that the cluster is considered as a singular isothermal sphere (SIS).<br />
The mass distribution is then given by<br />
ρ(r) =<br />
σ2 v 1<br />
2πG r 2 , (4)<br />
where σ v is the velocity dispersion of the SIS. Another model adopted in this study is the NFW profile halo<br />
model provided by N-body simulations (Navarro et al. 1995, 1996, 1997):<br />
ρ(r) = r<br />
r s<br />
(1 + r r s<br />
) , (5)<br />
2<br />
where r s and ρ s are the characteristic scale and density of the halo, respectively, with r s given by the<br />
relation (<strong>Ma</strong>oz et al. 1997),<br />
( M1.5<br />
) γh<br />
r s = 300<br />
−1 10 15 kpc, (6)<br />
M ⊙<br />
where γ =1/3 is adopted. This model is thus reduced to a single parameter, the mass of halo within<br />
1.5 h −1 Mpc of the halo (M 1.5 ).<br />
4.2 Model Fits<br />
The two point angular cross-correlation between clusters and QSOs is measured by the excess probability<br />
of finding pairs of the two sources separated by angle θ above the probability expected for a random<br />
distribution (Peebles 1980; Myers et al. 2003)<br />
ω cq (θ) = DD(θ)n R<br />
− 1, (7)<br />
DR(θ)n D<br />
where D refers to a data point (either a QSO or a galaxy cluster) and R refers to random sample. DD is the<br />
actual number of QSO-cluster pairs of a given separation and DR is the number of QSO-cluster pairs in a<br />
Poisson random distribution. The random catalog is simulated precisely for the same area as the selected<br />
clusters. The parameter n R /n D is the ratio of number of mock clusters to that of real clusters. We adopt<br />
n R /n D =10in our simulations. For each Poisson random sample, the correlation is computed. Errors are<br />
measured as the rms of the calculated correlations of 50 random samples.<br />
ρ s
526 Z. L. <strong>Wen</strong>, Y. B. <strong>Yang</strong>, X. <strong>Zhou</strong> et al.<br />
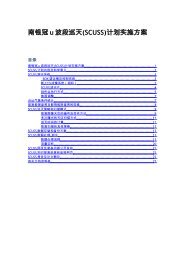
Fig. 6 Best-fit of the observed correlation with the SIS and NFW models. The SIS best fit is at velocity<br />
dispersion σ v = 766 km s −1 ; the NFW best fit is at dark matter halo mass within 1.5 h −1 Mpc equal to<br />
4.6 × 10 14 h −1 M ⊙.<br />
Figure 6 displays the cluster-QSO two point angular cross-correlation (positive values shown). Based<br />
on the weak lensing model, we determine the best-fit SIS and NFW profile halo models by minimizing the<br />
χ 2 statistic. For the SIS, the best fit is at velocity σ v = 766 ± 14 km s −1 ; for the NFW, at halo mass within<br />
1.5 h −1 Mpc equal to 4.6 ± 0.4 × 10 14 h −1 M ⊙ . When the corrected number-magnitude slope is used,<br />
these values decrease to σ v = 738 km s −1 and M 1.5 =4.3 × 10 14 h −1 M ⊙ .<br />
4.3 Total <strong>Ma</strong>ss Estimation<br />
From given mass or velocity dispersion of the individual clusters, we can express the total mass in clusters<br />
as a product of the space density of clusters and an average mass. Following the method of Croom & Shanks<br />
(1999), we derive the space density of the clusters to be n =5× 10 −5 h 3 Mpc −3 by integrating the proper<br />
volume to 0.35 and assuming that all clusters are detected to this redshift. The SIS model gives the mass<br />
parameter of the cluster sample<br />
(<br />
r<br />
)(<br />
σ<br />
)<br />
v<br />
2,<br />
Ω cl =0.077<br />
(8)<br />
1 h −1 Mpc 766 km s −1<br />
where r is the extent of the cross-correlation. We adopt the value r =1h −1 Mpc given by Croom & Shanks<br />
(1999) and Myers et al. (2003). The NFW model gives<br />
M NFW<br />
Ω cl =0.083<br />
4.6 × 10 14 h −1 . (9)<br />
M ⊙<br />
The results show that Ω cl =0.077 ± 0.003 for SIS and Ω cl =0.083 ± 0.06 for NFW halo. Note we<br />
only take into account the errors of velocity dispersion and M 1.5 . Other errors are difficult to estimate. The<br />
cluster selection based on photometric redshifts could lead to a redshift dependence of the space density. See<br />
Figure 1. Moreover, the presence of substructures in the clusters and the line-of-sight effect of environment<br />
would cause systematic errors.<br />
5 DISCUSSION<br />
Both SIS and NFW models give Ω cl ∼ 0.08, which is nearly three times larger than the observational<br />
value Ω cl =0.028 obtained by Fukugita et al. (1998). In our analysis, we model clusters as isolated halos.
Statistical Cluster-QSO Weak Lensing 527<br />
Fig. 7 Auto-correlation of clusters. The dashed line represents the power law fit in the form of ω cc ∼ θ −0.8 .<br />
Table 1 Comparison with Previous Results<br />
Authors N c N q β σ v M 1.5 Ω cl<br />
(km s −1 ) (h −1 M ⊙ ) SIS NFW<br />
Croom & Shanks 8442 2831 0.29 1286 — 1.3 —<br />
(1999) B
528 Z. L. <strong>Wen</strong>, Y. B. <strong>Yang</strong>, X. <strong>Zhou</strong> et al.<br />
and clusters may be different, which would lead to large systematic errors in the estimation of the space<br />
density of clusters.<br />
With the cluster selection and uncertainty of photometric redshift, we assume the number count of the<br />
LRGs to be one-fourth that of cluster members. The number of galaxies in the cluster sample corresponds<br />
to 15% of the total number of galaxies. Considering that the M/L ratio of cluster galaxies is twice as much<br />
as that of field galaxies (Colín et al. 1999), the expected Ω m of the universe should be raised by a factor<br />
of 4.<br />
6 CONCLUSIONS<br />
From the Sloan wide-field photometric and spectroscopic survey, we selected galaxy clusters utilizing<br />
photometric redshifts of galaxies. After excluding foreground and background galaxies, we measured<br />
the local projected densities of LRGs. The clusters were identified based on LRGs with density contrast<br />
δ > 2 and galaxy counts larger than 12. The algorithm selected more than 20,000 clusters from<br />
SDSS DR4 ∼ 5000 deg 2 , with expected velocity dispersion ∼ 400 − 600 km s −1 and space density<br />
n =5× 10 −5 h 3 Mpc −3 .<br />
We measured the two point angular cross-correlation between these clusters and SDSS bright QSOs<br />
(i ′ < 19), and found significant positive correlation. Because the slope of number-magnitude relation is<br />
steep for the QSOs, gravitational lensing is suggested as the physical process to produce the signal. We<br />
model clusters as singular isothermal spheres (SIS) and NFW profile halos. The best-fit for the SIS model<br />
requires the velocity dispersion to be 766 km s −1 , and for NFW model, a halo mass with 1.5 h −1 Mpc to<br />
be 4.6 × 10 14 h −1 M ⊙ . The mass parameter Ω cl of the cluster sample is deduced to be Ω cl =0.077 for<br />
the SIS model and Ω cl =0.083 for the NFW model, both of which are higher than the observational value.<br />
We argue that the overestimate may be caused by the cluster environment and the line-of-sight effect. By<br />
comparing, we find that the systematic errors in Ω cl in Croom & Shanks (1999) and Myers et al. (2003) are<br />
much reduced.<br />
Acknowledgements We sincerely thank the referee for many suggestions. We are grateful to Chen Xue-<br />
Lei and Chen Da-Ming for their valuable comments. We like to thank Wu Zhen-Yu, Wu Jiang-Hua,<br />
Zhang Lin-Di, Duan Zhi-Yu and David Burstein for the useful discussions. This work has been supported<br />
by the National Natural Science Foundation of China, though Grants 10473012 and 10573020.<br />
Funding for the SDSS and SDSS-II has been provided by the Alfred P. Sloan Foundation, the Participating<br />
Institutions, the National Science Foundation, the U.S. Department of Energy, the National Aeronautics and<br />
Space Administration, the Japanese Monbukagakusho, the <strong>Ma</strong>x Planck Society, and the Higher Education<br />
Funding Council for England. The SDSS Web Site is http://www.sdss.org/. The SDSS is managed by the<br />
Astrophysical Research Consortium for the Participating Institutions. The Participating Institutions are the<br />
American Museum of Natural History, Astrophysical Institute Potsdam, University of Basel, Cambridge<br />
University, Case Western Reserve University, University of Chicago, Drexel University, Fermilab, the<br />
Institute for Advanced Study, the Japan Participation Group, Johns Hopkins University, the Joint Institute<br />
for Nuclear Astrophysics, the Kavli Institute for Particle Astrophysics and Cosmology, the Korean Scientist<br />
Group, the Chinese Academy of Sciences (LAMOST), Los Alamos National Laboratory, the <strong>Ma</strong>x-Planck-<br />
Institute for Astronomy (MPIA), the <strong>Ma</strong>x-Planck-Institute for Astrophysics (MPA), New Mexico State<br />
University, Ohio State University, University of Pittsburgh, University of Portsmouth, Princeton University,<br />
the United States Naval Observatory, and the University of Washington.<br />
References<br />
Abazajian K., Adelman-McCarthy Jennifer K., Agüeros <strong>Ma</strong>rcel A. et al., 2004, AJ, 128, 502<br />
Abell G. O., 1958, ApJS, 3, 211<br />
Bahcall N. A., et al. 2003, ApJS, 148, 243<br />
Bartelmann M., Schneider P., 1992, A&A, 259, 413<br />
Bartelmann M., Schneider P., 1993, A&A, 271, 421<br />
Bartelmann M., Schneider P., 1994, A&A, 284, 1<br />
Bartsch A., Schneider P., Bartelmann M., 1997, A&A, 319, 375<br />
Benítez N., Sanz J. L., <strong>Ma</strong>rtínez-González E., 2001, MNRAS, 320, 241
Statistical Cluster-QSO Weak Lensing 529<br />
Boyle B. J., Fong R., Shanks T., 1988, MNRAS, 231, 897<br />
Brainerd T. G., Blandford R. D., Smail I., 1996, ApJ, 466, 623<br />
Cen R., Ostriker J. P., 1999, ApJ, 514, 1<br />
Chu Y. Q., Zhu X. F., 1984, Chin. Astron. Astrophys., 8, 238<br />
Colberg J. M., White S. D. M., Jenkins A., Pearce F. R., 1999, MNRAS, 308, 593<br />
Colín P., Klypin A. A., Kravtsov A. V., Khokhlov A. M., 1999, ApJ, 523, 32<br />
Contaldi C. R., Hoekstra H., Lewis A., 2003, Physical Review Letters, 90, 221303<br />
Croom S. M., Shanks T., 1999, MNRAS, 307, L17<br />
Croom S. M., Smith R. J., Boyle B. J. et al., 2004, MNRAS, 349, 1397<br />
Eisenstein D. J., et al., 2001, AJ, 122, 2267<br />
Fan Z., Chiueh T., 2000, ApJ, 538, 1<br />
Fugmann W., 1988, A&A, 204, 73<br />
Fugmann W., 1990, A&A, 240, 11<br />
Fukugita M., Shimasaku K., Ichikawa T., 1995, PASP, 107, 945<br />
Fukugita M., Hogan C. J., Peebles P. J. E., 1998, ApJ, 503, 518<br />
Gaztañaga E., 2003, ApJ, 589, 82<br />
Goto T., et al., 2002, AJ, 123, 1807<br />
Griffiths R. E., Casertano S., Im M. et al., 1996, MNRAS, 282, 1159<br />
Hoekstra H., Yee H. K. C., Gladders M. D., 2001a, ApJ, 558, L11<br />
Hoekstra H., et al., 2001b, ApJ, 548, L5<br />
Hoekstra H., 2003, IAU Symposium, 216<br />
<strong>Ma</strong>oz D., Rix H. W., 1993, ApJ, 416, 425<br />
<strong>Ma</strong>oz D., Rix H. W., Gal-Yam A., Gould A., 1997, ApJ, 486, 75<br />
<strong>Ma</strong>rtínez H. J., Merchán M. E., Valotto C. A. et al., 1999, ApJ, 514, 558<br />
Mo H. J., Peacock J. A., Xia X. Y., 1993, MNRAS, 260, 121<br />
Myers A. D., Outram P. J., Shanks T. et al., 2003, MNRAS, 342, 467<br />
Myers A. D., Outram P. J., Shanks T. et al., 2005, MNRAS, 359, 741<br />
Navarro J. F., Frenk C. S., White S. D. M., 1995, MNRAS, 275, 720<br />
Navarro J. F., Frenk C. S., White S. D. M., 1996, ApJ, 462, 563<br />
Navarro J. F., Frenk C. S., White S. D. M., 1997, ApJ, 490, 493<br />
Norman D. J., Impey C. D., 1999, AJ, 118, 613<br />
Norman D. J., Impey C. D., 2001, AJ, 121, 2392<br />
Peebles P. J. E., 1980, The Large-scale Structure of the Universe, Princeton University Press<br />
Richards G. T., et al., 2002, AJ, 123, 2945<br />
Richards G. T., et al., 2004, ApJS, 155, 257<br />
Richards G. T., et al., 2005, MNRAS, 477<br />
Rodrigues-Williams L. L., Hogan C. J., 1994, AJ, 107, 451<br />
Schneider P., Ehlers J., Falco E. E., 1992, Gravitational Lenses, Berlin: Springer<br />
Schneider P., 1993, A&A, 279, 1<br />
Scranton R., et al., 2005, ApJ, 633, 589<br />
Seldner M., Peebles P. J. E., 1979, ApJ, 227, 30<br />
Strauss M. A., et al., 2002, AJ, 124, 1810<br />
Struble M. F., Rood H. J., 1999, ApJS, 125, 35<br />
Tang S. M., Zhang S. N., 2005, Chin. J. Astron. Astrophys. (ChJAA), 5(S), 147<br />
Tegmark M., et al., 2004, Phys. Rev. D, 69, 103501<br />
Turner E. L., Ostriker J. P., Gott J. R., 1984, ApJ, 284, 1<br />
Vanden Berk D. E., et al., 2005, AJ, 129, 2047<br />
Webster R. L., Hewett P. C., Harding M. E., Wegner G. A., 1988, Nature, 336, 358<br />
Williams L. L. R., Irwin M., 1998, MNRAS, 298, 378<br />
Wu X. P., Han J., 1995, MNRAS, 272, 705<br />
Wu X. P., Fang L. Z., 1996, ApJ, 461, L5<br />
<strong>Yang</strong> Y. B, <strong>Yuan</strong> Q. R., <strong>Wen</strong> Z. L. et al., 2005, ApJ, submitted<br />
Young P., Gunn J. E., Oke J. B. et al., 1980, ApJ, 241, 507