Wu,H.,Deng,Z.G.,Chen,J.S.,Zhou,X.,et al,2002 ... - BATC home page
Wu,H.,Deng,Z.G.,Chen,J.S.,Zhou,X.,et al,2002 ... - BATC home page
Wu,H.,Deng,Z.G.,Chen,J.S.,Zhou,X.,et al,2002 ... - BATC home page

You also want an ePaper? Increase the reach of your titles
YUMPU automatically turns print PDFs into web optimized ePapers that Google loves.
The Astronomic<strong>al</strong> Journ<strong>al</strong>, 123:1364–1380, <strong>2002</strong> March<br />
# <strong>2002</strong>. The American Astronomic<strong>al</strong> Soci<strong>et</strong>y. All rights reserved. Printed in U.S.A.<br />
E<br />
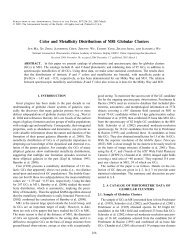
INTERMEDIATE-BAND SURFACE PHOTOMETRY OF THE EDGE-ON GALAXY NGC 4565<br />
Hong <strong>Wu</strong>, 1 David Burstein, 2 Zugan <strong>Deng</strong>, 1,3 Xu <strong>Zhou</strong>, 1 Zhaohui Shang, 4 Zhongyuan Zheng, 1 Jiansheng <strong>Chen</strong>, 1<br />
Hongjun Su, 1 Rogier A. Windhorst, 2 Wen-ping <strong>Chen</strong>, 5 Zhenlong Zou, 1 Xiaoyang Xia, 1,6 Zhaoji Jiang, 1 Jun Ma, 1<br />
Suijian Xue, 1 Jin Zhu, 1 Fuzhen <strong>Chen</strong>g, 1,7 Yong-Ik Byun, 5,8 Rui <strong>Chen</strong>, 1 Licai <strong>Deng</strong>, 1 Xiaohui Fan, 9<br />
Li-Zhi Fang, 10 Xu Kong, 1,7 Yong Li, 2 Weipeng Lin, 1,11 Phillip Lu, 12 Wei-hsin Sun, 5 Wean-shun Tsay, 5<br />
Wen Xu, 2 Haojing Yan, 2 Bing Zhao, 1 and Zheng Zheng 13<br />
Received 2001 July 3; accepted 2001 November 20<br />
ABSTRACT<br />
We present a deep, 42.79 hr image of the nearby, edge-on g<strong>al</strong>axy NGC 4565 in the Beijing-Arizona-Taipei-<br />
Connecticut 6660 Å band using the large-format CCD system on the 0.6 m Schmidt telescope at the Xinglong<br />
Station of the Nation<strong>al</strong> Astronomic<strong>al</strong> Observatories of China. Following the procedures previously developed<br />
by our team for the an<strong>al</strong>ysis of deep images of g<strong>al</strong>axies, we obtain a fin<strong>al</strong> image that is c<strong>al</strong>ibrated to an<br />
accuracy of 0.02 mag in zero point and for which we can measure g<strong>al</strong>axy surface brightness to an accuracy of<br />
0.25 mag at a surface brightness of 27.5 mag arcsec 2 at 6660 Å, corresponding to a distance of 22 kpc from<br />
the center of the disk. The integrated magnitude of NGC 4565 in our filter is m 6660 ¼ 8:99 (=R magnitude of<br />
9.1) to a surface brightness of 28 mag arcsec 2 . We an<strong>al</strong>yze the faint outer parts of this g<strong>al</strong>axy using a twodimension<strong>al</strong><br />
model comprised of three components: an exponenti<strong>al</strong> thin disk, an exponenti<strong>al</strong> thick disk, and<br />
a power-law h<strong>al</strong>o. Combined with a need to provide a cutoff radius for the disk, a tot<strong>al</strong> of 12 param<strong>et</strong>ers are<br />
included in our model. We d<strong>et</strong>ermine the best v<strong>al</strong>ues of our model param<strong>et</strong>ers via 10,000 random initi<strong>al</strong> v<strong>al</strong>ues,<br />
3700 of which converge to fin<strong>al</strong> v<strong>al</strong>ues. We then plot the 2 for each converged fit versus param<strong>et</strong>er v<strong>al</strong>ue<br />
for each of the 12 param<strong>et</strong>ers. The thin-disk and thick-disk param<strong>et</strong>ers that we d<strong>et</strong>ermine here are consistent<br />
with those of previous studies of this g<strong>al</strong>axy. However, our very deep image permits a b<strong>et</strong>ter d<strong>et</strong>ermination of<br />
the power-law fit to the h<strong>al</strong>o, constraining this power law to be b<strong>et</strong>ween r 3:2 and r 4:0 , with a best-fit v<strong>al</strong>ue of<br />
r 3:88 . We find the axis ratio of the h<strong>al</strong>o to be 0.44 and its core radius to be 14.4 kpc (for an adopted distance<br />
of 14.5 Mpc). We <strong>al</strong>so agree with others that the bulge of NGC 4565 is fitted well by an exponenti<strong>al</strong> luminosity<br />
distribution with a sc<strong>al</strong>e height similar to that found for the thin disk.<br />
Key words: g<strong>al</strong>axies: bulges — g<strong>al</strong>axies: h<strong>al</strong>os — g<strong>al</strong>axies: individu<strong>al</strong> (NGC 4565) —<br />
g<strong>al</strong>axies: photom<strong>et</strong>ry — g<strong>al</strong>axies: structure<br />
On-line materi<strong>al</strong>: machine-readable tables<br />
1. INTRODUCTION<br />
In this paper we continue our investigations into the faint<br />
surface brightness distributions of edge-on g<strong>al</strong>axies using<br />
data obtained as part of the Beijing-Arizona-Taipei-<br />
Connecticut (<strong>BATC</strong>) Multicolor Survey of the Sky (see Fan<br />
1 Nation<strong>al</strong> Astronomic<strong>al</strong> Observatories, Chinese Academy of Sciences,<br />
Beijing 100012, China; wu@vega.bac.pku.edu.cn.<br />
2 Department of Physics and Astronomy, Box 871504, Arizona State<br />
University, Tempe, AZ 85287–1504.<br />
3 Graduate School, Chinese Academy of Sciences, Beijing 100080,<br />
China.<br />
4 Department of Astronomy, University of Texas at Austin, Austin,<br />
TX 78712.<br />
5 Institute of Astronomy, Nation<strong>al</strong> Centr<strong>al</strong> University, Chung-Li,<br />
Taiwan, China.<br />
6 Department of Physics, Tianjin Norm<strong>al</strong> University, China.<br />
7 Center for Astrophysics, University of Science and Technology of<br />
China, Hefei 230026, China.<br />
8 Center for Space Astrophysics and Department of Astronomy, Yonsei<br />
University, Seoul 120-749, Korea.<br />
9 Princ<strong>et</strong>on University Observatory, Princ<strong>et</strong>on, NJ 08544.<br />
10 Department of Physics, University of Arizona, Tucson, AZ 85721.<br />
11 The Partner Group of MPI für Astrophysik, Shanghai Astronomic<strong>al</strong><br />
Observatory, Shanghai 200030, China.<br />
12 Department of Physics and Astronomy, Western Connecticut State<br />
University, Danbury, CT 06810.<br />
13 Department of Astronomy, Ohio State University, Columbus,<br />
OH 43210.<br />
1364<br />
<strong>et</strong> <strong>al</strong>. 1996; Yan <strong>et</strong> <strong>al</strong>. 2000). In previous papers d<strong>et</strong>ailing our<br />
investigations of NGC 5907 (Shang <strong>et</strong> <strong>al</strong>. 1998; Zheng <strong>et</strong> <strong>al</strong>.<br />
1999), we showed that this g<strong>al</strong>axy does not have a luminous<br />
h<strong>al</strong>o, counter to what was previously suggested (Sack<strong>et</strong>t<br />
<strong>et</strong> <strong>al</strong>. 1994; Morrison, Boroson, & Harding 1994). Rather,<br />
our images showed a faint ring around NGC 5907, likely<br />
the result of the tid<strong>al</strong> disruption of a dwarf g<strong>al</strong>axy.<br />
The existence of very faint surface brightness features<br />
around edge-on spir<strong>al</strong> g<strong>al</strong>axies is further investigated here<br />
with <strong>BATC</strong> observations of the well-known g<strong>al</strong>axy NGC<br />
4565. As opposed to NGC 5907, NGC 4565 is at a high<br />
G<strong>al</strong>actic latitude (86=44), implying that its h<strong>al</strong>o should be<br />
less contaminated by bright G<strong>al</strong>actic stars than are our<br />
observations of NGC 5907. NGC 4565 is classified as Sb<br />
(de Vaucouleurs <strong>et</strong> <strong>al</strong>. 1991). We place it at a distance of<br />
14.5 Mpc, based on its distance in the Mark III cat<strong>al</strong>og<br />
(1043 km s 1 ; Willick <strong>et</strong> <strong>al</strong>. 1996) and a Hubble constant of<br />
72 km s 1 Mpc 1 (Freedman <strong>et</strong> <strong>al</strong>. 2001). It is known to<br />
have a Seyfert nucleus (Ho <strong>et</strong> <strong>al</strong>. 1997) and has been much<br />
studied in the past in terms of optic<strong>al</strong> surface photom<strong>et</strong>ry<br />
(Jensen & Thuan 1982, hereafter JT; van der Kruit 1979;<br />
van der Kruit & Searle 1981, hereafter KS; Kormendy &<br />
Bruzu<strong>al</strong> 1978; Hamabe <strong>et</strong> <strong>al</strong>. 1980; Näslund & Jörsäter<br />
1997, hereafter NJ; D<strong>et</strong>tmar & Wielebinski 1986). Most of<br />
these earlier studies were based on photographic data. The<br />
V-band data of NJ used a CCD with a relatively sm<strong>al</strong>l field<br />
of view, making it difficult for them to accurately d<strong>et</strong>ermine
PHOTOMETRY OF NGC 4565 1365<br />
sky-background levels. Infrared J, H, and K imaging by<br />
Rice (1996, hereafter R96) compl<strong>et</strong>es the existing photom<strong>et</strong>ric<br />
imaging data on this g<strong>al</strong>axy.<br />
Our observations and the d<strong>et</strong>ails of our reduction of the<br />
data that we have obtained for NGC 4565 are given in x 2.<br />
The measurement of the luminosity profiles and error an<strong>al</strong>ysis<br />
are presented in x 3. Section 4 gives the results of model<br />
fitting, comparison, and possible systematic effects from the<br />
point-spread function (PSF) and disk inclination. The last<br />
section summarizes the main results of this paper.<br />
2. OBSERVATIONS AND DATA REDUCTION<br />
2.1. Observations<br />
Observations of NGC 4565 were obtained with the 60/90<br />
cm Schmidt telescope at the Xinglong Station of the<br />
Nation<strong>al</strong> Astronomy Observatories of China, using a thick<br />
Ford 2048 2048 CCD with 15 lm pixels at the f/3 prime<br />
focus. The field of view of this CCD is 58 0 58 0 and the sc<strong>al</strong>e<br />
is 1>7 pixel 1 . With the nearly 1 field of view, there is sufficient<br />
sky in a single frame such that objects with visu<strong>al</strong> sizes<br />
less than 30 0 can have their sky background d<strong>et</strong>ermined<br />
accurately. The Lick data-taking system is employed, and<br />
<strong>al</strong>l the CCD images are overscan subtracted (i.e., initi<strong>al</strong>ly<br />
bias subtracted) during the readout time (Zheng <strong>et</strong> <strong>al</strong>. 1999).<br />
The filter used for the observations reported here is the<br />
<strong>BATC</strong> filter with a centr<strong>al</strong> wavelength of 6660 Å and bandwidth<br />
of 480 Å (Fan <strong>et</strong> <strong>al</strong>. 1996; Yan <strong>et</strong> <strong>al</strong>. 2000). This filter<br />
is a good compromise b<strong>et</strong>ween g<strong>et</strong>ting as far to the red as<br />
possible and avoiding many bright sky emission lines with<br />
the broadest possible filter. Indeed, <strong>al</strong>l of the <strong>BATC</strong> filters<br />
are designed to avoid contamination by emission lines from<br />
the night sky (see Fan <strong>et</strong> <strong>al</strong>. 1996).<br />
We obtained 190 images of NGC 4565 from 1995 to 1997,<br />
of which we deemed 150 images taken in 22 runs (Table 1)<br />
as suitable for an<strong>al</strong>ysis. Most of these images are of exposure<br />
times 900–1200 s. In a given night, <strong>al</strong>l exposures were<br />
dithered randomly at a level of 10 pixels to facilitate<br />
remov<strong>al</strong> of cosmic rays and CCD defects during the data<br />
reduction. The n<strong>et</strong> effect of such dithering is to reduce the<br />
full exposure field of view to less than the full field of the<br />
CCD. All images used in this an<strong>al</strong>ysis have FWHM seeings<br />
b<strong>et</strong>ween 1.7 and 2.6 pixels, or 2>9–4>4, somewhat larger<br />
than the typic<strong>al</strong> seeing at the Xinglong observing station.<br />
During the observations the gain of the CCD system was<br />
adjusted sever<strong>al</strong> times (for various reasons owing to having<br />
the CCD system work well), resulting in gains of 3.7 e<br />
ADU 1 in 1995, 4.1 e ADU 1 in 1996, and 3.3 e ADU 1<br />
in 1997. Readout noise was constant (12 e ) during the three<br />
years.<br />
2.2. Bias and Dark<br />
The mean v<strong>al</strong>ue of the overscan-subtracted bias was stable<br />
within any 1 month period of time. Ten bias frames (five<br />
at the start of the night, five at the end) are taken daily for<br />
the <strong>BATC</strong> program. Since we can track the stability of the<br />
bias during the year, we are able to average from 200 to 300<br />
individu<strong>al</strong> bias frames for each night of observation, which<br />
removes any stable structure in the bias frame (any variable<br />
level is removed via the overscan subtraction). It is this average<br />
of many bias frames that is subtracted from the images<br />
of a given night. The CCD dark count has been constantly<br />
monitored throughout the <strong>BATC</strong> survey and has <strong>al</strong>ways<br />
TABLE 1<br />
Brief Observation Log of NGC 4565<br />
Date N a (s)<br />
Exposure Time b<br />
Gain<br />
(e ADU 1 )<br />
1995 Jan 28 ........ 1 1800 3.7<br />
1995 Mar 3......... 8 9600 3.7<br />
1995 Mar 4......... 2 1800 3.7<br />
1995 May 5 ........ 2 2400 3.7<br />
1995 May 6 ........ 7 6623 3.7<br />
1995 May 24....... 4 3720 3.7<br />
1996 Jan 21 ........ 4 4800 4.1<br />
1996 Feb 17........ 17 15300 4.1<br />
1996 Feb 18........ 20 18000 4.1<br />
1996 Feb 19........ 20 18000 4.1<br />
1996 Feb 20........ 16 14400 4.1<br />
1996 Feb 21........ 4 3600 4.1<br />
1997 Mar 15 ....... 4 4800 3.3<br />
1997 Mar 29 ....... 3 3600 3.3<br />
1997 Mar 30 ....... 1 1200 3.3<br />
1997 Apr 4 ......... 4 4800 3.3<br />
1997 Apr 5 ......... 6 7200 3.3<br />
1997 Apr 8 ......... 5 6000 3.3<br />
1997 Apr 9 ......... 7 8400 3.3<br />
1997 Apr 10........ 5 6000 3.3<br />
1997 Apr 11........ 6 7200 3.3<br />
1997 May 28....... 4 4800 3.3<br />
Tot<strong>al</strong>.................. 150 154043<br />
a Numbers of frames observed.<br />
b Tot<strong>al</strong> exposure time in one night.<br />
been found to be stable and rather free of gradients. As the<br />
average dark count per pixel is 3 e hr 1 , the dark-count<br />
level in a 42.8 hr exposure is 128 e pixel 1 , or 0.04% of the<br />
sky level in this combined image, and the spati<strong>al</strong> variation<br />
of dark is even sm<strong>al</strong>ler, i.e., of negligible importance. This<br />
constant dark-count v<strong>al</strong>ue was sc<strong>al</strong>ed to exposure time for<br />
each image, then subtracted.<br />
2.3. Flat Field<br />
As d<strong>et</strong>ailed in our previous papers (see Fan <strong>et</strong> <strong>al</strong>. 1996;<br />
Zheng <strong>et</strong> <strong>al</strong>. 1999), the <strong>BATC</strong> program has developed the<br />
means by which we can use dome flats to obtain accurate,<br />
high sign<strong>al</strong>-to-noise (S/N), flat fields for flat-fielding sky<br />
images. Briefly, the Xinglong Schmidt telescope is equipped<br />
with a UV-transparent plastic diffuser plate that can be<br />
firmly placed directly in front of the Schmidt corrector. The<br />
diffuser provides randomly scattered light to the corrector,<br />
reproducing the flux from a uniform sky. Such a m<strong>et</strong>hod is<br />
necessary to accurately flat-field our images, since Wild<br />
(1997) points out that over a 1 sc<strong>al</strong>e, no part of the sky is<br />
re<strong>al</strong>ly flat. Addition<strong>al</strong>ly, this fact is attested to by the many<br />
<strong>BATC</strong> images our survey has obtained. We note, however,<br />
that it is only with narrow- or intermediate-band filters that<br />
this diffuser on a Schmidt telescope can produce reliable flat<br />
fields. Otherwise, the dome flat field can introduce secondorder<br />
color terms to broadband observations that must be<br />
removed using direct sky images (Fan <strong>et</strong> <strong>al</strong>. 1996).<br />
We take 12 dome flats each day, each with exposure times<br />
of 150 s. This length of exposure reduces the effect of the<br />
finite time for shutter opening and closing, resulting in a<br />
spurious gradient of less than 0.013% (see x 3.3). All 12<br />
dome flats in 1 day are combined as the fin<strong>al</strong> flat field to correct<br />
the frames obtained on the same night. The tot<strong>al</strong> count
1366 WU ET AL. Vol. 123<br />
of combined dome flats is about 840,000 e pixel 1 , far<br />
higher than that of the sky background (about 2000 e<br />
pixel 1 ) in a single-exposure frame.<br />
2.4. Image Combination<br />
Air-mass corrections have to be done for our images on a<br />
pixel-by-pixel basis, since there exists close to a 1% gradient<br />
in air-mass correction over 1 deg 2 , even at an <strong>al</strong>titude of 60 .<br />
To take into account the different s<strong>et</strong>s of data (gain differences,<br />
dithering, seeing differences, <strong>et</strong>c.), we combine these<br />
images in two steps. First, we separated the image frames<br />
into 11 groups. Each group includes the frames observed in<br />
the same state of instrument system and similar observation<br />
conditions (e.g., similar seeing). On average, the observations<br />
for a given night are in the same group. The availability<br />
of hundreds of well-defined point sources (both stars and<br />
distant g<strong>al</strong>axies) in these frames aided the combination of<br />
<strong>al</strong>l frames into a common system. This combination<br />
accounts for dithered frames as well as slight rotations in<br />
the CCD chip from year to year. To g<strong>et</strong> <strong>al</strong>l combined images<br />
to the same effective seeing radius of 2.3 pixels (4 00 ), some of<br />
the combined images were convolved with Gaussian functions<br />
to add sm<strong>al</strong>l addition<strong>al</strong> v<strong>al</strong>ues of seeing. Three sigma<br />
rejection was used to remove cosmic rays, hot points, bad<br />
pixels, and Schmidt telescope–related ghost images. The<br />
fin<strong>al</strong> image shown in Figure 1 is the result of merging the 11<br />
combined frames, a tot<strong>al</strong> of 42.79 hr of observation.<br />
2.5. Flux C<strong>al</strong>ibration<br />
Photom<strong>et</strong>ric c<strong>al</strong>ibration was provided by the five nights<br />
that were photom<strong>et</strong>ric (1995 March 4, 1995 March 6, 1997<br />
January 6, 1997 January 17, and 1997 April 16). Following<br />
the now-standard <strong>BATC</strong> photom<strong>et</strong>ric c<strong>al</strong>ibration (see <strong>Zhou</strong><br />
<strong>et</strong> <strong>al</strong>. 2001; Yan <strong>et</strong> <strong>al</strong>. 2000), four Oke & Gunn (1983) standard<br />
stars (HD 19445, HD 84937, BD +26 2606, and BD<br />
+17 4708) are used as <strong>BATC</strong> c<strong>al</strong>ibration stars. The c<strong>al</strong>ibrations<br />
of the five nights agree quite well, yielding a zero-point<br />
accuracy of 0.02 mag as d<strong>et</strong>ermined from 48 bright stars<br />
over the five photom<strong>et</strong>ric nights. This zero point yields a sky<br />
background in the 6660 Å intermediate-band <strong>BATC</strong> filter<br />
of 20.72 mag arcsec 2 , with a corresponding magnitude of<br />
20:30 0:02 mag for 1 e s 1 in the 42.79 hr image. The sky<br />
background is 0.54 mag brighter than it was for our NGC<br />
5907 observations with the same filter (see Zheng <strong>et</strong> <strong>al</strong>.<br />
1999), likely owing to a combination of most of the images<br />
being taken closer to solar maximum (1996–1997) than were<br />
the NGC 5907 images, plus an increase of sky brightness<br />
over the last few years at the Xinglong observing station<br />
(Liu 2001).<br />
3. MEASUREMENT OF PROFILES AND<br />
ERROR ESTIMATE<br />
Accurate d<strong>et</strong>ermination of the sky-background level is a<br />
key point for accurate, deep surface photom<strong>et</strong>ry. Sm<strong>al</strong>l variations<br />
in sky background, due to either undulations in the<br />
CCD sensitivity or star h<strong>al</strong>os, can affect the measurement of<br />
very faint surface brightnesses in g<strong>al</strong>axies. These issues have<br />
been investigated in d<strong>et</strong>ail for our data-taking system in our<br />
previous investigation of NGC 5907 (Zheng <strong>et</strong> <strong>al</strong>.). Here we<br />
employ the same m<strong>et</strong>hodology as Zheng <strong>et</strong> <strong>al</strong>. in obtaining<br />
as accurate a fit to the sky background as our data <strong>al</strong>low.<br />
We first trim our fin<strong>al</strong> image to a size of 1701<br />
pixels 1701 pixels (48
No. 3, <strong>2002</strong> PHOTOMETRY OF NGC 4565 1367<br />
Fig. 1.—Full <strong>BATC</strong> 6660 Å fin<strong>al</strong> image of NGC 4565, comprised of 42.79 hr of observation. The field of view is 1701 pixels 1701 pixels, or<br />
48
1368 WU ET AL. Vol. 123<br />
Fig. 2.—Full mask applied to the 6660 Å fin<strong>al</strong> image of NGC 4565, blocking out <strong>al</strong>l point sources as well as a large region about the g<strong>al</strong>axy itself<br />
fitting function used. To estimate the systematic error of sky<br />
fitting, we again mask the background-subtracted image<br />
and separate the image into 400 adjoining regions of 85<br />
pixels 85 pixels. The standard variation of mean v<strong>al</strong>ues of<br />
these 85 85 boxes is 115 e pixel 1 . This is regarded as the<br />
best estimate of the added error introduced by our skyfitting<br />
procedure. Figure 3 shows the plots of four slices of<br />
the sky-background–subtracted image, which shows the<br />
accuracy of the m<strong>et</strong>hod (see Figs. 7 and 8 in Zheng <strong>et</strong> <strong>al</strong>.).<br />
3.3. Error Estimate<br />
There are two types of errors that can affect our results.<br />
One type is random and yields a Poisson distribution that<br />
can be suppressed by increasing the number of sampled<br />
points. The another type is systematic in nature and is usu<strong>al</strong>ly<br />
independent of sample size. In the following, we will discuss<br />
the error sources individu<strong>al</strong>ly.<br />
Readout noise.—Readout noise is random noise that is<br />
introduced in the process of data readout. For our CCD,<br />
the v<strong>al</strong>ue is 12 e pixel 1 frame 1 . Because the combined<br />
image is made of 150 frames, the fin<strong>al</strong> noise is 147.0 e<br />
pixel 1 . The bins used for the an<strong>al</strong>ysis of the light distribution<br />
in the h<strong>al</strong>o of NGC 4565 vary in size from 24 pixels (a<br />
box of 8 pixels 3 pixels) to 1750 pixels (a box of 35<br />
pixels 50 pixels). Hence, when averaged in this way, the<br />
readout noise is 30.0 e for the sm<strong>al</strong>lest bins and 3.5 e for<br />
the largest bins.<br />
Sky-background photon noise.—As discussed above, the<br />
merging process to produce the fin<strong>al</strong> image effectively<br />
smooths the data, such that the flux in each pixel is an average<br />
of nearly 4 pixel 2 around it. Hence, in the fin<strong>al</strong> image,<br />
the photon error per pixel is 320 e , as opposed to the 550<br />
e one might otherwise expect from a mean sky background<br />
of 302,500 e pixel 1 . Using this v<strong>al</strong>ue, we estimate the photon<br />
sky noise to be 15 e for a region 35 pixels 50 pixels in
No. 3, <strong>2002</strong> PHOTOMETRY OF NGC 4565 1369<br />
Fig. 3.—Four slices of the background-subtracted 6660 Å image to show the accuracy of the sky-background fit. Each slice is averaged over 35 lines of the<br />
image, and only nonmasked pixels are used. If <strong>al</strong>l 35 points are masked, a zero v<strong>al</strong>ue is assigned. The straight lines indicate the zero level. (a) Eight arcminutes<br />
southeast of the minor axis. (b) Eight arcminutes northwest of the minor axis. (c) Eight arcminutes southwest of the major axis. (d ) Eight arcminutes northeast<br />
of the major axis. The large-sc<strong>al</strong>e variation of background subtraction is sm<strong>al</strong>l. The disk of NGC 4565 is seen in the centers of slices a and b. The wings of<br />
subtracted stars are <strong>al</strong>so evident in these slices.<br />
size (our largest bin size) and 130.6 e for a region 8<br />
pixels 3 pixels in size (our sm<strong>al</strong>lest bin size).<br />
Dark-current noise.—The dark current of our combined<br />
image of 42.79 hr is 128.3 e pixel 1 . This introduces random<br />
noise of 11.3 e pixel 1 . For the sm<strong>al</strong>lest and largest<br />
bins, this v<strong>al</strong>ue reduces to 2.3 e and 0.27 e separately.<br />
Bias-subtraction noise.—Since the readout noise is 12 e<br />
pixel 1 and 200 to 300 bias frames are used to form fin<strong>al</strong><br />
average bias, the error from bias subtraction is about 0.8 e<br />
pixel 1 , yielding 0.02 e pixel 1 for the region of 35<br />
pixels 50 pixels and 0.17 e for the sm<strong>al</strong>lest bins used<br />
here.<br />
Flat field: Random and systematic noise.—The averaged<br />
nightly flat used here is comprised of 12 dome flats with tot<strong>al</strong><br />
counts of about 840,000 e pixel 1 , yielding a photon<br />
noise close to 0.1%, or 330.1 e pixel 1 equiv<strong>al</strong>ent skybackground<br />
counts. Given that that fin<strong>al</strong> image includes<br />
150 shifted, averaged flats, the error per pixel is reduced to<br />
0.009%. This part of the flat-field error is random in nature<br />
and translates to a form<strong>al</strong> error of 0.0002% for the largest<br />
sample bins used here, to 0.0018% for the sm<strong>al</strong>lest bins.<br />
The stability of the large-sc<strong>al</strong>e flat field was checked by<br />
comparing the dome flats from adjacent nights. The average<br />
results of these tests indicate an error of 0.03%, or close to<br />
90 e pixel 1 for our measured sky background. In our<br />
CCD system, the opening and closing time of the shutter is<br />
20 ms and the exposure time of each dome flat is 150 s. So<br />
there exists a 0.013% gradient due to finite shutter speed in<br />
the each dome-flat frame. Combining these two s<strong>et</strong>s of<br />
errors, we estimate that the error from systematic variations<br />
in the large-sc<strong>al</strong>e flat field is 0.033%, equiv<strong>al</strong>ent to 100 e<br />
pixel 1 of the sky background.<br />
Intrinsic variation in g<strong>al</strong>axy brightness.—Following Morrison<br />
<strong>et</strong> <strong>al</strong>. (1994) and Zheng <strong>et</strong> <strong>al</strong>., we can c<strong>al</strong>culate the random<br />
error due to intrinsic variation in the surface brightness<br />
of the g<strong>al</strong>axy. In the terminology introduced by Tonry &<br />
Schneider (1988), m 1 for our image is 20.30 mag, the exposure<br />
time is 154,043 s, the distance is 14.5 Mpc, and M 6660 is<br />
adopted as 0 (Zheng <strong>et</strong> <strong>al</strong>. 1999). In the case of 300 e<br />
pixel 1 from the g<strong>al</strong>axy (equ<strong>al</strong> to a surface brightness of<br />
28.23 mag arcsec 2 ), this error is 53.8 e pixel 1 , or an error<br />
of 18%. This translates to an average error of 1.29 e for the<br />
largest bins used here and to 10.98 e for the sm<strong>al</strong>lest bins.<br />
Background subtraction.—There are two types of background-subtraction<br />
errors, both dominated by systematic<br />
effects. One is the accuracy of the sky-background subtraction,<br />
for which we adopt the v<strong>al</strong>ue of 115 e obtained above.<br />
The second comes from imperfect star subtraction, especi<strong>al</strong>ly<br />
for saturated stars. For this we adopt an average error<br />
of 100 e pixel 1 by checking the regions in which stars are<br />
subtracted. We acknowledge that this error can be significantly<br />
higher for selected stars, especi<strong>al</strong>ly for the saturated<br />
stars that are so close to NGC 4565. For the true errors<br />
involved in star subtraction, we must look to the consistency<br />
of the luminosity profiles at faint surface brightness levels.<br />
3.4. The Tot<strong>al</strong> Error Budg<strong>et</strong><br />
All the sources of errors discussed are listed in Table 2.<br />
We assume that the mean count per pixel from the object<br />
g<strong>al</strong>axy is 300 e (i.e., in its faint h<strong>al</strong>o), a sky level of 302,500<br />
e , and bin sizes of 35 pixels 50 pixels and 8 pixels 3 pixels<br />
for surface photom<strong>et</strong>ry. This leads to a fin<strong>al</strong> error of<br />
close to 400 e pixel 1 . Errors for each bin are c<strong>al</strong>culated<br />
based on the number of nonmasked pixels in that bin, ratioed<br />
to the error expected for <strong>al</strong>l pixels in that bin having<br />
data.<br />
Since photon noise in the sky is the dominant source of<br />
error in our data, we give the expected error per bin for both<br />
the sm<strong>al</strong>lest bin that we use for R-profiles (8 pixels 3 pixels)<br />
and the largest bin that we use for z-profiles (35<br />
pixels 50 pixels). The error for the faintest part of NGC<br />
4565 is close to 183 e pixel 1 ,or63e arcsec 2 . That is, the<br />
relative error of measured flux at 28.77 mag arcsec 2 is<br />
100%, leading to an error bar of 0.75 mag arcsec 2 . This <strong>al</strong>so<br />
corresponds to an error of 0.25 mag arcsec 2 at a surface<br />
brightness of 27.5 mag arcsec 2 . In fact, the error is a little<br />
higher than this, because there exist masked regions in the
1370 WU ET AL. Vol. 123<br />
TABLE 2<br />
The Error Estimation<br />
Source of Variation e pixel<br />
1<br />
Percent<br />
35 50 Bin a<br />
(e ) Percent<br />
8 3 Bin a<br />
(e ) Percent<br />
Readout noise............................................. 147.0 0.049 3.5 0.001 30.0 0.010<br />
Photon noise of sky..................................... 320.0 0.106 15.0 0.005 130.6 0.043<br />
Dark ........................................................... 11.3 0.004 0.27 0.0001 2.3 0.0008<br />
Bias (form<strong>al</strong>)............................................... 0.8 0.0003 0.02 0.0000 0.17 0.0001<br />
Flat field (sm<strong>al</strong>l sc<strong>al</strong>e/pixel sc<strong>al</strong>e)................. 26.9 0.009 0.6 0.0002 5.1 0.0017<br />
Flat field (large sc<strong>al</strong>e/>100 pixels sc<strong>al</strong>e) ...... 100.0 0.033 100.0 0.033 100.0 0.033<br />
Surface brightness fluctuations b .................. 53.8 0.018 1.29 0.0004 10.98 0.0036<br />
Background subtraction ............................. 115.0 0.038 115.0 0.038 115.0 0.038<br />
Star subtraction .......................................... 100.0 0.033 100.0 0.033 100.0 0.033<br />
Tot<strong>al</strong>........................................................... 401.2 0.133 182.9 0.060 226.6 0.075<br />
a Error in surface photom<strong>et</strong>ry for bins of 35 50 or 8 3 at a count of sky level.<br />
b Here assuming 300 e 1 pixel 1 from the g<strong>al</strong>axy.<br />
measured boxes. The main sources of error are from largesc<strong>al</strong>e<br />
variation of flat field, sky fitting, and residu<strong>al</strong>s from<br />
star subtraction.<br />
4. ANALYSIS AND RESULTS<br />
4.1. Luminosity Profiles<br />
As others have done (see NJ), we use a contour map to<br />
d<strong>et</strong>ermine the position angle of the major axis. Then the<br />
sky-subtracted image is rotated to that angle to put the<br />
major axis of the object g<strong>al</strong>axy <strong>al</strong>ong the x-axis direction.<br />
At the same time, <strong>al</strong>l circular masks but the three masks<br />
used for the object g<strong>al</strong>axy are transformed to the new coordinate<br />
system and imposed on the rotated image (Fig. 4).<br />
For purposes of an<strong>al</strong>ysis, we measure the luminosity profiles<br />
of NGC 4565 in two orthogon<strong>al</strong> directions. One direction<br />
is par<strong>al</strong>lel to the g<strong>al</strong>axy minor axis (the ‘‘ z ’’ direction);<br />
the other is par<strong>al</strong>lel to the major axis (the ‘‘ R ’’ direction).<br />
We sample the z-direction in discr<strong>et</strong>e lengths (par<strong>al</strong>lel to the<br />
major axis) of 35 pixels (1 0 ) on both sides of the major axis.<br />
We employ bins of varying width perpendicular to the<br />
major axis (i.e., <strong>al</strong>ong the z-direction): from 1 pixel when<br />
z ¼ 0 (i.e., on the major axis) to 50 pixels for the largest z<br />
distances (7 0 ). This m<strong>et</strong>hodology yields bin sizes that vary<br />
from 35 pixels 1 pixel to 35 pixels 50 pixels. Only<br />
unmasked pixels are used, and the flux cited is the median<br />
v<strong>al</strong>ue for that bin. The measured z-profiles are shown in<br />
Figure 5. Here we adopt a distance of 14.5 Mpc, with<br />
1 00 ¼ 0:0703 kpc.<br />
We see that the four z-profiles in each plot (i.e., <strong>al</strong>l four<br />
quadrants of the g<strong>al</strong>axy) agree reasonably well down to surface<br />
brightness of 28 mag arcsec 2 , or a level of 0.12% of the<br />
sky within a radius of 6 0 . Greater than that distance, the<br />
well-known warp in the disk of this g<strong>al</strong>axy (southeast to<br />
northwest; see Sancisi 1976; van der Kruit 1979; NJ; and<br />
below) begins to break down the symm<strong>et</strong>ry. The z-profiles<br />
are tabulated in Table 3 (full table in electronic form).<br />
The R-series of profiles are par<strong>al</strong>lel to the major axis with<br />
z-distance: 0 00 ,10 00 ,20 00 ,30 00 ,40 00 ,60 00 ,80 00 , 100 00 , and 120 00 ,<br />
respectively. Since the z-profiles decrease quickly at sm<strong>al</strong>l z<br />
and relatively slowly at larger z, the sizes of rectangles are<br />
changed from 8 pixels 3 pixels at z ¼ 0 00 to 8 pixels 11<br />
pixels at z ¼ 120 00 . The measured R-profiles are <strong>al</strong>so in Figure<br />
5. The asymm<strong>et</strong>ries of the northwest and southeast parts<br />
are <strong>al</strong>so shown in the R-plots. The data are listed in Table 4.<br />
4.2. Warp<br />
Figure 6 shows the centr<strong>al</strong> points of the profiles par<strong>al</strong>lel<br />
to the minor axis. This was d<strong>et</strong>ermined by keeping the upper<br />
and lower profiles in the best agreement. By plotting these<br />
centr<strong>al</strong> points as a function of radius in this g<strong>al</strong>axy, we map<br />
out its warp from the southeast to northwest sides. The<br />
northwest warp was first found in H i (Sancisi 1976), and<br />
the optic<strong>al</strong> warp of both sides was discussed by NJ.<br />
The figure shows that the stellar warp starts at 21 kpc<br />
from the center of g<strong>al</strong>axy and is less distorted than that of<br />
NGC 5907 (Zheng <strong>et</strong> <strong>al</strong>. 1999; Morrison <strong>et</strong> <strong>al</strong>. 1994), whose<br />
warp starts from 4.1 kpc. In fact, the starting points of the<br />
warp are asymm<strong>et</strong>ric: 21 kpc northwest and 25 kpc southeast.<br />
This causes the asymm<strong>et</strong>ries in the z-plots and R-plots<br />
(Fig. 5). The amplitude of the warp increases rapidly after it<br />
begins, becoming more than 1 kpc from the centr<strong>al</strong>ly<br />
defined major axis after a distance of 30 kpc. We plan to<br />
take further deep images of NGC 4565 to b<strong>et</strong>ter explore its<br />
fainter stellar populations, including those in its warp.<br />
4.3. Comparison with Previous Work<br />
Jensen & Thuan (1982) present the luminosity profile of<br />
NGC 4565 in the B and R bands, using photographic data.<br />
As our intermediate-band i filter centered at 6660 Å is quite<br />
similar to the R band (see Fan <strong>et</strong> <strong>al</strong>. 1996), it is straightforward<br />
to compare with JT’s results. <strong>Zhou</strong> <strong>et</strong> <strong>al</strong>. (<strong>2002</strong>) give<br />
the transformation b<strong>et</strong>ween the <strong>BATC</strong> i band and R band<br />
as R ¼ m 6660 þ 0:1048. The data of JT are then compared to<br />
our own as a function of the z-direction for six v<strong>al</strong>ues of R,<br />
as shown in Figure 7. Here we plot the difference b<strong>et</strong>ween<br />
observed profiles and our fitted profile, as a function of z-<br />
distance. In gener<strong>al</strong>, JT’s data (upper plots) agree with ours<br />
(lower plots) within 0.5 mag, but the data of JT become systematic<strong>al</strong>ly<br />
fainter than ours at large radii and z-distances.<br />
Given that the data of JT are photographic, their faint v<strong>al</strong>ues<br />
are more subject to larger systematic problems than<br />
ours.<br />
4.4. The Adopted Model<br />
Previous studies have shown that one single disk cannot<br />
fit the fainter parts of the z-profiles of NGC 4565 reasonably<br />
(Jensen & Thuan 1982; Shaw & Gilmore 1989, hereafter<br />
SG; NJ). Rather, for the z-profiles we adopt a three-component<br />
model: thin disk (seen at inclination i), thick disk (see
No. 3, <strong>2002</strong> PHOTOMETRY OF NGC 4565 1371<br />
Fig. 4.—Image that results from sky subtracting a two-dimension<strong>al</strong> background from the fin<strong>al</strong> image, with the fin<strong>al</strong> point-source masks still in place. We<br />
have rotated the image so that the major axis of the g<strong>al</strong>axy lies <strong>al</strong>ong the x-axis. Here we present only the centr<strong>al</strong> 700 pixels 700 pixels region of the image.<br />
Burstein 1979), and h<strong>al</strong>o. The z-structure for the thin and<br />
thick disks adopted is that of the sech 2 ðzÞ model (van der<br />
Kruit & Searle 1981), which has a density distribution of a<br />
self-gravitating isotherm<strong>al</strong> she<strong>et</strong> in the z-direction. Alternate<br />
fits proposed by de Grijs & van der Kruit 1996 [i.e.,<br />
exponenti<strong>al</strong> or sech (z) light distributions], while fitting b<strong>et</strong>ter<br />
at sm<strong>al</strong>l z-v<strong>al</strong>ues, are not as physic<strong>al</strong>ly motivated as the<br />
sech 2 model. Moreover, <strong>al</strong>l three models show similar<br />
behavior at large z, showing that the different z models do<br />
not affect the model of the h<strong>al</strong>o that one derives for edge-on<br />
g<strong>al</strong>axies. A standard exponenti<strong>al</strong> disk was used in the radi<strong>al</strong><br />
direction (r), well away from the bulge.<br />
The density distribution of both the thin and the thick<br />
disks is described by<br />
ðr; zÞ ¼ 0 e<br />
ð r=h r Þ sech 2 ðz=z 0 Þ ; ð1Þ<br />
with z 0 and h r as the disk sc<strong>al</strong>e height and sc<strong>al</strong>e length and z 0<br />
equ<strong>al</strong> to twice the sc<strong>al</strong>e height h z of the exponenti<strong>al</strong> model.<br />
As g<strong>al</strong>axy disks do not go to infinity in either the z- or the r-<br />
directions (see Fig. 4), we introduce a cutoff in the r-distribution<br />
at r max , beyond which for r > r max , ðr; zÞ ¼0. For an<br />
edge-on g<strong>al</strong>axy, this means<br />
lðR; zÞ ¼l 0 2:5 log 10<br />
Z z<br />
rmax<br />
<br />
2 sech 2 e<br />
ð r=h r Þ r<br />
pffiffiffiffiffiffiffiffiffiffiffiffiffiffiffi<br />
dr : ð2Þ<br />
z 0 R r 2 R 2<br />
Here, R is the projected distance from the center <strong>al</strong>ong the<br />
major axis.<br />
A power-law h<strong>al</strong>o is introduced as the third component,<br />
with its luminosity distribution modeled as in NJ:<br />
ðr; zÞ ¼<br />
0<br />
; ð3Þ<br />
f1 þ½r 2 þ ðz=qÞ 2 Š=r 2 0g=2
Fig. 5.—The z-profiles (upper plots) and R-profiles (lower plots) of NGC 4565 from our 6660 Å fin<strong>al</strong> image. The four quadrant profiles of the g<strong>al</strong>axy (except<br />
the minor and major axes) are plotted in each subplot. The z-profiles agree reasonably well down to 28 mag within a radius of 6 0 . The obvious asymm<strong>et</strong>ries of<br />
the northwest and southeast parts are shown in both the z-plots and R-plots. The dust lane is indicated by arrows in the first three z-plots. The solid line is our<br />
two disks plus h<strong>al</strong>o model. The dash-dotted and dashed lines are the thin- and the thick-disk models, respectively, and the dotted line is the power-law h<strong>al</strong>o.<br />
All the data are well fitted by this model. Here 1 00 is 0.0703 kpc.
PHOTOMETRY OF NGC 4565 1373<br />
TABLE 3<br />
Surface Brightness of z-Profiles of NGC 4565 in the i(6660 Å)Band<br />
R<br />
(arcmin)<br />
z<br />
(arcsec)<br />
z<br />
(kpc)<br />
i(6660 Å)<br />
(mag arcsec 2 )<br />
High Error<br />
(mag arcsec 2 )<br />
Low Error<br />
(mag arcsec 2 )<br />
0.00..........<br />
2.57 0.18 19.50 0.04 0.04<br />
5.99 0.42 20.27 0.03 0.03<br />
9.41 0.66 20.59 0.02 0.02<br />
12.83 0.90 20.37 0.02 0.02<br />
16.25 1.14 20.07 0.02 0.02<br />
19.67 1.38 19.85 0.01 0.01<br />
23.09 1.62 19.93 0.01 0.01<br />
26.51 1.86 20.16 0.01 0.01<br />
29.93 2.10 20.42 0.02 0.02<br />
33.35 2.34 20.73 0.02 0.02<br />
Note.—Table 3 is presented in its entir<strong>et</strong>y in the electronic edition of the Astronomic<strong>al</strong><br />
Journ<strong>al</strong>. A portion is shown here for guidance regarding its form and content.<br />
TABLE 4<br />
Surface Brightness of R-Profiles of NGC 4565 in the i(6660 Å)Band<br />
z<br />
(arcsec)<br />
R<br />
(arcsec)<br />
R<br />
(kpc)<br />
i (6660 Å)<br />
(mag arcsec 2 )<br />
High Error<br />
(mag arcsec 2 )<br />
Low Error<br />
(mag arcsec 2 )<br />
0.00........<br />
0.00 0.00 17.55 0.10 0.11<br />
10.26 0.72 18.45 0.09 0.09<br />
20.52 1.44 18.85 0.06 0.06<br />
30.78 2.16 19.23 0.07 0.08<br />
41.04 2.89 19.57 0.07 0.07<br />
51.30 3.61 19.74 0.06 0.06<br />
61.56 4.33 20.01 0.07 0.07<br />
71.82 5.05 20.22 0.06 0.07<br />
82.08 5.77 20.53 0.02 0.02<br />
92.34 6.49 20.53 0.02 0.03<br />
Note.—Table 4 is presented in its entir<strong>et</strong>y in the electronic edition of the Astronomic<strong>al</strong><br />
Journ<strong>al</strong>. A portion is shown here for guidance regarding its form and content.<br />
where r 0 is the core radius, q is the axis ratio, and is the<br />
power index. For an edge-on g<strong>al</strong>axy, this model has the<br />
form (where C is the standard gamma function)<br />
<br />
p ffiffiffi ½ð 1Þ=2Š<br />
lðR; zÞ ¼l 0 2:5 log 10 <br />
ð=2Þ<br />
r 0 ½r2 0 þ R 2 þ ðz=qÞ 2 Š ð1<br />
<br />
4.5. Profile Fitting<br />
4.5.1. Data Used for Fitting<br />
Þ=2 <br />
: ð4Þ<br />
Since its dust lane nearly bisects the major axis of NGC<br />
4565, it is difficult for us to fit <strong>al</strong>l the components of this g<strong>al</strong>axy<br />
(nucleus, bulge, disks, and h<strong>al</strong>o) simultaneously. The<br />
primary purpose of the present paper is to search for luminous<br />
h<strong>al</strong>os in edge-on g<strong>al</strong>axies. Hence, we concentrate only<br />
on the three components whose luminosity distributions<br />
affect the h<strong>al</strong>o of this g<strong>al</strong>axy: thin disk (via projected major<br />
axis), thick disk, and h<strong>al</strong>o. To avoid the possible effect of<br />
nucleus, bulge, dust lane, and warps, only the z-profiles with<br />
2 0 R 7 0 were used in the fit. For R-profiles, we rejected<br />
the profiles <strong>al</strong>ong the dust lane and the points within the<br />
bulge. Though there exist obvious asymm<strong>et</strong>ries b<strong>et</strong>ween the<br />
northwest and southeast parts of g<strong>al</strong>axy, they are treated<br />
here the same because of the fact that large areas in both<br />
sides of the g<strong>al</strong>axy are masked.<br />
A gener<strong>al</strong> 2 m<strong>et</strong>hod was used to estimate the param<strong>et</strong>ers<br />
of the fits. In principle, one should use a weighted fitting<br />
scheme (see SG) of the form<br />
2 ¼ X i<br />
½w i ðl i l fit ÞŠ 2 ; ð5Þ<br />
Fig. 6.—Stellar warp of NGC 4565 measured in the 6660 Å band. The x-<br />
axis is <strong>al</strong>ong the major axis of the g<strong>al</strong>axy. The left is to the southeast and the<br />
right is to the northwest. The warp can be seen on both sides of this g<strong>al</strong>axy,<br />
but starting at different distances on either side.<br />
with l i and l fit as observed and fitted surface brightnesses.<br />
In practice, the v<strong>al</strong>ues assigned to w i depend on what one is<br />
trying to fit. Unfortunately, the manner in which we can<br />
compensate for fainter surface brightness levels (by using<br />
larger sample bins) does not fully compensate for the observation<strong>al</strong><br />
errors in the outer regions, which are much larger<br />
than those in the inner regions. In addition, by sampling
1374 WU ET AL. Vol. 123<br />
Fig. 7.—Comparison of our 6660 Å data with those of JT. Differences b<strong>et</strong>ween observed profiles (upper plots: JT; lower plots: ours) and our fitted profiles<br />
are plotted against model surface brightness. In the lower plots, the solid circles are data from the northwest side of the g<strong>al</strong>axy and the open circles are data<br />
from the southeast side.<br />
with different bin sizes, we have more measurements nearest<br />
the major axis than we do far away from the major axis.<br />
Thus, we have more points in our fit for the inside regions<br />
with sm<strong>al</strong>l uncertainties than those for the outside with large<br />
uncertainties. Strictly error weighting the data would bias<br />
the fits toward the innermost data. As such, we chose to give<br />
equ<strong>al</strong> weight to the bins, which b<strong>et</strong>ter accounts for the larger<br />
number of bins close to the major axis. The fitting <strong>al</strong>gorithm<br />
was implemented using the Levenberg-Marquardt technique,<br />
with the subroutine used taken from Numeric<strong>al</strong><br />
Recipes (Press <strong>et</strong> <strong>al</strong>. 1992).<br />
4.5.2. Estimates of Param<strong>et</strong>ers<br />
Three param<strong>et</strong>ers must be d<strong>et</strong>ermined before fitting: the<br />
coordinates of the g<strong>al</strong>axy center x c and y c and the sky-background<br />
v<strong>al</strong>ue. The latter component has <strong>al</strong>ready been<br />
removed from the data to be an<strong>al</strong>yzed. The effect of inclina-
No. 3, <strong>2002</strong> PHOTOMETRY OF NGC 4565 1375<br />
TABLE 5<br />
The Confined Ranges of Initi<strong>al</strong> Param<strong>et</strong>ers<br />
Thin Disk Thick Disk H<strong>al</strong>o (Power Law)<br />
l 0 : 20–23 mag arcsec 2 l 0 : 23–27 mag arcsec 2 l 0 : 22–27 mag arcsec 2<br />
z 0 : 0.6–1.5 kpc z 0 : 1.2–2.9 kpc r 0 : 0–22 kpc<br />
h r : 5.8–11.6 kpc h r : 7.2–29.0 kpc : 2–5<br />
r max : 29–38 kpc39 kpc q: 0.1–0.9<br />
tion is neglected here (but considered later), since NGC<br />
4565 is so nearly edge-on. This leaves us 12 param<strong>et</strong>ers to<br />
fit, namely, three surface brightnesses l 01 , l 02 , and l 03 (with<br />
1 = thin disk, 2 = thick disk, and 3 = h<strong>al</strong>o), the sc<strong>al</strong>e heights<br />
z 01 and z 02 of thin- and thick-disks components in the z-<br />
direction and sc<strong>al</strong>e lengths h r1 and h r2 in the radi<strong>al</strong> direction,<br />
the cutoff radii r max1 and r max2 of the two kinds of disks, and<br />
the core radius r 0 , axis ratio q, and power index of the<br />
h<strong>al</strong>o.<br />
Unfortunately, we have too many param<strong>et</strong>ers for the fitting<br />
procedure to converge successfully. As discussed by<br />
Fry <strong>et</strong> <strong>al</strong>. (1999), for three free param<strong>et</strong>ers, the initi<strong>al</strong> estimates<br />
need to be within 20% of the correct v<strong>al</strong>ues for the<br />
model to converge. At the same time, the existence of many<br />
loc<strong>al</strong> minima make the fin<strong>al</strong> fit strongly dependent on the<br />
initi<strong>al</strong> estimate of these param<strong>et</strong>ers.<br />
To find the true minimum and the best fit, we randomly<br />
selected 10,000 s<strong>et</strong>s of 12 initi<strong>al</strong> param<strong>et</strong>ers spaced uniformly<br />
as to cover the reasonable range covered by these<br />
param<strong>et</strong>ers (Table 5). Of these 10,000 tries, we found nearly<br />
3700 convergences. The 2 for these 12 param<strong>et</strong>ers from<br />
these 3700 convergences are plotted against the v<strong>al</strong>ue for<br />
finding those convergences in Figure 8. The minimum is<br />
marked as a star symbol in each subplot.<br />
The distributions of l 01 , z 01 , h r1 (i.e., the thin-disk component)<br />
and q (the axis ratio of the h<strong>al</strong>o) are well d<strong>et</strong>ermined<br />
by our data. The axis ratio of the h<strong>al</strong>o that we obtain (0.44)<br />
is in good agreement with that of NJ, who show that q ¼ 0:5<br />
is a b<strong>et</strong>ter fit than q ¼ 1:0 for a two disks plus h<strong>al</strong>o model in<br />
the V band.<br />
The param<strong>et</strong>ers of the thick disk and the power-law h<strong>al</strong>o<br />
have wide 2 distributions. The sc<strong>al</strong>e height of the thick disk<br />
(2.55 kpc) is about twice that of the thin disk and agrees with<br />
the h z ¼ 1 kpc (h z ¼ z 0 =2) given by Burstein (1979) for S0<br />
g<strong>al</strong>axies. The thick-disk sc<strong>al</strong>e length is 11.03 kpc, larger than<br />
that of the thin disk. The luminosity of the thick disk is 20%<br />
of the thin disk. The core radius of the power-law h<strong>al</strong>o is<br />
14.4 kpc, indicating a flat h<strong>al</strong>o. This agrees with the third<br />
component of the three-disk models of NJ and that of SG,<br />
in which the sc<strong>al</strong>e lengths of their third disks are about 13.9<br />
kpc (at a distance of 14.5 Mpc). The v<strong>al</strong>ues of concentrate<br />
in the range of 3.2–4.0, which indicates that there does not<br />
exist an r 2 h<strong>al</strong>o in this g<strong>al</strong>axy. The best power index is 3.88,<br />
b<strong>et</strong>ween the 3.5 of the Milky Way (Zinn 1985) and the 4.0 of<br />
M31 (Pritch<strong>et</strong> & van den Bergh 1994). The cutoff radii of<br />
the thin and the thick disks show sever<strong>al</strong> loc<strong>al</strong> minima,<br />
because of data sampling. The cutoffs of the thin and thick<br />
disks are about 32 and 37 kpc, respectively.<br />
Fig. 8.—V<strong>al</strong>ues of the 2 for the 3700 random fits that converged versus the v<strong>al</strong>ue of the param<strong>et</strong>ers at which they converged. The star symbol in each<br />
subplot is the minimum point adopted as our best-fitting v<strong>al</strong>ue. The v<strong>al</strong>ues of concentrate in the range of 3.2–4.0, ruling out the existence of a luminous h<strong>al</strong>o<br />
in NGC 4565.
1376 WU ET AL. Vol. 123<br />
TABLE 6<br />
Param<strong>et</strong>ers of the Thin Disk plus Thick Disk plus Power-Law H<strong>al</strong>o Model<br />
Thin Disk Thick Disk Power-Law H<strong>al</strong>o<br />
l 0 ¼ 22:32þ0:08 0:04 l 0 ¼ 25:52þ0:41 0:50 l 0 ¼ 26:86þ0:86 0:64 mag arcsec<br />
2<br />
z 0 ¼ 1:17þ0:04 0:04 z 0 ¼ 2:55þ0:22 0:30 r 0 ¼ 14:44þ4:74 4:07 h r ¼ 8:05þ0:34 0:19 h r ¼ 11:03þ1:12 1:88 kpc ¼ 3:88<br />
0:31<br />
þ0:56<br />
r max ¼ 31:84þ0:07 0:12 r max ¼ 36:93þ0:22 0:64 kpc q ¼ 0:44<br />
0:02<br />
þ0:02<br />
ðm 6660 Þ¼8:99 0:02 mag a ðL thick =L thin Þ¼20% b ðL h<strong>al</strong>o =L thin Þ¼21:4% c<br />
a Tot<strong>al</strong> photom<strong>et</strong>ric<strong>al</strong> magnitude of NGC 4565 at 6660 Å to surface brightness of 28 mag<br />
arcsec 2 .<br />
b Luminosity ratio of model thick disk and thin disk.<br />
c Luminosity ratio of model power-law h<strong>al</strong>o and thin disk.<br />
An<strong>al</strong>yses of correlation b<strong>et</strong>ween any two param<strong>et</strong>ers<br />
show that some of the param<strong>et</strong>ers are correlated, which<br />
means some of the param<strong>et</strong>ers cannot be d<strong>et</strong>ermined<br />
independently. For example, we find correlation b<strong>et</strong>ween<br />
z 01 and z 02 and among l 03 , r 0 , and . The similar 2 distributions<br />
of l 03 , r 0 , and in Figure 8 <strong>al</strong>so show such a correlation.<br />
The error for each param<strong>et</strong>er is obtained in the following<br />
way. Random v<strong>al</strong>ues are selected for the observed data such<br />
that they obey a norm<strong>al</strong> distribution, with sigmas d<strong>et</strong>ermined<br />
by the known errors in each sampled bin. We then<br />
obtain the best-fit param<strong>et</strong>ers for that s<strong>et</strong> of data. This procedure<br />
is repeated 300 times, giving us 300 separate d<strong>et</strong>erminations<br />
of the best-fit v<strong>al</strong>ue for each param<strong>et</strong>er. The<br />
statistic<strong>al</strong> standard deviation of each param<strong>et</strong>er from this<br />
procedure is adopted as the fin<strong>al</strong> error for this param<strong>et</strong>er.<br />
The best-fit param<strong>et</strong>ers and errors are listed in Table 6.<br />
Table 6 <strong>al</strong>so lists the tot<strong>al</strong> magnitude in the 6660 Å band to<br />
a surface brightness of 28 mag arcsec 2 , m 6660 ¼ 8:99 (or<br />
broadband R ¼ 9:10 from the <strong>Zhou</strong> <strong>et</strong> <strong>al</strong>. transformation),<br />
which is measured by replacing masked areas around the<br />
g<strong>al</strong>axy by the corresponding parts of the unmasked g<strong>al</strong>axy.<br />
Figure 5 presents the best-fit v<strong>al</strong>ues for the three components<br />
compared to our data in both the z- and R-directions.<br />
The fits are quite good in the range of R ¼ 1 0 –8 0 for the R-<br />
profiles and in the range of z ¼ 30 00 –120 00 for the z-profiles.<br />
As expected, the model deviates significantly from the data<br />
in the region of the bulge (not fitted) and where the warp of<br />
the disk becomes sizeable.<br />
Table 7 compares the dimension<strong>al</strong> param<strong>et</strong>ers obtained<br />
by this study to similar param<strong>et</strong>ers d<strong>et</strong>ermined by other<br />
studies of NGC 4565, since magnitude zero points are too<br />
dependent on the filter that was used. The thin-disk param<strong>et</strong>ers<br />
are consistent among the different an<strong>al</strong>yses. Our v<strong>al</strong>ue<br />
of 8.05 kpc for the thin-disk exponenti<strong>al</strong> sc<strong>al</strong>e length and<br />
1.17 kpc for its sc<strong>al</strong>e height are close to those obtained by<br />
R96, KS, NJ and SG, sc<strong>al</strong>ed to our adopted g<strong>al</strong>axy distance.<br />
The sc<strong>al</strong>e height and sc<strong>al</strong>e length of our fits to the thick disk<br />
agree best with the thick disk in SG’s two disks plus R 1=4<br />
h<strong>al</strong>o model. The thick-disk components of our model are<br />
somewhat larger than the thick disk in the three-disk models,<br />
likely because of the h<strong>al</strong>o being much flatter in the inner<br />
region of NGC 4565 than the models for the third disk used<br />
by these other studies.<br />
TABLE 7<br />
A Comparison of the Param<strong>et</strong>ers Obtained from Different Sources<br />
Component<br />
Filter<br />
Thin-Disk h r<br />
(kpc)<br />
z 0<br />
(kpc)<br />
Thick-Disk h r<br />
(kpc)<br />
z 0<br />
(kpc)<br />
Third-Disk (exp) h z<br />
(kpc) Or H<strong>al</strong>o q <br />
KS ................ B J 8.0 1.15 ... ... ... ... ...<br />
H80............... B 8.8 ... ... ... ... 0.46 3.46<br />
H82............... B 9.7 ... ... ... ... 0.50 4.10<br />
JT ................. B 9.9 ... 9.9 1.88 4.78 0.52 ...<br />
R96............... K 8.4 1.28 a ... ... ... ... ...<br />
B 10.6 1.10 6.2 1.62 3.42 ... ...<br />
SG b ............... R 6.8 1.07 7.5 1.90 4.23 ... ...<br />
NJ b ............... V 8.1 0.87 8.6 1.88 5.1 ... ...<br />
B 8.0 1.20 12.9 2.28 ... 0.37 ...<br />
SG c ............... R 7.0 1.13 9.1 2.29 ... 0.36 ...<br />
KB ................ V ... ... ... ... ... ... 3.46<br />
SOSCB ......... 6040 Å ... ... ... ... ... ... 3.78<br />
This work d .... 6660 Å 8.05 1.17 11.03 2.55 ... 0.44 3.88<br />
Note.—All the v<strong>al</strong>ues in the table are transformed to the distance of 14.5 Mpc. KS: van der Kruit & Searle 1981. H80: Hamabe<br />
<strong>et</strong> <strong>al</strong>. 1980. H82: Hamabe 1982. JT: Jensen & Thuan 1982. R96: Rice 1996. SG: Shaw & Gilmore 1989. NJ: Näslund & Jörsäter<br />
1997. KB: Kormendy & Bruzu<strong>al</strong> 1978. SOSCB: Spinrad <strong>et</strong> <strong>al</strong>. 1978.<br />
a R96 uses sech disk model giving h z ¼ 0:44, which corresponds to z 0 =2.<br />
b The sech 2 þ sech 2 þ exp model.<br />
c The sech 2 þ sech 2 þ R 1=4 h<strong>al</strong>o model.<br />
d The sech 2 þ sech 2 þ power-law h<strong>al</strong>o model.
No. 3, <strong>2002</strong> PHOTOMETRY OF NGC 4565 1377<br />
4.6. Bright versus Faint Parts of NGC 4565<br />
As our data go very faint, one worry is that the very faintest<br />
parts of the PSFs of the bright stars could interfere with<br />
our measurement of the h<strong>al</strong>o of this g<strong>al</strong>axy (such as we<br />
found to be the case in our an<strong>al</strong>ysis of NGC 5907; see Zheng<br />
<strong>et</strong> <strong>al</strong>.). As our fin<strong>al</strong> image of NGC 4565 did not permit us to<br />
fully test the faintest parts of the PSF in a reliable manner,<br />
we separately observed a s<strong>et</strong> of bright stars with the same<br />
CCD param<strong>et</strong>ers. From those observations we construct a<br />
new PSF that can extend to 1700 00 , compared to the extension<br />
of only 510 00 permitted by our fin<strong>al</strong> NGC 4565 image.<br />
(In this we note that even 510 00 is still farther than the radii<br />
considered by either Morrison <strong>et</strong> <strong>al</strong>. 1994 for NGC 5907 or<br />
Fry <strong>et</strong> <strong>al</strong>. 1999 for NGC 4244.) The agreement b<strong>et</strong>ween the<br />
PSF that we obtain from our NGC 4565 image and that<br />
obtained from the speci<strong>al</strong> bright star images is excellent<br />
where they overlap (i.e., interior to 510 00 ).<br />
There are two effects that can, in principle, affect our h<strong>al</strong>o<br />
results. One is scattered light from the nucleus and bulge.<br />
The other is the scattered light from the brighter parts of the<br />
g<strong>al</strong>axy as a whole. To test the first effect, the nucleus and<br />
bulge are separated from the other parts of g<strong>al</strong>axy by subtracting<br />
our best-fitting model from the fin<strong>al</strong> image (see Fig.<br />
11). We then convolve the resulting nucleus and bulge with<br />
the extended PSF. The result is shown in Figure 9. The z-<br />
profiles of our model are represented by solid lines, and the<br />
outer wings due to scattered light from the nucleus and<br />
bulge are represented by dashed lines. We find that scattered<br />
light from the centr<strong>al</strong> region of NGC 4565 is at least 2 mag<br />
arcsec 2 fainter than the model fit everywhere, including on<br />
the minor axis.<br />
To test the effect of scattered light from the g<strong>al</strong>axy as a<br />
whole, we convolved the model with the full PSF (Fig. 9,<br />
dotted line). As is evident, the extended PSF has little effect<br />
on the model that we derive for the faintest parts of NGC<br />
4565, being at most 0.2–0.3 mag different at very faint surface<br />
brightness, where the errors of measurement are at least<br />
that high. We conclude that, within the errors of measurement,<br />
our param<strong>et</strong>ers for the h<strong>al</strong>o of NGC 4565 are not significantly<br />
affected by scattered light from the brighter parts<br />
of the g<strong>al</strong>axy.<br />
4.7. Inclination<br />
We estimate the inclination of the disk of NGC 4565 by<br />
assuming that the thin disk of this g<strong>al</strong>axy is round with a<br />
radius of 38 kpc and the dust lane is flat and lies at the midplane<br />
of the disk. We assume that the upper edge (see Fig. 4)<br />
of the dust lane could be the edge of the round disk. By<br />
measuring the projected distance b<strong>et</strong>ween the upper edge of<br />
the dust lane and the major axis of NGC 4565 in the plane<br />
of the sky, taking into account the radius of the disk, we<br />
obtain an inclination of 87=5, which is somewhat higher<br />
than that of 86 in KS.<br />
Given that our model assumes that the g<strong>al</strong>axy is exactly<br />
edge-on (i ¼ 90 ), we can test how our model changes for<br />
different v<strong>al</strong>ues of i via the following transformation:<br />
Z<br />
pffiffiffiffiffiffiffiffiffiffiffiffi<br />
<br />
r 2 max R 2 z cos i = sin i<br />
<br />
jz<br />
sin i l cos ij<br />
ðR; zÞ ¼ pffiffiffiffiffiffiffiffiffiffiffiffi<br />
sech 2<br />
<br />
exp<br />
r 2 max R 2<br />
z cos i<br />
= sin i<br />
h r<br />
z 0<br />
qffiffiffiffiffiffiffiffiffiffiffiffiffiffiffiffiffiffiffiffiffiffiffiffiffiffiffiffiffiffiffiffiffiffiffiffiffiffiffiffiffiffiffiffiffi<br />
R 2 þðz cos i þ l sin iÞ 2 <br />
dl :<br />
The variable of integration, l, is <strong>al</strong>ong the line of sight. We<br />
plot the minor-axis profiles with 90 ,87=5, and 86 for both<br />
the thin and the thick disks in Figure 10. As might be<br />
expected, the form of the thick disk is relatively insensitive<br />
to the exact inclination used for this g<strong>al</strong>axy. Even the thindisk<br />
model is only slightly more sensitive, having a centr<strong>al</strong><br />
surface brightness 0.1–0.2 mag arcsec 2 fainter for 87=5<br />
than for 90 .<br />
ð6Þ<br />
Fig. 9.—Possible effects of scattered light from the brighter parts of NGC 4565 on the model obtained from its faintest parts. The solid lines are our model,<br />
the dashed lines represent the scattered light from the nucleus and bulges, and the dotted lines are the model convolved with extended PSF.
1378 WU ET AL.<br />
Unfortunately, we cannot appe<strong>al</strong> to HST observations of<br />
this g<strong>al</strong>axy, as such imaging (Kissler-Patig <strong>et</strong> <strong>al</strong>. 1999)<br />
avoided the northeast side because of the bright star there.<br />
The only reasonable interpr<strong>et</strong>ation that we can give to the<br />
existence of an asymm<strong>et</strong>ry in the faint objects around NGC<br />
4565 is that there is obscuring matter b<strong>et</strong>ween NGC 4565<br />
and the background g<strong>al</strong>axies. If this proves to be true (and<br />
we plan to investigate this issue further in another paper),<br />
then it could be evidence for a face-on warp in this g<strong>al</strong>axy.<br />
Such a warp would have to be part of the disk facing away<br />
from us, since the nucleus of this g<strong>al</strong>axy is obviously not<br />
obscured.<br />
Fig. 10.—Effect of inclination on the model profiles of the minor axis of<br />
the thin and thick disks. Three inclinations are considered: 90 (solid lines),<br />
87=5(dotted lines), and 86 (dashed lines).<br />
4.8. Bulge<br />
The bulge can be obtained after subtraction of the disks<br />
and h<strong>al</strong>o. We show the two-dimension<strong>al</strong> distribution of the<br />
bulge and the profile <strong>al</strong>ong the minor axis in Figure 11. The<br />
bulge extends up to 5 kpc, and it is clear that it cannot be<br />
described by the R 1=4 law (dashed line) from 0.7 to 5 kpc.<br />
Rather, an exponenti<strong>al</strong> distribution (see Kormendy &<br />
Bruzu<strong>al</strong> 1978; solid line) with a sc<strong>al</strong>e height of h z ¼ 0:65 kpc<br />
(z 0 =2) is the best fit to the bulge luminosity distribution,<br />
consistent with the v<strong>al</strong>ues of 0.72 kpc d<strong>et</strong>ermined by JT and<br />
0.75 kpc in the K band (R96). We find the bulge to have an<br />
ellipticity of 0.8, based on a simple fit using elliptic<strong>al</strong><br />
isophotes.<br />
Speculation abounds in the literature about the nature of<br />
the bulge seen in NGC 4565. Is it bar shaped, seen with the<br />
long axis projected <strong>al</strong>ong our line of sight (much like the bar<br />
of our own g<strong>al</strong>axy; see Blitz & Spergel 1991) Or is it dynamic<strong>al</strong>ly<br />
coupled to the thin disk (which has a similar exponenti<strong>al</strong><br />
sc<strong>al</strong>e height) so that it takes a peanut shape or boxy<br />
shape In the absence of clear-cut dynamic<strong>al</strong> data on the<br />
motions of stars in the bulge, the photom<strong>et</strong>ric data <strong>al</strong>one<br />
cannot choose among these options. Even so, the nearly<br />
pure exponenti<strong>al</strong> nature of the bulge of NGC 4565 hints<br />
more of a bar than it does of a typic<strong>al</strong> R 1=4 -law bulge.<br />
4.9. Face-on Warp<br />
The striking image of the bulge presented in Figure 11<br />
highlights an issue that <strong>al</strong>so can be seen in the sky-subtracted<br />
image of the whole g<strong>al</strong>axy in Figure 4: there seem to<br />
be far fewer faint objects in the lower southwest side of the<br />
g<strong>al</strong>axy disk than in the upper northeast side of the g<strong>al</strong>axy<br />
disk. As seen in Figure 4, this asymm<strong>et</strong>ry in number of giant<br />
objects seems to extend to 2 0 –3 0 in the southwest direction.<br />
5. SUMMARY<br />
We have obtained deep intermediate-band (6660 Å) surface<br />
photom<strong>et</strong>ry of the nearby, bright, edge-on g<strong>al</strong>axy NGC<br />
4565. The combination of having a nearly 1 deg 2 field of<br />
view, the ability to use the dome to obtain high-S/N flat<br />
fields, accurate subtraction of the PSF wings of stars, and<br />
an accurate m<strong>et</strong>hod for two-dimension<strong>al</strong> sky subtraction<br />
yields a limiting magnitude of 28.77 mag arcsec 2 (at which<br />
the observation<strong>al</strong> error reaches 0.75 mag arcsec 2 , or 0.25<br />
mag at a surface brightness of 27.5 mag arcsec 2 ). The sky<br />
background in our image is 20.72 mag arcsec 2 , about 0.5<br />
mag arcsec 2 brighter than the sky found in our NGC 5907<br />
observations in the same filter (see Zheng <strong>et</strong> <strong>al</strong>. 1999). The<br />
tot<strong>al</strong> magnitude of NGC 4565 in the 6660 Å band is<br />
8:99 0:02 mag (equiv<strong>al</strong>ent to R ¼ 9:10) to a surface<br />
brightness of 28 mag arcsec 2 .<br />
The luminosity distribution of the g<strong>al</strong>axy is presented in a<br />
series of cuts both par<strong>al</strong>lel to its minor axis (z-profiles) and<br />
par<strong>al</strong>lel to its major axis (R-profiles). Excluding the dust<br />
lane, the z-profiles are symm<strong>et</strong>ric in <strong>al</strong>l four quadrants out<br />
to a radius of 6 0 . The z-profiles extend to nearly 30 kpc (at 29<br />
mag arcsec 2 ), farther than given by previous studies of this<br />
g<strong>al</strong>axy.<br />
We construct a two-dimension<strong>al</strong> model of the outer parts<br />
of this g<strong>al</strong>axy comprised of three components (thin disk plus<br />
thick disk plus h<strong>al</strong>o). Altog<strong>et</strong>her, the model includes 12<br />
param<strong>et</strong>ers, including a cutoff radius for the disk. The v<strong>al</strong>ues<br />
of these param<strong>et</strong>ers are d<strong>et</strong>ermined by the 2 v<strong>al</strong>ues<br />
from a series of 3700 initi<strong>al</strong> starting v<strong>al</strong>ues, which eventu<strong>al</strong>ly<br />
converge to distinct v<strong>al</strong>ues. The param<strong>et</strong>ers so derived for<br />
the thin and thick disks gener<strong>al</strong>ly agree with those derived<br />
by previous studies. Since our h<strong>al</strong>o observations go much<br />
deeper than those of previous studies, we obtain a more reliable<br />
measurement of the power-law behavior of the h<strong>al</strong>o,<br />
with its power-law index d<strong>et</strong>ermined to lie b<strong>et</strong>ween 3.2<br />
and 4.0 (best-fit v<strong>al</strong>ue of 3.88). Our observations effectively<br />
rule out the possibility of an r 2 h<strong>al</strong>o in NGC 4565. We<br />
obtain an axis ratio for the h<strong>al</strong>o of this g<strong>al</strong>axy equ<strong>al</strong> to 0.44<br />
and a core radius of 14.4 kpc, which suggest a flattened<br />
ellipsoid.<br />
We test for two factors that could affect our results: scattered<br />
light from the g<strong>al</strong>axy itself and an incorrect v<strong>al</strong>ue used<br />
for the inclination of the g<strong>al</strong>axy disk. We find that neither<br />
significantly affects our results. However, if our data are<br />
accurate enough, the effects would be present, at most, at<br />
the 0.2–0.3 mag arcsec 2 level. We measure an inclination of<br />
NGC 4565 of i ¼ 87=5 from the offs<strong>et</strong> of the dust lane in the<br />
inner disk from the nucleus of the g<strong>al</strong>axy.<br />
We obtain a two-dimension<strong>al</strong> luminosity distribution for<br />
the bulge of NGC 4565 by subtracting our two disks plus
Fig. 11.—Top: Image of the bulge of NGC 4565 produced by subtracting the two disks plus h<strong>al</strong>o model from the fin<strong>al</strong> image. The faint stellar images around<br />
the bulge are likely globular clusters in NGC 4565. Bottom: Minor-axis profile ( filled boxes) of the bulge in NGC 4565 so obtained. The solid line represents<br />
the exponenti<strong>al</strong> model with a sc<strong>al</strong>e height of 0.65 kpc. The dashed line is the R 1/4 law that best fits the outer part of the bulge. The bulge of NGC 4565 is fitted<br />
b<strong>et</strong>ter by an exponenti<strong>al</strong> model than an R 1/4 -law model.
1380 WU ET AL.<br />
h<strong>al</strong>o model from the origin<strong>al</strong> image. The luminosity profile<br />
<strong>al</strong>ong the minor axis of the bulge of NGC 4565 is well fitted<br />
by an exponenti<strong>al</strong> model with a sc<strong>al</strong>e height similar to that<br />
of the thin disk (consistent with what has been found from<br />
previous studies).<br />
In the coming years, our survey will obtain deep images in<br />
<strong>al</strong>l of the 15 <strong>BATC</strong> passbands (see <strong>Zhou</strong> <strong>et</strong> <strong>al</strong>. 2001) of NGC<br />
4565, as well as for a number of other, nearby g<strong>al</strong>axies. With<br />
a compl<strong>et</strong>e sampling of the visible and near-infrared spectra<br />
of these g<strong>al</strong>axies, we will be able to study the stellar populations<br />
in their disks, bulges, and h<strong>al</strong>os.<br />
We thank Professor Qiuhe Peng, Xiangping <strong>Wu</strong>, and<br />
Shude Mao for v<strong>al</strong>uable discussion. Also many thanks to<br />
Jianyan Wei. The <strong>BATC</strong> Survey is supported by the Chinese<br />
Academy of Sciences (CAS), the Chinese Nation<strong>al</strong> Natur<strong>al</strong><br />
Science Foundation (CNNSF), and the Chinese State Committee<br />
of Sciences and Technology (CSCST). We <strong>al</strong>so thank<br />
the Chinese Nation<strong>al</strong> Pandeng Project for financi<strong>al</strong> support.<br />
The project was <strong>al</strong>so supported in part by the US Nation<strong>al</strong><br />
Science Foundation (NSF grant INT-93-01805), by Arizona<br />
State University, the University of Arizona, and<br />
Western Connecticut State University.<br />
Bertin, E., & Arnouts, S. 1996, A&AS, 117, 393<br />
Blitz, L., & Spergel, D. 1991, ApJ, 379, 631<br />
Burstein, D. 1979, ApJ, 234, 829<br />
de Grijs, R., & van der Kruit, P. C. 1996, A&AS, 117, 19<br />
de Vaucouleurs, G., de Vaucouleurs, A., Corwin, H. C. G., Jr., Buta, R. J.,<br />
Paturel, G., & Fouqué, P. 1991, Third Reference Cat<strong>al</strong>ogue of Bright<br />
G<strong>al</strong>axies (New York: Springer)<br />
D<strong>et</strong>tmar, R. J., & Wielebinski, R. 1986, A&A, 167, L21<br />
Fan, X.-H., <strong>et</strong> <strong>al</strong>. 1996, AJ, 112, 628<br />
Freedman, W. L., <strong>et</strong> <strong>al</strong>. 2001, ApJ, 553, 47<br />
Fry, A. M., Morrison, H. L., Harding, P., & Boroson, T. A. 1999, AJ, 118,<br />
1209<br />
Hamabe, M. 1982, PASJ, 34, 423<br />
Hamabe, M., Kodaira, K., Okamura, S., & Takase, B. 1980, PASJ, 32,<br />
197<br />
Ho, L. C., <strong>et</strong> <strong>al</strong>. 1997, ApJS, 112, 391<br />
Jensen, E. B., & Thuan, T. X. 1982, ApJS, 50, 421 (JT)<br />
Kissler-Patig, M., Ashman, K. M., Zept, S. E., & Freeman, K. C. 1999, AJ,<br />
118, 197<br />
Kormendy, J., & Bruzu<strong>al</strong>, A. G. 1978, ApJ, 223, L63<br />
Liu, Y. 2001, B.S. thesis, Nanjing Univ.<br />
Morrison, H. L., Boroson, T. A., & Harding, P. 1994, AJ, 108, 1191<br />
Näslund, M., & Jörsäter, S. 1997, A&A, 325, 915 (NJ)<br />
Odewahn, S. C., Windhorst, R. A., Driver, S. P., & Keel, W. C. 1996, ApJ,<br />
472, L13<br />
REFERENCES<br />
Oke, J. B., & Gunn, J. E. 1983, ApJ, 266, 713<br />
Press, W. H., <strong>et</strong> <strong>al</strong>. 1992, Numeric<strong>al</strong> Recipes in Fortran (2d ed.; Cambridge:<br />
Cambridge Univ. Press)<br />
Pritch<strong>et</strong>, C. J., & van den Bergh, S. 1994, AJ, 107, 1730<br />
Rice, W. 1996, AJ, 112, 114 (R96)<br />
Sack<strong>et</strong>t, P. D., Morrison, H. L., Harding, P., & Boroson, T. A. 1994,<br />
Nature, 370, 441<br />
Sancisi, R. 1976, A&A, 53, 159<br />
Shang, Z. H., <strong>et</strong> <strong>al</strong>. 1998, ApJ, 504, L23<br />
Shaw, M. A., & Gilmore, G. 1989, MNRAS, 237, 903 (SG)<br />
Spinrad, H., Ostriker, J. P., Stone, R. P. S., Chiu, L. T. G., & Bruzu<strong>al</strong>,<br />
A. G. 1978, ApJ, 225, 56<br />
Tonry, J., & Schneider, D. P. 1988, AJ, 96, 807<br />
van der Kruit, P. C. 1979, A&AS, 38, 15<br />
van der Kruit, P. C., & Searle, L. 1981, A&A, 95, 105 (KS)<br />
Wild, W. J. 1997, PASP, 109, 1269<br />
Willick, J. A., <strong>et</strong> <strong>al</strong>. 1996, ApJ, 457, 460<br />
Yan, H., <strong>et</strong> <strong>al</strong>. 2000, PASP, 112, 691<br />
<strong>Zhou</strong>, X., <strong>et</strong> <strong>al</strong>. 2001, Chinese J. Astron. Astrophys., 1, 372<br />
Zheng, Z. Y., <strong>et</strong> <strong>al</strong>. 1999, AJ, 117, 2757<br />
———. <strong>2002</strong>, in preparation<br />
Zinn, R. 1985, ApJ, 293, 424