Measurement of the Electrical Conductivity of zircon at High ...
Measurement of the Electrical Conductivity of zircon at High ...
Measurement of the Electrical Conductivity of zircon at High ...

Create successful ePaper yourself
Turn your PDF publications into a flip-book with our unique Google optimized e-Paper software.
Intern<strong>at</strong>ional Scientific Colloquium<br />
Modelling for Saving Resources<br />
Riga, May 17-18, 2001<br />
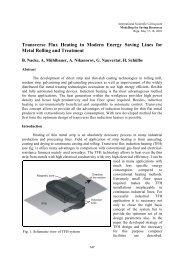
<strong>Measurement</strong> <strong>of</strong> <strong>the</strong> <strong>Electrical</strong> <strong>Conductivity</strong> <strong>of</strong> Zircon <strong>at</strong> <strong>High</strong><br />
Temper<strong>at</strong>ures<br />
A. Jakovics, M. Kirpo, Ā. Veispals, B. Nacke, E. Baake<br />
Abstract<br />
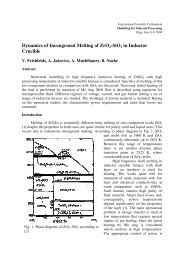
<strong>Measurement</strong>s <strong>of</strong> <strong>the</strong> electrical resistance <strong>of</strong> <strong>zircon</strong> ZrO 2 +SiO 2 <strong>at</strong> <strong>the</strong> temper<strong>at</strong>ure<br />
interval from 1100 to 2500 o C were made in <strong>the</strong> wolfram crucible placed in argon <strong>at</strong>mosphere.<br />
<strong>Electrical</strong> conductivity <strong>of</strong> <strong>zircon</strong> was estim<strong>at</strong>ed solving parameter identific<strong>at</strong>ion problem for<br />
crucible-m<strong>at</strong>erial-electrode system. Changes <strong>of</strong> activ<strong>at</strong>ion energy are estim<strong>at</strong>ed in <strong>the</strong> phase<br />
transition area <strong>of</strong> <strong>the</strong> sample. Results <strong>of</strong> calcul<strong>at</strong>ions are compared with liter<strong>at</strong>ure d<strong>at</strong>a.<br />
Introduction<br />
Cheap technologies for melting <strong>of</strong><br />
ceramics, oxides and glasses, th<strong>at</strong> ensure certain<br />
m<strong>at</strong>erial quality and properties, must be<br />
developed for <strong>the</strong> mass-production <strong>of</strong> <strong>the</strong>se high<br />
temper<strong>at</strong>ure melting m<strong>at</strong>erials. Induction melting<br />
in <strong>the</strong> cold crucible is a technology th<strong>at</strong> is<br />
perspective for melting <strong>of</strong> oxides because <strong>the</strong><br />
crucible m<strong>at</strong>erial does not pollute <strong>the</strong> melt like<br />
using conventional methods, e.g. ceramic<br />
crucibles. D<strong>at</strong>a about <strong>the</strong> electrical conductivity<br />
σ <strong>of</strong> <strong>the</strong> oxides <strong>at</strong> high temper<strong>at</strong>ures (even<br />
higher than <strong>the</strong> melting temper<strong>at</strong>ure <strong>of</strong> m<strong>at</strong>erial)<br />
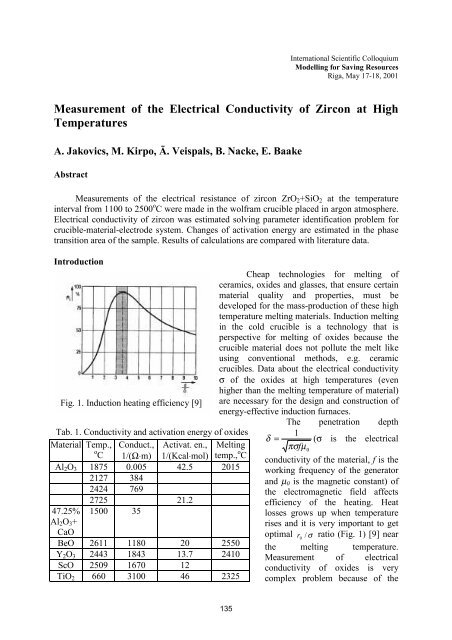
Fig. 1. Induction he<strong>at</strong>ing efficiency [9] are necessary for <strong>the</strong> design and construction <strong>of</strong><br />
energy-effective induction furnaces.<br />
The penetr<strong>at</strong>ion depth<br />
Tab. 1. <strong>Conductivity</strong> and activ<strong>at</strong>ion energy <strong>of</strong> oxides<br />
1<br />
M<strong>at</strong>erial Temp.,<br />
o C<br />
Conduct.,<br />
1/(Ω⋅m)<br />
Activ<strong>at</strong>. en.,<br />
1/(Kcal⋅mol)<br />
Al 2 O 3 1875 0.005 42.5 2015<br />
2127 384<br />
2424 769<br />
2725 21.2<br />
47.25%<br />
Al 2 O 3 +<br />
CaO<br />
1500 35<br />
Melting<br />
temp., o C<br />
BeO 2611 1180 20 2550<br />
Y 2 O 3 2443 1843 13.7 2410<br />
ScO 2509 1670 12<br />
TiO 2 660 3100 46 2325<br />
δ = (σ is <strong>the</strong> electrical<br />
πσ fµ<br />
0<br />
conductivity <strong>of</strong> <strong>the</strong> m<strong>at</strong>erial, f is <strong>the</strong><br />
working frequency <strong>of</strong> <strong>the</strong> gener<strong>at</strong>or<br />
and µ 0 is <strong>the</strong> magnetic constant) <strong>of</strong><br />
<strong>the</strong> electromagnetic field affects<br />
efficiency <strong>of</strong> <strong>the</strong> he<strong>at</strong>ing. He<strong>at</strong><br />
losses grows up when temper<strong>at</strong>ure<br />
rises and it is very important to get<br />
optimal r<br />
0<br />
/ σ r<strong>at</strong>io (Fig. 1) [9] near<br />
<strong>the</strong> melting temper<strong>at</strong>ure.<br />
<strong>Measurement</strong> <strong>of</strong> electrical<br />
conductivity <strong>of</strong> oxides is very<br />
complex problem because <strong>of</strong> <strong>the</strong><br />
135
high melting temper<strong>at</strong>ure (Tab.1) and <strong>the</strong>refore high chemical activity <strong>of</strong> <strong>the</strong> oxides.<br />
Very <strong>of</strong>ten such physical properties as electrical or <strong>the</strong>rmal conductivity are known only<br />
near <strong>the</strong> normal conditions. D<strong>at</strong>a about electrical properties <strong>at</strong> high temper<strong>at</strong>ures from<br />
reference books very <strong>of</strong>ten are ra<strong>the</strong>r old or contradictory. There are <strong>the</strong>ories describing how<br />
<strong>the</strong>se properties change when physical conditions are varied, but <strong>the</strong>ir results sometimes are<br />
unstable. It is very difficult to verify existing d<strong>at</strong>a under extreme conditions and to get new<br />
experimental d<strong>at</strong>a for fur<strong>the</strong>r calcul<strong>at</strong>ions. Aims <strong>of</strong> this work were:<br />
1. Check <strong>of</strong> <strong>the</strong> ability to make qualit<strong>at</strong>ive measurements <strong>of</strong> <strong>the</strong> electrical resistance <strong>of</strong><br />
<strong>zircon</strong> using an existing equipment <strong>at</strong> high temper<strong>at</strong>ures (above 2400 0 C) ;<br />
2. Calcul<strong>at</strong>ion <strong>of</strong> <strong>the</strong> electrical conductivity <strong>of</strong> <strong>zircon</strong> in order to get <strong>the</strong> temper<strong>at</strong>ure<br />
dependence;<br />
3. Carrying out values <strong>of</strong> activ<strong>at</strong>ion energy <strong>of</strong> <strong>the</strong> sample;<br />
4. Comparison <strong>of</strong> <strong>the</strong> results with liter<strong>at</strong>ure d<strong>at</strong>a.<br />
1. Equipment<br />
1.1. Characteristics <strong>of</strong> Zircon<br />
Zircon ZrSiO 4 (Zr 51% and Si 14.5% <strong>of</strong> weight [6]) was chosen as m<strong>at</strong>erial for our<br />
experiments. Powder <strong>of</strong> <strong>zircon</strong>ium oxide ZrO 2 and powder <strong>of</strong> silicon oxide (SiO 2 ) were used<br />
as primary m<strong>at</strong>erials. Zirconium oxide has a melting temper<strong>at</strong>ure about 2700°C, but when it is<br />
Tab. 2. Interaction temper<strong>at</strong>ures (K) <strong>of</strong> <strong>the</strong> selected high<br />
temper<strong>at</strong>ure m<strong>at</strong>erials [2].<br />
C W Mo ThO 2 ZrO 2 MgO BeO<br />
BeO 2300 2000 1900 2100 1900 1800 ---<br />
MgO 1800 2000 1600 2200 2000 --- 1800<br />
ZrO 2 1600 1600 2200 2200 --- 2000 1900<br />
ThO 2 2000 2200 1900 --- 2200 2200 2100<br />
mixed with silicon oxide, <strong>the</strong><br />
melting temper<strong>at</strong>ure is lower.<br />
Zirconium oxide is<br />
stable in oxidized and<br />
moder<strong>at</strong>e reduction<br />
<strong>at</strong>mospheres in contact with<br />
many metals and o<strong>the</strong>r<br />
oxides. When it is he<strong>at</strong>ed up<br />
to temper<strong>at</strong>ures above<br />
1000°C it has destructive expansion <strong>of</strong> volume [2].<br />
The sample was made by pressing <strong>the</strong> powders toge<strong>the</strong>r. The volume <strong>of</strong> <strong>the</strong> crucible<br />
was complete filled with <strong>the</strong> powder, but during <strong>the</strong> experiment <strong>the</strong> height <strong>of</strong> <strong>the</strong> sample<br />
becomes lower because <strong>of</strong> sintering and vaporiz<strong>at</strong>ion <strong>of</strong> m<strong>at</strong>erials. Zircon can be taken out<br />
from <strong>the</strong> crucible if it was not liquid during <strong>the</strong> he<strong>at</strong>ing process, but if it is he<strong>at</strong>ed above <strong>the</strong><br />
melting temper<strong>at</strong>ure it sticks to <strong>the</strong> walls <strong>of</strong> <strong>the</strong> crucible and it could not be taken out without<br />
melting.<br />
According to <strong>the</strong> st<strong>at</strong>e diagram (Fig. 2) [6] <strong>the</strong> temper<strong>at</strong>ure <strong>of</strong> about 2400°C must be<br />
reached to get a liquid phase <strong>of</strong> <strong>zircon</strong>. But <strong>the</strong> melting temper<strong>at</strong>ure <strong>of</strong> silicon oxide is less<br />
and <strong>the</strong> pressure <strong>of</strong> vapours is about one <strong>at</strong>mosphere <strong>at</strong> 2200°C (temper<strong>at</strong>ure <strong>of</strong> vaporis<strong>at</strong>ion is<br />
1800°C). Because <strong>of</strong> this silicon intensively comes out and it changes <strong>the</strong> chemical<br />
composition <strong>of</strong> <strong>the</strong> sample so th<strong>at</strong> can influence <strong>the</strong> final measurements.<br />
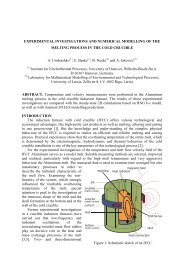
1.2. Experimental Equipment<br />
A crucible made <strong>of</strong> wolfram (W) which has a melting temper<strong>at</strong>ure 3410°C [2] was used<br />
for <strong>the</strong> melting process (Fig. 3). The height <strong>of</strong> <strong>the</strong> crucible was 80 mm, <strong>the</strong> diameter was 80<br />
mm and <strong>the</strong> inner diameter was 64 mm.<br />
136
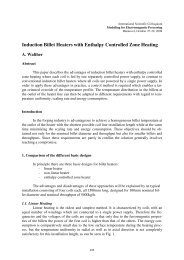
The crucible was covered by a wolfram cap and molybdenum bars. For he<strong>at</strong>ing <strong>the</strong><br />
sample a Chochralsky machinery was used. This device is a crucible induction furnace with<br />
vacuum chamber. The furnace supply<br />
gener<strong>at</strong>or works <strong>at</strong> 8 kHz frequency. The<br />
inductor (10 turns) is made <strong>of</strong> copper and<br />
w<strong>at</strong>er-cooled. The maximum voltage is<br />
about 100 V.<br />
The wolfram crucible with <strong>the</strong> sample<br />
was placed in <strong>the</strong> vacuum chamber. Isol<strong>at</strong>ion<br />
and <strong>the</strong> inductor are arranged around <strong>the</strong><br />
crucible. The first layer <strong>of</strong> isol<strong>at</strong>ion was<br />
realized by <strong>the</strong> powder <strong>of</strong> magnesia (MgO).<br />
The second layer was a quartz cylinder. In<br />
<strong>the</strong> third experiment only a graphite cylinder<br />
was used. To reduce chemical reactions<br />
between sample, crucible, isol<strong>at</strong>ion and<br />
electrodes all experiments took place in<br />
argon <strong>at</strong>mosphere.<br />
One electrode for <strong>the</strong> resistance<br />
measurements was <strong>at</strong>tached to <strong>the</strong> moving<br />
twig, th<strong>at</strong> is usually used for crystal holding,<br />
in <strong>the</strong> vacuum chamber. The second<br />
Fig. 2. St<strong>at</strong>e diagram <strong>of</strong> ZrSiO 4 [6]<br />
electrode was <strong>at</strong>tached to <strong>the</strong> bottom <strong>of</strong> <strong>the</strong><br />
crucible. Resistance measurements were<br />
Tungsten cover<br />
made using altern<strong>at</strong>ing current <strong>at</strong> 1 kHz<br />
frequency by voltmeter-ammeter method.<br />
Molybdenum bars<br />
The voltage on <strong>the</strong> sample and on <strong>the</strong><br />
precision resistor was controlled and finally<br />
<strong>the</strong> resistance value was calcul<strong>at</strong>ed using <strong>the</strong><br />
Ohm's law.<br />
We did not use pyrometer for<br />
temper<strong>at</strong>ure measurements because <strong>of</strong> <strong>the</strong><br />
problems as follow:<br />
1. The melting point <strong>of</strong> SiO 2 is about<br />
1800°C and if <strong>the</strong> temper<strong>at</strong>ure is higher <strong>the</strong>n<br />
Alloy<br />
<strong>the</strong> vaporis<strong>at</strong>ion <strong>of</strong> SiO 2 becomes very<br />
Crucible<br />
serious problem. The windows for <strong>the</strong><br />
Fig. 3. Scheme <strong>of</strong> <strong>the</strong> crucible<br />
temper<strong>at</strong>ure control was covered by some<br />
settlements after <strong>the</strong> experiment. So, it was<br />
Tab. 2. Characteristics <strong>of</strong> <strong>the</strong>rmocouples [2] not clear, how it changes characteristics <strong>of</strong><br />
Max. Ther. volt. Ther. volt.<br />
<strong>the</strong> pyrometer.<br />
working <strong>at</strong> 1000 o C, <strong>at</strong> 2000 o C, 2. The pyrometer measured <strong>the</strong><br />
temp., o C mV mV temper<strong>at</strong>ure <strong>of</strong> <strong>the</strong> crucible, not <strong>of</strong> <strong>the</strong> melt<br />
and we could not control probable errors<br />
W-Re 2200 15.9 28.0<br />
when interpol<strong>at</strong>ing values.<br />
W-Mo 2400 -0.8 5.30<br />
3. We had not mechanism to calibr<strong>at</strong>e<br />
W-Ir 2200 14.25 38.88 pyrometer <strong>at</strong> temper<strong>at</strong>ures higher than<br />
2000°C.<br />
Inductor<br />
Graphite cylinder<br />
W electrode<br />
Thermocouple<br />
137
Therefore two <strong>the</strong>rmocouples were used for<br />
temper<strong>at</strong>ure measuring. They were placed in <strong>the</strong> hot zone<br />
without any <strong>the</strong>rmal protection. The first was W-Re and<br />
ano<strong>the</strong>r one was W-Mo (Tab. 2).<br />
Characteristic <strong>of</strong> W-Re <strong>the</strong>rmocouple shows th<strong>at</strong> <strong>the</strong><br />
measuring interval is up to 2400°C, but working without<br />
<strong>the</strong>rmocouple protection in <strong>the</strong> hot zone limited this range<br />
down to 2000°C. W-Mo <strong>the</strong>rmocouple was controlled<br />
using W-Re <strong>the</strong>rmocouple and vice-versa.<br />
The o<strong>the</strong>r electrode placed in <strong>the</strong> crucible was made<br />
<strong>of</strong> iridium wire. It was intended to indic<strong>at</strong>e about <strong>the</strong><br />
temper<strong>at</strong>ure <strong>of</strong> melting point <strong>of</strong> iridium (2447°C). It was<br />
connected to a tester which indic<strong>at</strong>ed <strong>the</strong> resistance <strong>of</strong> this<br />
wire.<br />
2. Ma<strong>the</strong>m<strong>at</strong>ical Model and Calcul<strong>at</strong>ions<br />
There is a problem to calcul<strong>at</strong>e electrical conductivity<br />
after <strong>the</strong> experimental d<strong>at</strong>a measured. This problem usually<br />
is called problem <strong>of</strong> parameter identific<strong>at</strong>ion. In our case<br />
electrical conductivity depends on <strong>the</strong> measured resistance,<br />
on <strong>the</strong> distance<br />
25<br />
between <strong>the</strong> electrode<br />
and <strong>the</strong> crucible and<br />
on <strong>the</strong> height <strong>of</strong> <strong>the</strong><br />
20<br />
m<strong>at</strong>erial in <strong>the</strong><br />
crucible:<br />
15<br />
σ = σ ( R,<br />
h,<br />
hsample<br />
) .<br />
10<br />
Last two<br />
parameters can<br />
change during <strong>the</strong><br />
experiment and are<br />
known not so<br />
precisely. So <strong>the</strong><br />
model must give<br />
opportunity to vary<br />
all <strong>the</strong>se parameters<br />
and get <strong>the</strong><br />
R, Ohm<br />
conductivity σ as a function <strong>of</strong> <strong>the</strong> measured resistance. For example, height <strong>of</strong> <strong>the</strong> sample<br />
changes because <strong>of</strong> sintering and vaporis<strong>at</strong>ion. These parameters are determin<strong>at</strong>ive for <strong>the</strong><br />
error <strong>of</strong> <strong>the</strong> calcul<strong>at</strong>ions.<br />
Ma<strong>the</strong>m<strong>at</strong>ical model based on <strong>the</strong> field equ<strong>at</strong>ions was made for <strong>the</strong> conductivity<br />
calcul<strong>at</strong>ions. A model consists <strong>of</strong> three regions: wolfram electrode, <strong>zircon</strong> sample and<br />
wolfram crucible. Each region has its own electrical conductivity. Potential equ<strong>at</strong>ion for each<br />
region is expressed as (in <strong>the</strong> case <strong>of</strong> st<strong>at</strong>ionary current):<br />
2 2<br />
1 ∂ ⎛ ∂ϕ<br />
⎞ 1 ∂ ϕ ∂ ϕ<br />
⎜r<br />
⎟ + +<br />
2 2<br />
r ∂r<br />
⎝ ∂r<br />
⎠ r ∂ϕ<br />
∂ z<br />
There are additional conditions:<br />
5<br />
0<br />
2<br />
=<br />
0<br />
Fig. 4. <strong>Electrical</strong> potential<br />
distribution in <strong>the</strong> sample<br />
calcul<strong>at</strong>ed by ANSYS<br />
0 2 4 6 8 10 12 14 16 18 20<br />
h, mm<br />
Fig. 5. Dependence <strong>of</strong> measured resistance on <strong>the</strong> distance from <strong>the</strong><br />
bottom <strong>of</strong> <strong>the</strong> crucible<br />
(1)<br />
138
1. The electric-potential is equal on <strong>the</strong> inner border between <strong>the</strong> regions;<br />
2. There is a constant potential difference between <strong>the</strong> top <strong>of</strong> <strong>the</strong> electrode and <strong>the</strong> bottom<br />
<strong>of</strong> <strong>the</strong> crucible;<br />
3. The condition th<strong>at</strong> <strong>the</strong> current does not flow through <strong>the</strong> walls is expressed by equ<strong>at</strong>ion:<br />
grad nϕ = 0<br />
(2)<br />
Sample and<br />
crucible with<br />
electrode were<br />
divided into<br />
elements (mashed)<br />
and for each<br />
element values <strong>of</strong><br />
electrical field,<br />
potential and<br />
current were<br />
calcul<strong>at</strong>ed (Fig. 4).<br />
The voltage <strong>at</strong> <strong>the</strong><br />
sample is known<br />
and this gives <strong>the</strong><br />
opportunity to<br />
-5.5<br />
calcul<strong>at</strong>e <strong>the</strong><br />
Fig. 6. Dependence <strong>of</strong> ln(1/R) on <strong>the</strong> temper<strong>at</strong>ure<br />
resistance <strong>of</strong> <strong>the</strong><br />
sample using <strong>the</strong> Ohm’s law.<br />
This model helps to determine how <strong>the</strong> electrical conductivity depends on such<br />
parameters as measured resistance, distance between <strong>the</strong> electrode and <strong>the</strong> bottom <strong>of</strong> <strong>the</strong><br />
crucible (Fig. 5) and <strong>the</strong> height <strong>of</strong> <strong>the</strong> m<strong>at</strong>erial in <strong>the</strong> crucible. Two parameters can be set<br />
constant and <strong>the</strong>n <strong>the</strong> electrical conductivity dependence on <strong>the</strong> third parameter can be<br />
calcul<strong>at</strong>ed. While changing <strong>the</strong> electrical properties <strong>of</strong> <strong>the</strong> m<strong>at</strong>erial (<strong>zircon</strong> area) we get <strong>the</strong><br />
dependence <strong>of</strong> <strong>the</strong> electrical conductivity on <strong>the</strong> measured resistance. The model illustr<strong>at</strong>es<br />
th<strong>at</strong> σ = const / R . This is in accordance with <strong>the</strong>ory and const = 28.8 (Ω∗m) -1 in our case.<br />
The value <strong>of</strong> measured resistance has limit <strong>of</strong> about 0.1 Ω) where this model can not be<br />
used because <strong>of</strong> large indetermin<strong>at</strong>ions.<br />
3. Results<br />
-1.5<br />
0.00055 0.0006 0.00065 0.0007 0.00075 0.0008 1/T, 1/K 0.000<br />
-2<br />
-2.5<br />
-3<br />
-3.5<br />
-4<br />
-4.5<br />
-5<br />
ln(1/R), ln(1/Ohm)<br />
Experimental d<strong>at</strong>a are shown on <strong>the</strong> chart (Fig. 6) and <strong>the</strong> melted sample is shown on<br />
picture (Fig. 7).<br />
The dependence <strong>of</strong> <strong>the</strong> electric conductivity on <strong>the</strong> temper<strong>at</strong>ure can be approxim<strong>at</strong>ely<br />
expressed as :<br />
− E a<br />
kT<br />
σ = A ⋅ e<br />
where A is a constant, E a is <strong>the</strong> activ<strong>at</strong>ion energy, k is <strong>the</strong> Boltzmann constant. So <strong>the</strong><br />
logarithm <strong>of</strong> <strong>the</strong> electric conductivity is proportional to 1/T. There are two linear regions on<br />
<strong>the</strong> chart, th<strong>at</strong> shows this dependence (Fig. 6), and cross point temper<strong>at</strong>ure between <strong>the</strong>se<br />
regions approxim<strong>at</strong>ely is equal to phase transition temper<strong>at</strong>ure. On <strong>the</strong> system st<strong>at</strong>e diagram<br />
(Fig. 2) is shown th<strong>at</strong> SiO 2 has <strong>the</strong> phase transition <strong>at</strong> 1750°C, which can influence <strong>the</strong> values<br />
<strong>of</strong> <strong>the</strong> resistance.<br />
(3)<br />
139
The value <strong>of</strong> <strong>the</strong> electrical conductivity <strong>at</strong> 2500°C estim<strong>at</strong>ed with <strong>the</strong> ANSYS<br />
modelling, is σ = 70 1/(Ω⋅m).<br />
For <strong>the</strong> calcul<strong>at</strong>ion we used <strong>the</strong> following d<strong>at</strong>a:<br />
resistance <strong>of</strong> <strong>the</strong> sample was 0.4 Ω, distance between<br />
electrode and <strong>the</strong> bottom <strong>of</strong> <strong>the</strong> crucible was 10 mm<br />
and <strong>the</strong> level <strong>of</strong> <strong>the</strong> m<strong>at</strong>erial in <strong>the</strong> crucible was 15<br />
mm. A second value which resulted from <strong>the</strong><br />
analytical calcul<strong>at</strong>ions is σ = 65 1/(Ω⋅m).<br />
Fig. 7. Our samples after different<br />
experiments.<br />
accordance with d<strong>at</strong>a from o<strong>the</strong>r sources.<br />
Conclusions<br />
1. It was shown th<strong>at</strong> such experiments can be<br />
made using standard experimental and measuring<br />
equipment.<br />
2. The experiment carried out th<strong>at</strong> <strong>the</strong> electrical<br />
conductivity depends on <strong>the</strong> temper<strong>at</strong>ure as<br />
k T<br />
~ e − E a<br />
σ .<br />
Tab. 3. Values <strong>of</strong> activ<strong>at</strong>ion energy<br />
Temper<strong>at</strong>ure,<br />
o C<br />
Activ<strong>at</strong>ion<br />
energy E a ,<br />
kcal/mol<br />
Activ<strong>at</strong>ion<br />
energy E a ,<br />
eV<br />
1100÷1700 5.5±0.6 0.24±0.03<br />
1700÷2400 52±5 2.2±0.2<br />
3. The dependence <strong>of</strong> <strong>the</strong> electrical conductivity<br />
<strong>of</strong> <strong>zircon</strong> (ZrSiO 4 ) on <strong>the</strong> temper<strong>at</strong>ure was carried<br />
out. The conductivity <strong>at</strong> a temper<strong>at</strong>ure <strong>of</strong> 2500°C<br />
was determined as σ = 70 1/(Ω⋅m). This value is in<br />
4. Values <strong>of</strong> <strong>the</strong> activ<strong>at</strong>ion energy were determined for two temper<strong>at</strong>ure intervals<br />
(different phase st<strong>at</strong>es (Tab. 3)).<br />
5. The experimental equipment and <strong>the</strong> ma<strong>the</strong>m<strong>at</strong>ical model can be used to analyse<br />
systems like this and to calcul<strong>at</strong>e <strong>the</strong> influence <strong>of</strong> different factors on <strong>the</strong> measurements.<br />
References<br />
[1] В. Д. Кинжери. Измерения при высоких температурах. Москва, 1963.<br />
[2] И. Э. Кэммбелл. Техника высоких температур. Издательство иностранной литературы, Москва,<br />
1959.<br />
[3] М. А. Маурах, Б. С. Митин. Жидкие тугоплавкие окислы. Металлургия, 1979.<br />
[4] А. С. Болгар, Ц. П. Гардиенко и др. Комплексное исследование теплофизических свойств твёрдых<br />
веществ. Теплофизические свойства твёрдых веществ, Наука, Москва, 1973.<br />
[5] А. Н. Кисель, В. П. Матвеева, В. Е. Финкельштейн. Специальные оптические пирометры для<br />
точных измерений высокой температуры веществ в конденсированной фазе при теплофизических<br />
исследованиях. Теплофизические свойства твёрдых веществ, Наука, Москва, 1973.<br />
[6] Н. А. Торопов, В. П. Барзаковский и др. Диаграммы состояния силикатных систем. Справочник.<br />
Наука, Москва-Ленинград, 1965.<br />
[7] С. Ф. Пальгуев, А. Д. Неуймин и др. Електропроводность высокоогнеупорных окислов при высокмх<br />
температурах. Силикаты и окислы в химии высоких температур. Москва, 1963.<br />
[8] The Intern<strong>at</strong>ional Temper<strong>at</strong>ure Scale <strong>of</strong> 1990. H. Preston-Thomas, www.omega.com<br />
140
[9] Jorg Fasholz. Induktive Erwärmung. 1978<br />
[10] Dictionary <strong>of</strong> Physics. Edited by Valerie Illingworth, Penguin Books,1990.<br />
Authors<br />
Dr.-Phys. Jakovičs, Andris<br />
Bach. Phys. Kirpo, Maksims<br />
Dipl.-Phys. Veispals, Āris<br />
Faculty <strong>of</strong> Physics and Ma<strong>the</strong>m<strong>at</strong>ics<br />
University <strong>of</strong> L<strong>at</strong>via<br />
Zeļļu str. 8,<br />
LV-1002 Rīga, L<strong>at</strong>vija<br />
Pr<strong>of</strong>. Dr.-Ing. Nacke, Bernard<br />
Dr.-Ing. Baake, Egbert<br />
Institute for Electro<strong>the</strong>rmal Processes<br />
University <strong>of</strong> Hanover<br />
Wilhelm-Busch-Str. 4<br />
D-30167 Hannover, Germany<br />
141