Long-Term Care Utilization - Ontario Long Term Care Association
Long-Term Care Utilization - Ontario Long Term Care Association
Long-Term Care Utilization - Ontario Long Term Care Association

You also want an ePaper? Increase the reach of your titles
YUMPU automatically turns print PDFs into web optimized ePapers that Google loves.
<strong>Long</strong>-<strong>Term</strong> <strong>Care</strong> Planning & Renewal Branch<br />
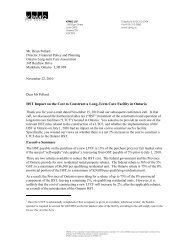
<strong>Long</strong>-<strong>Term</strong> <strong>Care</strong><br />
<strong>Utilization</strong><br />
PAC Reporting Package<br />
as of December 31, 2006<br />
Prepared By:<br />
Information Services Group<br />
Planning & Strategy - LTCPR<br />
777 Bay Street, 7 th Floor<br />
Toronto, ON<br />
M5G 2E5<br />
January 23, 2007<br />
These reports are confidential and not for distribution
These reports are confidential and not for distribution<br />
<strong>Long</strong>-<strong>Term</strong> <strong>Care</strong> Planning & Renewal Branch<br />
December 2006<br />
PAC Reporting Package<br />
Index<br />
<strong>Utilization</strong> Management Reports .......................................................................3<br />
<strong>Utilization</strong> – Normal and Adjusted Month over Month ....................................4<br />
<strong>Utilization</strong> (Adjusted) - By Type and Class.....................................................5<br />
Current Month Eligible Waitlist Demand & Supply by Type ...........................6<br />
Current Month Eligible Waitlist Demand & Supply by Class ..........................9<br />
Rolling Supply Projections by Classifications...............................................12<br />
Rolling Supply Projections by Type .............................................................15<br />
<strong>Utilization</strong> Management Charts........................................................................18<br />
Current Demand vs. Current and Projected Supply by Region....................19<br />
Current Demand vs. Current and Projected Supply by CCAC - Top 10.......20<br />
Current Demand vs. Current and Projected Supply by CCAC - Bottom 10 .21<br />
CCAC New Bed Fill Period Overlap.............................................................22<br />
Report Summaries............................................................................................23<br />
Chart Summaries ..............................................................................................25<br />
Data Collection..................................................................................................27<br />
Definitions .........................................................................................................28<br />
Additional Information......................................................................................34<br />
<strong>Long</strong>-<strong>Term</strong> <strong>Care</strong> Planning & Renewal Branch<br />
<strong>Utilization</strong> Management Report Package –December, 2006<br />
2
These reports are confidential and not for distribution<br />
<strong>Utilization</strong> Management Reports<br />
1. <strong>Utilization</strong> – Normal and Adjusted Month over Month<br />
2. <strong>Utilization</strong> (Adjusted) - By Type and Class<br />
3. Current Month Eligible Waitlist Demand & Supply by Type<br />
4. Current Month Eligible Waitlist Demand & Supply by Class<br />
5. Rolling Supply Projections by Bed Classification<br />
6. Rolling Supply Projections by Type<br />
<strong>Long</strong>-<strong>Term</strong> <strong>Care</strong> Planning & Renewal Branch<br />
<strong>Utilization</strong> Management Report Package –December, 2006<br />
3
<strong>Long</strong>-<strong>Term</strong> <strong>Care</strong> Planning & Renewal Branch<br />
<strong>Utilization</strong> - Normal and Adjusted Month-Over-Month*<br />
31-Dec-2006<br />
November 2006 December 2006<br />
Change<br />
Fill Rate<br />
Fill Rate<br />
Fill Rate<br />
REGION<br />
CCAC<br />
<strong>Utilization</strong><br />
%<br />
Adjusted<br />
<strong>Utilization</strong><br />
<strong>Utilization</strong><br />
%<br />
Adjusted<br />
<strong>Utilization</strong><br />
<strong>Utilization</strong><br />
%<br />
Adjusted<br />
<strong>Utilization</strong><br />
%<br />
%<br />
%<br />
Central-East Durham 99.5 99.5 99.3 99.3 -0.2 -0.2<br />
Haliburton-Northumberland-Victoria 99.4 99.4 98.9 98.9 -0.5 -0.5<br />
Peterborough 99.4 99.4 99.1 99.1 -0.3 -0.3<br />
Simcoe County 99.1 99.1 99.1 99.1 0.0<br />
0.0<br />
York Region 96.9 98.8 98.5 99.0 1.6<br />
0.2<br />
Region Total<br />
98.6 99.2 98.9 99.1 0.3<br />
-0.1<br />
Central-South Brant 99.5 99.5 98.9 98.9 -0.6 -0.6<br />
Haldimand-Norfolk 99.4 99.4 98.3 98.3 -1.1 -1.1<br />
Hamilton 98.8 98.8 98.6 98.6 -0.2 -0.2<br />
Niagara 99.0 99.0 98.6 98.6 -0.4 -0.4<br />
Region Total<br />
99.0 99.0 98.6 98.6 -0.4<br />
-0.4<br />
Central-Toronto East York 99.7 99.7 99.7 99.7 0.0<br />
0.0<br />
Etobicoke-York 96.3 96.3 96.3 96.3 0.0<br />
0.0<br />
North York 94.9 94.9 94.5 94.5 -0.4 -0.4<br />
Scarborough 98.0 98.0 98.1 98.1 0.1<br />
0.1<br />
Toronto 97.7 97.7 98.9 98.9 1.2<br />
1.2<br />
Region Total<br />
97.0 97.0 97.2 97.2 0.2<br />
0.2<br />
Central-West Halton 99.0 99.0 98.5 98.5 -0.5 -0.5<br />
Peel 97.7 97.7 98.4 98.4 0.7<br />
0.7<br />
Waterloo 99.2 99.2 99.6 99.6 0.4<br />
0.4<br />
Wellington-Dufferin 98.1 98.1 97.6 97.6 -0.5 -0.5<br />
Region Total<br />
98.4 98.4 98.6 98.6 0.2<br />
0.2<br />
East Eastern Counties 97.7 97.7 98.2 98.2 0.5<br />
0.5<br />
Hastings-Prince Edward Counties 99.8 99.8 99.5 99.5 -0.3 -0.3<br />
Kingston-Frontenac-Lennox-Addington 97.0 97.0 97.9 97.9 0.9<br />
0.9<br />
Lanark-Leeds-Grenville 99.4 99.4 98.8 98.8 -0.6 -0.6<br />
Ottawa 99.6 99.6 99.5 99.5 -0.1 -0.1<br />
Renfrew County 99.6 99.6 99.0 99.0 -0.6 -0.6<br />
Region Total<br />
99.0 99.0 99.0 99.0 0.0<br />
0.0<br />
North Algoma 98.5 98.5 98.6 98.6 0.1<br />
0.1<br />
Cochrane 99.7 99.7 99.1 99.1 -0.6 -0.6<br />
Kenora-Rainy River 96.8 96.8 98.4 98.4 1.6<br />
1.6<br />
Manitoulin-Sudbury 99.2 99.2 98.6 98.6 -0.6 -0.6<br />
Muskoka East Parry Sound 98.6 98.6 99.2 99.2 0.6<br />
0.6<br />
Near North 99.6 99.6 99.6 99.6 0.0<br />
0.0<br />
Thunder Bay 99.1 99.1 98.0 98.0 -1.1 -1.1<br />
Timiskaming 100.0 100.0 99.5 99.5 -0.5 -0.5<br />
West Parry Sound 97.1 97.1 97.1 97.1 0.0<br />
0.0<br />
Region Total<br />
98.9 98.9 98.7 98.7 -0.2<br />
-0.2<br />
South-West Chatham-Kent 97.7 97.7 97.9 97.9 0.2<br />
0.2<br />
Elgin 98.7 98.7 98.7 98.7 0.0<br />
0.0<br />
Grey-Bruce 99.5 99.5 98.8 98.8 -0.7 -0.7<br />
Huron 99.2 99.2 96.3 96.3 -2.9 -2.9<br />
London-Middlesex 99.1 99.1 98.7 98.7 -0.4 -0.4<br />
Oxford 99.9 99.9 99.4 99.4 -0.5 -0.5<br />
Perth County 99.4 99.4 98.9 98.9 -0.5 -0.5<br />
Sarnia-Lambton 99.8 99.8 99.7 99.7 -0.1 -0.1<br />
Windsor-Essex 97.8 97.8 97.3 97.3 -0.5 -0.5<br />
Region Total<br />
98.9 98.9 98.4 98.4 -0.5<br />
-0.5<br />
Provincial Total 98.4 98.5 98.4<br />
98.4 0.0<br />
-0.1<br />
*NOTE: Vacant Beds within fill period removed. Prepared by: Information<br />
Created: 1/23/2007, 9:53:18AM<br />
Services Group <strong>Utilization</strong> - Normal & Adjusted Month-Over-Month - 7 Page 1 of 1<br />
Confidential and not for distribution
REGION<br />
<strong>Long</strong>-<strong>Term</strong> <strong>Care</strong> Planning & Renewal Branch<br />
<strong>Utilization</strong> by Type and Class*<br />
31-Dec-2006<br />
CCAC<br />
Total<br />
Supply<br />
Total<br />
<strong>Utilization</strong><br />
%<br />
Central-East Durham 2,748 99.3 99.4 99.1 99.3 99.5 N/A N/A 99.2 N/A<br />
Basic<br />
%<br />
Semi-<br />
Private<br />
%<br />
Haliburton-Northumberland-Victoria 1,593 98.9 99.3 97.8 99.6 99.5 100.0 98.8 98.6 N/A<br />
Peterborough 1,109 99.1 99.6 99.6 99.2 99.4 100.0 98.4 99.7 N/A<br />
Simcoe County 2,577 99.1 99.2 97.5 99.6 99.9 98.4 99.0 98.1 99.4<br />
York Region 3,549 99.0 99.5 96.1 99.1 99.1 100.0 99.0 99.3 93.0<br />
Region Total 11,576 99.1 99.4 98.1 99.3 99.4 98.9 98.8 99.0 96.9<br />
Central-South Brant 883 98.9 99.7 98.2 98.3 98.5 N/A 99.0 99.1 N/A<br />
Haldimand-Norfolk 846 98.3 99.0 96.7 98.3 99.1 N/A 93.3 98.8 N/A<br />
Hamilton 3,887 98.6 98.1 97.6 99.4 99.4 99.4 100.0 97.3 87.4<br />
Niagara 3,534 98.6 99.2 97.5 98.2 98.8 98.5 97.9 98.4 N/A<br />
Region Total 9,150 98.6 98.8 97.6 98.8 99.1 99.0 98.2 98.2 87.4<br />
Central-Toronto East York 672 99.7 100.0 100.0 99.2 99.6 N/A N/A 100.0 100.0<br />
Etobicoke-York 2,979 96.3 96.8 93.0 98.1 99.5 100.0 97.8 92.3 N/A<br />
North York 3,188 94.5 93.9 93.4 96.9 97.5 97.9 98.8 90.3 N/A<br />
Scarborough 4,298 98.1 98.4 95.7 99.2 99.5 99.3 98.2 96.1 100.0<br />
Toronto 3,832 98.9 99.5 97.4 98.8 100.0 100.0 99.3 97.9 N/A<br />
Region Total 14,969 97.2 97.6 95.0 98.5 99.5 98.8 98.5 94.7 100.0<br />
Central-West Halton 2,381 98.5 98.9 95.6 98.7 98.9 99.0 99.5 94.3 N/A<br />
Peel 4,035 98.4 99.1 95.1 98.8 99.2 100.0 96.6 96.5 N/A<br />
Waterloo 2,559 99.6 99.6 99.2 99.7 99.7 100.0 99.7 99.4 N/A<br />
Wellington-Dufferin 1,440 97.6 98.9 93.2 99.0 99.5 N/A 100.0 95.3 N/A<br />
Region Total 10,415 98.6 99.1 95.5 99.1 99.3 99.7 99.1 96.8 N/A<br />
East Eastern Counties 1,576 98.2 99.2 95.9 97.8 100.0 99.6 99.0 97.6 98.0<br />
Hastings-Prince Edward Counties 1,291 99.5 99.5 99.8 99.0 99.8 97.9 100.0 99.8 96.2<br />
Kingston-Frontenac-Lennox-Addington 1,369 97.9 99.8 98.7 99.6 99.5 98.6 99.8 100.0 N/A<br />
Lanark-Leeds-Grenville 1,332 98.8 98.7 97.9 99.7 99.4 N/A 99.0 98.1 100.0<br />
Ottawa 4,624 99.5 99.8 97.6 99.7 99.9 99.6 97.9 99.1 100.0<br />
Renfrew County 812 99.0 99.7 98.7 98.2 99.1 98.5 100.0 98.2 N/A<br />
Region Total 11,004 99.0 99.5 98.1 99.3 99.7 99.3 99.4 98.7 98.5<br />
North Algoma 1,004 98.6 99.8 96.1 98.0 98.9 N/A 100.0 99.2 100.0<br />
Cochrane 655 99.1 99.7 99.0 98.6 99.3 97.0 99.6 98.9 N/A<br />
Kenora-Rainy River 556 98.4 97.2 98.0 100.0 100.0 100.0 N/A 97.7 N/A<br />
Manitoulin-Sudbury 1,544 98.6 98.4 97.4 99.8 98.9 94.9 100.0 98.6 N/A<br />
Muskoka East Parry Sound 712 99.2 99.7 90.9 100.0 99.8 N/A N/A 96.5 N/A<br />
Near North 770 99.6 99.4 100.0 100.0 N/A N/A 100.0 99.5 N/A<br />
Thunder Bay 1,165 98.0 98.6 96.2 99.7 98.4 99.3 99.1 96.7 98.0<br />
Timiskaming 364 99.5 98.8 100.0 100.0 100.0 N/A 97.5 100.0 N/A<br />
West Parry Sound 209 97.1 98.8 97.6 95.2 98.9 N/A N/A N/A N/A<br />
Region Total 6,979 98.7 99.0 97.5 99.4 99.1 98.2 99.4 98.6 98.5<br />
South-West Chatham-Kent 841 97.9 99.4 93.2 98.7 98.6 N/A N/A 97.2 N/A<br />
Elgin 668 98.7 100.0 96.4 96.9 98.2 100.0 N/A 98.7 N/A<br />
Grey-Bruce 1,314 98.8 99.4 98.5 98.2 98.6 97.1 100.0 98.8 N/A<br />
Huron 615 96.3 98.8 91.5 96.1 N/A 95.6 97.5 95.5 100.0<br />
London-Middlesex 2,611 98.7 98.7 97.7 99.1 99.3 99.4 98.1 98.1 N/A<br />
Oxford 783 99.4 99.5 98.6 100.0 100.0 N/A 100.0 98.7 100.0<br />
Perth County 699 98.9 99.2 97.0 100.0 N/A 100.0 98.3 98.7 97.3<br />
Sarnia-Lambton 1,038 99.7 99.8 99.5 99.7 99.4 100.0 100.0 100.0 N/A<br />
Windsor-Essex 2,287 97.3 96.9 97.7 97.5 99.2 98.5 100.0 93.9 99.7<br />
Region Total 10,856 98.4 98.8 97.2 98.6 99.1 98.6 99.0 97.6 99.5<br />
Provincial Total 74,949 98.4 98.8 96.8 99.0 99.3 99.0 98.9 97.3 98.2<br />
Private<br />
%<br />
New<br />
%<br />
A<br />
%<br />
B<br />
%<br />
C<br />
%<br />
D<br />
%<br />
*NOTE: Vacant Beds within fill period removed. Prepared by:<br />
Information Services Group Adjusted <strong>Utilization</strong> by Type & Class - 6<br />
Created: 1/23/2007, 9:53:16AM<br />
Confidential and not for distribution<br />
Page 1 of 1
<strong>Long</strong>-<strong>Term</strong> <strong>Care</strong> Planning & Renewal Branch<br />
Current Month Eligible Waitlist Demand & Supply by Type*<br />
31-Dec-2006<br />
WAITLIST DEMAND<br />
SUPPLY**<br />
UTILIZATION**<br />
REGION<br />
CCAC<br />
Eligible<br />
Clients<br />
Waitlist<br />
Waiting<br />
Acute<br />
<strong>Care</strong><br />
Basic<br />
Preferred<br />
Waitlist<br />
Attrition<br />
Vacancy<br />
Total<br />
Vacancy<br />
Basic<br />
Vacancy<br />
Preferred<br />
Total<br />
Beds<br />
Basic<br />
Beds<br />
Preferred<br />
Beds<br />
<strong>Utilization</strong><br />
Central-East<br />
Durham 760 79 44% 56%<br />
5%<br />
19<br />
8 11<br />
2,748<br />
1,340 1,408<br />
99.3%<br />
Haliburton-Northumberland-Victoria 286 32 60% 40%<br />
9%<br />
18<br />
5 10<br />
1,593<br />
707 875<br />
98.9%<br />
Peterborough 380 20 62% 38%<br />
7%<br />
10<br />
2 4<br />
1,109<br />
496 590<br />
99.1%<br />
Simcoe County 1,109 43 66% 34%<br />
3%<br />
24<br />
9 14<br />
2,577<br />
1,114 1,421<br />
99.1%<br />
York Region 912 53 64% 36%<br />
6%<br />
35<br />
8 27<br />
3,549<br />
1,598 1,951<br />
99.0%<br />
Regional Total 3,447 227 60% 40% 6%<br />
106 32 66 11,576 5,255 6,245<br />
99.1%<br />
Central-South<br />
Brant 85 37 58% 42%<br />
8%<br />
10<br />
1 9<br />
883<br />
368 515<br />
98.9%<br />
Haldimand-Norfolk 81 33 73% 27%<br />
16%<br />
14<br />
4 10<br />
846<br />
391 455<br />
98.3%<br />
Hamilton 717 119 59% 41%<br />
2%<br />
55<br />
34 21<br />
3,887<br />
1,831 2,056<br />
98.6%<br />
Niagara 1,150 165 44% 56%<br />
5%<br />
51<br />
12 39<br />
3,534<br />
1,570 1,923<br />
98.6%<br />
Regional Total 2,033 354 51% 49% 4%<br />
130 51 79 9,150 4,160 4,949<br />
98.6%<br />
Central-Toronto<br />
East York 60 11 67% 33%<br />
6%<br />
2<br />
0 2<br />
672<br />
332 340<br />
99.7%<br />
Etobicoke-York 364 59 49% 51%<br />
7%<br />
111<br />
46 65<br />
2,979<br />
1,421 1,558<br />
96.3%<br />
North York 775 54 71% 29%<br />
5%<br />
174<br />
88 86<br />
3,188<br />
1,452 1,736<br />
94.5%<br />
Scarborough 1,002 72 79% 21%<br />
5%<br />
83<br />
30 53<br />
4,298<br />
1,921 2,377<br />
98.1%<br />
Toronto 671 91 58% 42%<br />
5%<br />
44<br />
11 33<br />
3,832<br />
2,068 1,764<br />
98.9%<br />
Regional Total 2,872 287 68% 32% 5%<br />
414 175 239 14,969 7,194 7,775<br />
97.2%<br />
* These reports are confidential, not for distribution<br />
Prepared by LTCRP.ISG@moh.gov.on.ca<br />
Current Month Eligible Waitlist Demand & Supply by Type - 01<br />
**Fill Rate Adjusted<br />
Created: 1/23/2007, 9:53:07AM<br />
Page 1 of 3
<strong>Long</strong>-<strong>Term</strong> <strong>Care</strong> Planning & Renewal Branch<br />
Current Month Eligible Waitlist Demand & Supply by Type*<br />
31-Dec-2006<br />
WAITLIST DEMAND<br />
SUPPLY**<br />
UTILIZATION**<br />
REGION<br />
CCAC<br />
Eligible<br />
Clients<br />
Waitlist<br />
Waiting<br />
Acute<br />
<strong>Care</strong><br />
Basic<br />
Preferred<br />
Waitlist<br />
Attrition<br />
Vacancy<br />
Total<br />
Vacancy<br />
Basic<br />
Vacancy<br />
Preferred<br />
Total<br />
Beds<br />
Basic<br />
Beds<br />
Preferred<br />
Beds<br />
<strong>Utilization</strong><br />
Central-West<br />
Halton 343 29 50% 50%<br />
10%<br />
35<br />
13 22<br />
2,381<br />
1,146 1,235<br />
98.5%<br />
Peel 453 62 69% 31%<br />
9%<br />
66<br />
16 50<br />
4,035<br />
1,812 2,223<br />
98.4%<br />
Waterloo 697 28 51% 49%<br />
4%<br />
10<br />
5 5<br />
2,559<br />
1,168 1,391<br />
99.6%<br />
Wellington-Dufferin 397 13 38% 62%<br />
5%<br />
34<br />
8 26<br />
1,440<br />
707 733<br />
97.6%<br />
Regional Total 1,890 132 52% 48% 7%<br />
145 42 103 10,415 4,833 5,582<br />
98.6%<br />
East<br />
Eastern Counties 252 44 61% 39%<br />
8%<br />
29<br />
7 22<br />
1,576<br />
856 720<br />
98.2%<br />
Hastings-Prince Edward Counties 685 45 57% 43%<br />
3%<br />
6<br />
3 3<br />
1,291<br />
652 638<br />
99.5%<br />
Kingston-Frontenac-Lennox-Addington 455 19 74% 26%<br />
5%<br />
29<br />
1 6<br />
1,369<br />
573 752<br />
97.9%<br />
Lanark-Leeds-Grenville 473 41 46% 54%<br />
6%<br />
16<br />
8 8<br />
1,332<br />
638 682<br />
98.8%<br />
Ottawa 1,398 159 43% 57%<br />
4%<br />
24<br />
4 19<br />
4,624<br />
2,035 2,585<br />
99.5%<br />
Renfrew County 422 7 79% 21%<br />
4%<br />
8<br />
1 7<br />
812<br />
352 432<br />
99.0%<br />
Regional Total 3,685 315 55% 45% 4%<br />
112 24 65 11,004 5,106 5,809<br />
99.0%<br />
North<br />
Algoma 255 33 88% 12%<br />
7%<br />
14<br />
1 12<br />
1,004<br />
539 377<br />
98.6%<br />
Cochrane 202 40 63% 37%<br />
4%<br />
6<br />
1 4<br />
655<br />
288 346<br />
99.1%<br />
Kenora-Rainy River 279 21 90% 10%<br />
3%<br />
9<br />
6 2<br />
556<br />
212 334<br />
98.4%<br />
Manitoulin-Sudbury 327 54 62% 38%<br />
5%<br />
21<br />
12 9<br />
1,544<br />
734 738<br />
98.6%<br />
Muskoka East Parry Sound 190 18 74% 26%<br />
6%<br />
6<br />
1 5<br />
712<br />
350 350<br />
99.2%<br />
Near North 300 39 75% 25%<br />
3%<br />
3<br />
3 0<br />
770<br />
512 219<br />
99.6%<br />
Thunder Bay 231 15 60% 40%<br />
5%<br />
23<br />
8 11<br />
1,165<br />
552 547<br />
98.0%<br />
Timiskaming 131 5 72% 28%<br />
6%<br />
2<br />
2 0<br />
364<br />
172 192<br />
99.5%<br />
West Parry Sound 49 3 63% 37%<br />
7%<br />
6<br />
1 5<br />
209<br />
84 125<br />
97.1%<br />
Regional Total 1,964 228 73% 27% 5%<br />
90 35 48 6,979 3,443 3,228<br />
98.7%<br />
* These reports are confidential, not for distribution<br />
Prepared by LTCRP.ISG@moh.gov.on.ca<br />
Current Month Eligible Waitlist Demand & Supply by Type - 01<br />
**Fill Rate Adjusted<br />
Created: 1/23/2007, 9:53:07AM<br />
Page 2 of 3
<strong>Long</strong>-<strong>Term</strong> <strong>Care</strong> Planning & Renewal Branch<br />
Current Month Eligible Waitlist Demand & Supply by Type*<br />
31-Dec-2006<br />
WAITLIST DEMAND<br />
SUPPLY**<br />
UTILIZATION**<br />
REGION<br />
CCAC<br />
Eligible<br />
Clients<br />
Waitlist<br />
Waiting<br />
Acute<br />
<strong>Care</strong><br />
Basic<br />
Preferred<br />
Waitlist<br />
Attrition<br />
Vacancy<br />
Total<br />
Vacancy<br />
Basic<br />
Vacancy<br />
Preferred<br />
Total<br />
Beds<br />
Basic<br />
Beds<br />
Preferred<br />
Beds<br />
<strong>Utilization</strong><br />
South-West<br />
Chatham-Kent 71 20 79% 21%<br />
10%<br />
18<br />
2 16<br />
841<br />
362 479<br />
97.9%<br />
Elgin 99 8 57% 43%<br />
9%<br />
9<br />
0 9<br />
668<br />
404 264<br />
98.7%<br />
Grey-Bruce 131 22 59% 41%<br />
7%<br />
16<br />
4 11<br />
1,314<br />
636 674<br />
98.8%<br />
Huron 68 6 51% 49%<br />
10%<br />
23<br />
4 19<br />
615<br />
322 293<br />
96.3%<br />
London-Middlesex 990 84 49% 51%<br />
6%<br />
34<br />
14 20<br />
2,611<br />
1,104 1,485<br />
98.7%<br />
Oxford 218 2 52% 48%<br />
5%<br />
5<br />
2 3<br />
783<br />
399 380<br />
99.4%<br />
Perth County 218 4 23% 77%<br />
5%<br />
8<br />
3 5<br />
699<br />
370 325<br />
98.9%<br />
Sarnia-Lambton 126 20 44% 56%<br />
11%<br />
3<br />
1 2<br />
1,038<br />
471 567<br />
99.7%<br />
Windsor-Essex 659 38 41% 59%<br />
6%<br />
62<br />
32 30<br />
2,287<br />
1,048 1,239<br />
97.3%<br />
Regional Total 2,580 204 47% 53% 6%<br />
178 62 115 10,856 5,116 5,706<br />
98.4%<br />
Provincial Total 18,471 1,747 58% 42% 5% 1,175 421 715 74,949 35,107 39,294<br />
98.4%<br />
* These reports are confidential, not for distribution<br />
Prepared by LTCRP.ISG@moh.gov.on.ca<br />
Current Month Eligible Waitlist Demand & Supply by Type - 01<br />
**Fill Rate Adjusted<br />
Created: 1/23/2007, 9:53:07AM<br />
Page 3 of 3
<strong>Long</strong>-<strong>Term</strong> <strong>Care</strong> Planning & Renewal Branch<br />
Current Month Eligible Waitlist Demand & Supply by Class*<br />
31-Dec-2006<br />
WAITLIST DEMAND<br />
SUPPLY**<br />
UTILIZATION**<br />
REGION<br />
Central-East<br />
CCAC<br />
Eligible<br />
Clients<br />
Waitlist<br />
Waiting<br />
Acute<br />
<strong>Care</strong><br />
Basic<br />
Preferred<br />
Waitlist<br />
Attrition<br />
Durham 760 79 44% 56% 5%<br />
Haliburton-Northumberland-Victoria 286 32 60% 40% 9%<br />
Peterborough 380 20 62% 38% 7%<br />
Simcoe County 1,109 43 66% 34% 3%<br />
York Region 912 53 64% 36% 6%<br />
Vacancy<br />
Total<br />
Vacancy<br />
Basic<br />
Vacancy<br />
Preferred<br />
Total<br />
Beds<br />
New<br />
A Beds<br />
B Beds<br />
C Beds<br />
D Beds<br />
<strong>Utilization</strong><br />
19 8 11 2,748 1,316 0 0 1,432 0 99.3%<br />
18 5 10 1,593 579 91 400 512 0 98.9%<br />
10 2 4 1,109 636 38 61 351 0 99.1%<br />
24 9 14 2,577 1,032 493 381 475 154 99.1%<br />
35 8 27 3,549 2,428 97 195 729 100 99.0%<br />
Regional Total 3,447 227 60% 40% 6% 106 32 66 11,576 5,991 719 1,037 3,499 254 99.1%<br />
Central-South<br />
Brant 85 37 58% 42% 8%<br />
Haldimand-Norfolk 81 33 73% 27% 16%<br />
Hamilton 717 119 59% 41% 2%<br />
Niagara 1,150 165 44% 56% 5%<br />
10 1 9 883 340 0 104 439 0 98.9%<br />
14 4 10 846 434 0 89 323 0 98.3%<br />
55 34 21 3,887 2,109 322 276 1,085 95 98.6%<br />
51 12 39 3,534 1,525 196 427 1,345 0 98.6%<br />
Regional Total 2,033 354 51% 49% 4% 130 51 79 9,150 4,408 518 896 3,192 95 98.6%<br />
Central-Toronto<br />
East York 60 11 67% 33% 6%<br />
Etobicoke-York 364 59 49% 51% 7%<br />
North York 775 54 71% 29% 5%<br />
Scarborough 1,002 72 79% 21% 5%<br />
Toronto 671 91 58% 42% 5%<br />
2 0 2 672 503 0 0 59 110 99.7%<br />
111 46 65 2,979 1,277 120 316 1,266 0 96.3%<br />
174 88 86 3,188 486 859 414 1,429 0 94.5%<br />
83 30 53 4,298 1,548 677 325 1,682 66 98.1%<br />
44 11 33 3,832 1,252 291 294 1,995 0 98.9%<br />
Regional Total 2,872 287 68% 32% 5% 414 175 239 14,969 5,066 1,947 1,349 6,431 176 97.2%<br />
* These reports are confidential, not for distribution<br />
Prepared by LTCRP.ISG@moh.gov.on.ca<br />
Current Month Eligible Waitlist Demand & Supply by Class - 02<br />
**Fill Rate Adjusted<br />
Created: 1/23/2007, 9:53:10AM<br />
Page 1 of 3
<strong>Long</strong>-<strong>Term</strong> <strong>Care</strong> Planning & Renewal Branch<br />
Current Month Eligible Waitlist Demand & Supply by Class*<br />
31-Dec-2006<br />
WAITLIST DEMAND<br />
SUPPLY**<br />
UTILIZATION**<br />
REGION<br />
Central-West<br />
CCAC<br />
Eligible<br />
Clients<br />
Waitlist<br />
Waiting<br />
Acute<br />
<strong>Care</strong><br />
Basic<br />
Preferred<br />
Waitlist<br />
Attrition<br />
Halton 343 29 50% 50% 10%<br />
Peel 453 62 69% 31% 9%<br />
Waterloo 697 28 51% 49% 4%<br />
Wellington-Dufferin 397 13 38% 62% 5%<br />
Vacancy<br />
Total<br />
Vacancy<br />
Basic<br />
Vacancy<br />
Preferred<br />
Total<br />
Beds<br />
New<br />
A Beds<br />
B Beds<br />
C Beds<br />
D Beds<br />
<strong>Utilization</strong><br />
35 13 22 2,381 1,767 197 190 227 0 98.5%<br />
66 16 50 4,035 2,471 241 148 1,175 0 98.4%<br />
10 5 5 2,559 1,306 163 307 783 0 99.6%<br />
34 8 26 1,440 660 0 125 655 0 97.6%<br />
Regional Total 1,890 132 52% 48% 7% 145 42 103 10,415 6,204 601 770 2,840 0 98.6%<br />
East<br />
Eastern Counties 252 44 61% 39% 8%<br />
Hastings-Prince Edward Counties 685 45 57% 43% 3%<br />
Kingston-Frontenac-Lennox-Addington 455 19 74% 26% 5%<br />
Lanark-Leeds-Grenville 473 41 46% 54% 6%<br />
Ottawa 1,398 159 43% 57% 4%<br />
Renfrew County 422 7 79% 21% 4%<br />
29 7 22 1,576 10 257 198 961 150 98.2%<br />
6 3 3 1,291 486 47 268 411 78 99.5%<br />
29 1 6 1,369 422 284 403 216 0 97.9%<br />
16 8 8 1,332 316 0 382 523 99 98.8%<br />
24 4 19 4,624 1,895 987 140 1,523 75 99.5%<br />
8 1 7 812 234 197 188 165 0 99.0%<br />
Regional Total 3,685 315 55% 45% 4% 112 24 65 11,004 3,363 1,772 1,579 3,799 402 99.0%<br />
North<br />
Algoma 255 33 88% 12% 7%<br />
Cochrane 202 40 63% 37% 4%<br />
Kenora-Rainy River 279 21 90% 10% 3%<br />
Manitoulin-Sudbury 327 54 62% 38% 5%<br />
Muskoka East Parry Sound 190 18 74% 26% 6%<br />
Near North 300 39 75% 25% 3%<br />
Thunder Bay 231 15 60% 40% 5%<br />
Timiskaming 131 5 72% 28% 6%<br />
West Parry Sound 49 3 63% 37% 7%<br />
14 1 12 1,004 459 0 60 253 106 98.6%<br />
6 1 4 655 141 33 243 177 0 99.1%<br />
9 6 2 556 85 42 0 344 0 98.4%<br />
21 12 9 1,544 616 59 32 717 0 98.6%<br />
6 1 5 712 559 0 0 141 0 99.2%<br />
3 3 0 770 0 0 171 560 0 99.6%<br />
23 8 11 1,165 381 150 106 122 298 98.0%<br />
2 2 0 364 81 0 79 204 0 99.5%<br />
6 1 5 209 189 0 0 0 0 97.1%<br />
Regional Total 1,964 228 73% 27% 5%<br />
90 35 48 6,979 2,511 284 691 2,518 404 98.7%<br />
* These reports are confidential, not for distribution<br />
Prepared by LTCRP.ISG@moh.gov.on.ca<br />
Current Month Eligible Waitlist Demand & Supply by Class - 02<br />
**Fill Rate Adjusted<br />
Created: 1/23/2007, 9:53:10AM<br />
Page 2 of 3
<strong>Long</strong>-<strong>Term</strong> <strong>Care</strong> Planning & Renewal Branch<br />
Current Month Eligible Waitlist Demand & Supply by Class*<br />
31-Dec-2006<br />
WAITLIST DEMAND<br />
SUPPLY**<br />
UTILIZATION**<br />
REGION<br />
South-West<br />
CCAC<br />
Eligible<br />
Clients<br />
Waitlist<br />
Waiting<br />
Acute<br />
<strong>Care</strong><br />
Basic<br />
Preferred<br />
Waitlist<br />
Attrition<br />
Chatham-Kent 71 20 79% 21% 10%<br />
Elgin 99 8 57% 43% 9%<br />
Grey-Bruce 131 22 59% 41% 7%<br />
Huron 68 6 51% 49% 10%<br />
London-Middlesex 990 84 49% 51% 6%<br />
Oxford 218 2 52% 48% 5%<br />
Perth County 218 4 23% 77% 5%<br />
Sarnia-Lambton 126 20 44% 56% 11%<br />
Windsor-Essex 659 38 41% 59% 6%<br />
Vacancy<br />
Total<br />
Vacancy<br />
Basic<br />
Vacancy<br />
Preferred<br />
Total<br />
Beds<br />
New<br />
A Beds<br />
B Beds<br />
C Beds<br />
D Beds<br />
<strong>Utilization</strong><br />
18 2 16 841 416 0 0 425 0 97.9%<br />
9 0 9 668 223 55 0 390 0 98.7%<br />
16 4 11 1,314 285 69 195 761 0 98.8%<br />
23 4 19 615 0 180 159 242 34 96.3%<br />
34 14 20 2,611 1,061 174 108 1,246 0 98.7%<br />
5 2 3 783 127 0 44 372 236 99.4%<br />
8 3 5 699 0 170 60 390 75 98.9%<br />
3 1 2 1,038 483 123 60 372 0 99.7%<br />
62 32 30 2,287 766 335 76 822 288 97.3%<br />
Regional Total 2,580 204 47% 53% 6% 178 62 115 10,856 3,361 1,106 702 5,020 633 98.4%<br />
Provincial Total 18,471 1,747 58% 42% 5% 1,175 421 715 74,949 30,904 6,947 7,024 27,299 1,964 98.4%<br />
* These reports are confidential, not for distribution<br />
Prepared by LTCRP.ISG@moh.gov.on.ca<br />
Current Month Eligible Waitlist Demand & Supply by Class - 02<br />
**Fill Rate Adjusted<br />
Created: 1/23/2007, 9:53:10AM<br />
Page 3 of 3
<strong>Long</strong>-<strong>Term</strong> <strong>Care</strong> Planning & Renewal Branch<br />
Rolling Supply Projections by Bed Classification*<br />
31-Dec-2006<br />
REGION CCAC<br />
Current Month** Current Month + 6 Months Current Month + 12 Months Current Month + 24 Months<br />
Central-East<br />
Total<br />
New A B C D<br />
Total New A B C D Total New A B C D Total New A B C<br />
Durham 2,748 1,316 0 0 1,432 0 2,748 1,316 0 0 1,432 0 2,748 1,316 0 0 1,432 0 2,748 1,316 0 0 1,432<br />
Haliburton-Northumberland-Victoria 1,593 579 91 400 512 0 1,593 579 91 400 512 0 1,593 579 91 400 512 0 1,582 579 91 400 512<br />
Peterborough 1,109 636 38 61 351 0 1,111 638 38 61 351 0 1,111 638 38 61 351 0 1,088 638 38 61 351<br />
Simcoe County 2,577 1,032 493 381 475 154 2,577 1,032 493 381 475 154 2,737 1,287 493 381 475 59 2,759 1,287 557 381 475<br />
York Region 3,549 2,428 97 195 729 100 3,594 2,573 97 195 729 0 3,594 2,573 97 195 729 0 3,594 2,573 97 195 729<br />
Regional Total 11,576 5,991 719 1,037 3,499 254 11,623 6,138 719 1,037 3,499 154 11,783 6,393 719 1,037 3,499 59 11,771 6,393 783 1,037 3,499<br />
Central-South<br />
Brant 883 340 0 104 439 0 883 340 0 104 439 0 883 340 0 104 439 0 883 340 0 104 439<br />
Haldimand-Norfolk 846 434 0 89 323 0 846 434 0 89 323 0 846 434 0 89 323 0 846 434 0 89 323<br />
Hamilton 3,887 2,109 322 276 1,085 95 3,901 2,217 322 277 1,085 0 3,901 2,217 322 277 1,085 0 3,901 2,217 322 277 1,085<br />
Niagara 3,534 1,525 196 427 1,345 0 3,534 1,525 196 427 1,345 0 3,534 1,525 196 427 1,345 0 3,493 1,525 196 427 1,345<br />
Regional Total 9,150 4,408 518 896 3,192 95 9,164 4,516 518 897 3,192 0 9,164 4,516 518 897 3,192 0 9,123 4,516 518 897 3,192<br />
Central-Toronto<br />
East York 672 503 0 0 59 110 672 503 0 0 59 110 672 503 0 0 59 110 690 631 0 0 59<br />
Etobicoke-York 2,979 1,277 120 316 1,266 0 2,979 1,277 120 316 1,266 0 3,011 1,309 120 316 1,266 0 3,011 1,309 120 316 1,266<br />
North York 3,188 486 859 414 1,429 0 3,188 486 859 414 1,429 0 3,188 486 859 414 1,429 0 3,188 486 859 414 1,429<br />
Scarborough 4,298 1,548 677 325 1,682 66 4,298 1,548 677 325 1,682 66 4,298 1,548 677 325 1,682 66 4,298 1,548 677 325 1,682<br />
Toronto 3,832 1,252 291 294 1,995 0 3,832 1,252 291 294 1,995 0 3,832 1,252 291 294 1,995 0 3,892 1,312 291 294 1,995<br />
Regional Total 14,969 5,066 1,947 1,349 6,431 176 14,969 5,066 1,947 1,349 6,431 176 15,001 5,098 1,947 1,349 6,431 176 15,079 5,286 1,947 1,349 6,431<br />
* These reports are confidential, not for distribution<br />
Prepared by LTCRP.ISG@moh.gov.on.ca<br />
Rolling Supply Projections by Bed Classification - 04<br />
**Fill Rate Adjusted<br />
Created: 1/23/2007, 9:53:13AM<br />
Page 1 of 3
<strong>Long</strong>-<strong>Term</strong> <strong>Care</strong> Planning & Renewal Branch<br />
Rolling Supply Projections by Bed Classification*<br />
31-Dec-2006<br />
REGION CCAC<br />
Current Month** Current Month + 6 Months Current Month + 12 Months Current Month + 24 Months<br />
Central-West<br />
East<br />
North<br />
Total<br />
New A B C D<br />
Total New A B C D Total New A B C D Total New A B C<br />
Halton 2,381 1,767 197 190 227 0 2,381 1,767 197 190 227 0 2,381 1,767 197 190 227 0 2,381 1,767 197 190 227<br />
Peel 4,035 2,471 241 148 1,175 0 4,030 2,471 241 148 1,170 0 4,020 2,471 241 148 1,160 0 4,061 2,471 241 148 1,201<br />
Waterloo 2,559 1,306 163 307 783 0 2,555 1,305 163 306 781 0 2,555 1,305 163 306 781 0 2,555 1,305 163 306 781<br />
Wellington-Dufferin 1,440 660 0 125 655 0 1,440 660 0 125 655 0 1,440 660 0 125 655 0 1,440 660 0 125 655<br />
Regional Total 10,415 6,204 601 770 2,840 0 10,406 6,203 601 769 2,833 0 10,396 6,203 601 769 2,823 0 10,437 6,203 601 769 2,864<br />
Eastern Counties 1,576 10 257 198 961 150 1,576 10 257 198 961 150 1,576 160 257 198 961 0 1,576 160 257 198 961<br />
Hastings-Prince Edward Counties 1,291 486 47 268 411 78 1,291 486 47 268 411 78 1,291 486 47 268 411 78 1,290 486 47 268 489<br />
Kingston-Frontenac-Lennox-Addington 1,369 422 284 403 216 0 1,369 422 284 403 216 0 1,369 422 284 403 216 0 1,325 422 284 403 216<br />
Lanark-Leeds-Grenville 1,332 316 0 382 523 99 1,354 437 0 382 523 0 1,354 437 0 382 523 0 1,342 437 0 382 523<br />
Ottawa 4,624 1,895 987 140 1,523 75 4,624 1,895 987 140 1,523 75 4,709 2,055 987 140 1,523 0 4,705 2,055 987 140 1,523<br />
Renfrew County 812 234 197 188 165 0 812 234 197 188 165 0 812 234 197 188 165 0 784 234 197 188 165<br />
Regional Total 11,004 3,363 1,772 1,579 3,799 402 11,026 3,484 1,772 1,579 3,799 303 11,111 3,794 1,772 1,579 3,799 78 11,022 3,794 1,772 1,579 3,877<br />
Algoma 1,004 459 0 60 253 106 1,004 459 0 60 253 106 1,004 459 0 60 253 106 916 459 0 60 253<br />
Cochrane 655 141 33 243 177 0 655 141 33 243 177 0 655 141 33 243 177 0 634 141 33 243 177<br />
Kenora-Rainy River 556 85 42 0 344 0 556 85 42 0 344 0 556 85 42 0 344 0 546 85 42 0 344<br />
Manitoulin-Sudbury 1,544 616 59 32 717 0 1,544 616 59 32 717 0 1,544 616 59 32 717 0 1,472 616 59 32 717<br />
Muskoka East Parry Sound 712 559 0 0 141 0 712 559 0 0 141 0 712 559 0 0 141 0 700 559 0 0 141<br />
Near North 770 0 0 171 560 0 769 0 0 171 559 0 769 0 0 171 559 0 730 0 0 171 559<br />
Thunder Bay 1,165 381 150 106 122 298 1,165 381 150 106 122 298 1,165 381 150 106 122 298 1,099 381 150 106 122<br />
Timiskaming 364 81 0 79 204 0 364 81 0 79 204 0 364 81 0 79 204 0 364 81 0 79 204<br />
West Parry Sound 209 189 0 0 0 0 209 189 0 0 0 0 209 189 0 0 0 0 209 189 0 0 0<br />
Regional Total 6,979 2,511 284 691 2,518 404 6,978 2,511 284 691 2,517 404 6,978 2,511 284 691 2,517 404 6,670 2,511 284 691 2,517<br />
* These reports are confidential, not for distribution<br />
Prepared by LTCRP.ISG@moh.gov.on.ca<br />
Rolling Supply Projections by Bed Classification - 04<br />
**Fill Rate Adjusted<br />
Created: 1/23/2007, 9:53:13AM<br />
Page 2 of 3
<strong>Long</strong>-<strong>Term</strong> <strong>Care</strong> Planning & Renewal Branch<br />
Rolling Supply Projections by Bed Classification*<br />
31-Dec-2006<br />
REGION CCAC<br />
Current Month** Current Month + 6 Months Current Month + 12 Months Current Month + 24 Months<br />
South-West<br />
Total<br />
New A B C D<br />
Total New A B C D Total New A B C D Total New A B C<br />
Chatham-Kent 841 416 0 0 425 0 841 416 0 0 425 0 841 416 0 0 425 0 841 416 0 0 425<br />
Elgin 668 223 55 0 390 0 668 223 55 0 390 0 668 223 55 0 390 0 668 223 55 0 390<br />
Grey-Bruce 1,314 285 69 195 761 0 1,314 285 69 195 761 0 1,314 285 69 195 761 0 1,310 285 69 195 761<br />
Huron 615 0 180 159 242 34 615 0 180 159 242 34 615 0 180 159 242 34 615 34 180 159 242<br />
London-Middlesex 2,611 1,061 174 108 1,246 0 2,611 1,061 174 108 1,246 0 2,611 1,061 174 108 1,246 0 2,589 1,061 174 108 1,246<br />
Oxford 783 127 0 44 372 236 784 284 0 44 372 80 784 284 0 44 372 80 780 284 0 44 372<br />
Perth County 699 0 170 60 390 75 699 0 170 60 390 75 699 0 170 60 390 75 695 75 170 60 390<br />
Sarnia-Lambton 1,038 483 123 60 372 0 1,038 483 123 60 372 0 1,038 483 123 60 372 0 1,038 483 123 60 372<br />
Windsor-Essex 2,287 766 335 76 822 288 2,317 1,084 335 76 822 0 2,317 1,084 335 76 822 0 2,317 1,084 335 76 822<br />
Regional Total 10,856 3,361 1,106 702 5,020 633 10,887 3,836 1,106 702 5,020 189 10,887 3,836 1,106 702 5,020 189 10,853 3,945 1,106 702 5,020<br />
Provincial Total 74,949 30,904 6,947 7,024 27,299 1,964 75,053 31,754 6,947 7,024 27,291 1,226 75,320 32,351 6,947 7,024 27,281 906 74,955 32,648 7,011 7,024 27,400<br />
* These reports are confidential, not for distribution<br />
Prepared by LTCRP.ISG@moh.gov.on.ca<br />
Rolling Supply Projections by Bed Classification - 04<br />
**Fill Rate Adjusted<br />
Created: 1/23/2007, 9:53:13AM<br />
Page 3 of 3
<strong>Long</strong>-<strong>Term</strong> <strong>Care</strong> Planning & Renewal Branch<br />
Rolling Supply Projections by Bed Type*<br />
31-Dec-2006<br />
REGION CCAC Current Month** Current Month + 6 Months Current Month + 12 Months<br />
Central-East<br />
Current Month + 24 Months<br />
Total Basic Semi Private Total Basic Semi Private Total Basic Semi Private Total Basic Semi Private<br />
Durham<br />
Haliburton-Northumberland-Victoria<br />
Peterborough<br />
Simcoe County<br />
York Region<br />
2,748 1,340 649 759 2,748 1,340 649 759 2,748 1,340 649 759 2,748 1,340 649 759<br />
1,593 707 362 513 1,593 707 362 513 1,593 707 362 513 1,582 707 362 513<br />
1,109 496 226 364 1,111 496 226 366 1,111 496 226 366 1,088 496 226 366<br />
2,577 1,114 395 1,026 2,577 1,114 395 1,026 2,737 1,166 374 1,155 2,759 1,192 374 1,193<br />
3,549 1,598 306 1,645 3,594 1,612 290 1,692 3,594 1,612 290 1,692 3,594 1,612 290 1,692<br />
Total Region 11,576 5,255 1,938 4,307 11,623 5,269 1,922 4,356 11,783 5,321 1,901 4,485 11,771 5,347 1,901 4,523<br />
Central-South<br />
Brant<br />
Haldimand-Norfolk<br />
Hamilton<br />
Niagara<br />
883 368 274 241 883 368 274 241 883 368 274 241 883 368 274 241<br />
846 391 152 303 846 391 152 303 846 391 152 303 846 391 152 303<br />
3,887 1,831 455 1,601 3,901 1,797 455 1,649 3,901 1,797 455 1,649 3,901 1,797 455 1,649<br />
3,534 1,570 671 1,252 3,534 1,570 671 1,252 3,534 1,570 671 1,252 3,493 1,570 671 1,252<br />
Total Region 9,150 4,160 1,552 3,397 9,164 4,126 1,552 3,445 9,164 4,126 1,552 3,445 9,123 4,126 1,552 3,445<br />
Central-Toronto<br />
East York<br />
Etobicoke-York<br />
North York<br />
Scarborough<br />
Toronto<br />
672 332 89 251 672 332 89 251 672 332 89 251 690 333 49 308<br />
2,979 1,421 696 862 2,979 1,421 696 862 3,011 1,434 696 881 3,011 1,434 696 881<br />
3,188 1,452 928 808 3,188 1,452 928 808 3,188 1,452 928 808 3,188 1,452 928 808<br />
4,298 1,921 944 1,433 4,298 1,921 944 1,433 4,298 1,921 944 1,433 4,298 1,921 944 1,433<br />
3,832 2,068 836 928 3,832 2,068 836 928 3,832 2,068 836 928 3,892 2,092 836 964<br />
Total Region 14,969 7,194 3,493 4,282 14,969 7,194 3,493 4,282 15,001 7,207 3,493 4,301 15,079 7,232 3,453 4,394<br />
* These reports are confidential, not for distribution<br />
Prepared by LTCRP.ISG@moh.gov.on.ca<br />
Rolling Supply Projections by Bed Type - 05<br />
**Fill Rate Adjusted<br />
Created: 1/23/2007, 9:53:15AM<br />
Page 1 of 3
<strong>Long</strong>-<strong>Term</strong> <strong>Care</strong> Planning & Renewal Branch<br />
Rolling Supply Projections by Bed Type*<br />
31-Dec-2006<br />
REGION CCAC Current Month** Current Month + 6 Months Current Month + 12 Months<br />
Central-West<br />
Current Month + 24 Months<br />
Total Basic Semi Private Total Basic Semi Private Total Basic Semi Private Total Basic Semi Private<br />
Halton<br />
Peel<br />
Waterloo<br />
Wellington-Dufferin<br />
2,381 1,146 182 1,053 2,381 1,146 182 1,053 2,381 1,146 182 1,053 2,381 1,146 182 1,053<br />
4,035 1,812 659 1,564 4,030 1,812 654 1,564 4,020 1,812 653 1,555 4,061 1,853 653 1,555<br />
2,559 1,168 259 1,132 2,555 1,167 258 1,130 2,555 1,167 258 1,130 2,555 1,167 258 1,130<br />
1,440 707 322 411 1,440 707 322 411 1,440 707 322 411 1,440 707 322 411<br />
Total Region 10,415 4,833 1,422 4,160 10,406 4,832 1,416 4,158 10,396 4,832 1,415 4,149 10,437 4,873 1,415 4,149<br />
East<br />
Eastern Counties<br />
Hastings-Prince Edward Counties<br />
Kingston-Frontenac-Lennox-Addington<br />
Lanark-Leeds-Grenville<br />
Ottawa<br />
Renfrew County<br />
1,576 856 320 400 1,576 856 320 400 1,576 796 320 460 1,576 796 320 460<br />
1,291 652 434 204 1,291 652 434 204 1,291 652 434 204 1,290 635 414 241<br />
1,369 573 304 448 1,369 573 304 448 1,369 573 304 448 1,325 573 304 448<br />
1,332 638 329 353 1,354 647 303 392 1,354 647 303 392 1,342 647 303 392<br />
4,624 2,035 546 2,039 4,624 2,035 546 2,039 4,709 2,069 508 2,128 4,705 2,069 508 2,128<br />
812 352 158 274 812 352 158 274 812 352 158 274 784 352 158 274<br />
Total Region 11,004 5,106 2,091 3,718 11,026 5,115 2,065 3,757 11,111 5,089 2,027 3,906 11,022 5,072 2,007 3,943<br />
North<br />
Algoma<br />
Cochrane<br />
Kenora-Rainy River<br />
Manitoulin-Sudbury<br />
Muskoka East Parry Sound<br />
Near North<br />
Thunder Bay<br />
Timiskaming<br />
West Parry Sound<br />
1,004 539 229 148 1,004 539 229 148 1,004 539 229 148 916 539 229 148<br />
655 288 200 146 655 288 200 146 655 288 200 146 634 288 200 146<br />
556 212 101 233 556 212 101 233 556 212 101 233 546 212 101 233<br />
1,544 734 312 426 1,544 734 312 426 1,544 734 312 426 1,472 734 312 426<br />
712 350 55 295 712 350 55 295 712 350 55 295 700 350 55 295<br />
770 512 152 67 769 512 151 67 769 512 151 67 730 512 151 67<br />
1,165 552 260 287 1,165 552 260 287 1,165 552 260 287 1,099 552 260 287<br />
364 172 132 60 364 172 132 60 364 172 132 60 364 172 132 60<br />
209 84 42 83 209 84 42 83 209 84 42 83 209 84 42 83<br />
Total Region 6,979 3,443 1,483 1,745 6,978 3,443 1,482 1,745 6,978 3,443 1,482 1,745 6,670 3,443 1,482 1,745<br />
* These reports are confidential, not for distribution<br />
Prepared by LTCRP.ISG@moh.gov.on.ca<br />
Rolling Supply Projections by Bed Type - 05<br />
**Fill Rate Adjusted<br />
Created: 1/23/2007, 9:53:15AM<br />
Page 2 of 3
<strong>Long</strong>-<strong>Term</strong> <strong>Care</strong> Planning & Renewal Branch<br />
Rolling Supply Projections by Bed Type*<br />
31-Dec-2006<br />
REGION CCAC Current Month** Current Month + 6 Months Current Month + 12 Months<br />
South-West<br />
Current Month + 24 Months<br />
Total Basic Semi Private Total Basic Semi Private Total Basic Semi Private Total Basic Semi Private<br />
Chatham-Kent<br />
Elgin<br />
Grey-Bruce<br />
Huron<br />
London-Middlesex<br />
Oxford<br />
Perth County<br />
Sarnia-Lambton<br />
Windsor-Essex<br />
841 362 177 302 841 362 177 302 841 362 177 302 841 362 177 302<br />
668 404 137 127 668 404 137 127 668 404 137 127 668 404 137 127<br />
1,314 636 392 282 1,314 636 392 282 1,314 636 392 282 1,310 636 392 282<br />
615 322 165 128 615 322 165 128 615 322 165 128 615 322 165 128<br />
2,611 1,104 471 1,014 2,611 1,104 471 1,014 2,611 1,104 471 1,014 2,589 1,104 471 1,014<br />
783 399 217 163 784 358 182 240 784 358 182 240 780 358 182 240<br />
699 370 165 160 699 370 165 160 699 370 165 160 695 344 155 196<br />
1,038 471 202 365 1,038 471 202 365 1,038 471 202 365 1,038 471 202 365<br />
2,287 1,048 476 763 2,317 1,047 356 914 2,317 1,047 356 914 2,317 1,047 356 914<br />
Total Region 10,856 5,116 2,402 3,304 10,887 5,074 2,247 3,532 10,887 5,074 2,247 3,532 10,853 5,048 2,237 3,568<br />
Provincial Total 74,949 35,107 14,381 24,913 75,053 35,053 14,177 25,275 75,320 35,092 14,117 25,563 74,955 35,141 14,047 25,767<br />
* These reports are confidential, not for distribution<br />
Prepared by LTCRP.ISG@moh.gov.on.ca<br />
Rolling Supply Projections by Bed Type - 05<br />
**Fill Rate Adjusted<br />
Created: 1/23/2007, 9:53:15AM<br />
Page 3 of 3
These reports are confidential and not for distribution<br />
<strong>Utilization</strong> Management Charts<br />
1. Current Demand Vs. Current and Projected Supply by Region<br />
2. Current Demand Vs. Current and Projected Supply by CCAC - Top 10<br />
3. Current Demand Vs. Current and Projected Supply by CCAC - Bottom 10<br />
4. CCAC New Bed Fill Period Overlap<br />
<strong>Long</strong>-<strong>Term</strong> <strong>Care</strong> Planning & Renewal Branch<br />
<strong>Utilization</strong> Management Report Package –December, 2006<br />
18
<strong>Long</strong>-<strong>Term</strong> <strong>Care</strong> Planning & Renewal Branch<br />
Current Demand Vs. Current** and Projected Supply by Region*<br />
31-Dec-2006<br />
18,000<br />
16,000<br />
14,000<br />
12,000<br />
10,000<br />
8,000<br />
@Current Demand<br />
@Current Supply<br />
@Current + 24 Months<br />
6,000<br />
4,000<br />
2,000<br />
0<br />
CE<br />
CS<br />
CT<br />
CW<br />
E<br />
N<br />
SW<br />
Region<br />
* This report is confidential, not for distribution.<br />
Prepared by LTCRP.ISG@moh.gov.on.ca<br />
Current Demand vs. Current and Projected Supply by Region - A<br />
**Fill Rate Adjusted<br />
Created: 1/23/2007, 9:53:20AM<br />
Page 1 of 1
<strong>Long</strong>-<strong>Term</strong> <strong>Care</strong> Planning & Renewal Branch<br />
Current Demand Vs. Current** and Projected Supply by CCAC - Top 10*<br />
31-Dec-2006<br />
5000<br />
4500<br />
4000<br />
3500<br />
3000<br />
2500<br />
2000<br />
1500<br />
1000<br />
@Current Demand<br />
@Current Supply<br />
@Current + 24 Months<br />
500<br />
0<br />
Renfrew County<br />
Hastings-Prince Edward Counties<br />
Kenora-Rainy River<br />
Near North<br />
London-Middlesex<br />
Timiskaming<br />
Peterborough<br />
Kingston-Frontenac-Lennox-Addington<br />
Lanark-Leeds-Grenville<br />
Niagara<br />
* This report is confidential, not for distribution.<br />
Prepared by LTCRP.ISG@moh.gov.on.ca<br />
Current Demand vs. Current and Projected Supply by CCAC - Top 10 - B<br />
**Fill Rate Adjusted<br />
Created: 1/23/2007, 9:53:21AM Page 1 of 2
<strong>Long</strong>-<strong>Term</strong> <strong>Care</strong> Planning & Renewal Branch<br />
Current Demand Vs. Current** and Projected Supply by CCAC - Bottom 10*<br />
31-Dec-2006<br />
4500<br />
4000<br />
3500<br />
3000<br />
2500<br />
2000<br />
1500<br />
@Current Demand<br />
@Current Supply<br />
@Current + 24 Months<br />
1000<br />
500<br />
0<br />
East York<br />
Chatham-Kent<br />
Huron<br />
Etobicoke-York<br />
Haldimand-Norfolk<br />
Brant<br />
Grey-Bruce<br />
Peel<br />
Sarnia-Lambton<br />
Halton<br />
CCAC<br />
* This report is confidential, not for distribution.<br />
Prepared by LTCRP.ISG@moh.gov.on.ca<br />
Current Demand vs. Current and Projected Supply by CCAC - Bottom 10 - C<br />
**Fill Rate Adjusted<br />
Created: 1/23/2007, 9:53:22AM Page 1 of 1
<strong>Long</strong>-<strong>Term</strong> <strong>Care</strong> Planning & Renewal Branch<br />
CCAC New Bed Fill Period Overlap 2006 - 2008<br />
31-Dec-06<br />
2006<br />
2007 2008<br />
Region<br />
CCACName<br />
FacilityName<br />
7 8 9 10 11 12 1 2 3 4 5 6 7 8 9 10 11 12 1 2 3 4 5 6<br />
Simcoe County THE ONTARIO LONG-TERM CARE HOME FOR THE DEAF 64 0<br />
Simcoe County Total 64 0<br />
Central-East<br />
York Region Villa Colombo Seniors Centre (Vaughan) Inc. 160 0 0 0<br />
York Region Total 160 0 0 0<br />
Central-East Total 64 0 160 0 0 0<br />
2006 2007 2008<br />
Region CCACName FacilityName<br />
7 8 9 10 11 12 1 2 3 4 5 6 7 8 9 10 11 12 1 2 3 4 5 6<br />
Etobicoke-York UKRAINIAN CANADIAN CARE CENTRE 32 0<br />
Etobicoke-York Total 32 0<br />
Central-Toronto<br />
Toronto Korean Home Development Society 60 0<br />
Toronto Total 60 0<br />
Central-Toronto Total 32 0 60 0<br />
2006<br />
2007 2008<br />
Region CCACName FacilityName<br />
7 8 9 10 11 12 1 2 3 4 5 6 7 8 9 10 11 12 1 2 3 4 5 6<br />
North<br />
Kenora-Rainy River PRINCESS COURT 32<br />
Kenora-Rainy River Total 32<br />
North Total 32<br />
* This report is confidential, not for distribution.<br />
Produced by LTCRP.ISG@moh.gov.on.ca<br />
CCAC New Bed Fill Period Overlap 2006-2008 Report D 01/23/2007 1
These reports are confidential and not for distribution<br />
Report Summaries<br />
Current<br />
Month Eligible<br />
Waitlist<br />
Demand &<br />
Supply by<br />
Type<br />
This report presents the Demand and Supply of <strong>Long</strong>-<strong>Term</strong> <strong>Care</strong> beds,<br />
by bed type, with utilization rates, at the CCAC level with totals for the<br />
Regional and Provincial levels on the month-end report date.<br />
Eligible Demand represents the number of distinct clients that have<br />
applied and are eligible for <strong>Long</strong> <strong>Term</strong> <strong>Care</strong>. Occupied interim beds<br />
are included in the Eligible Demand. Inter-facility transfers are<br />
subtracted (as there is no net gain or loss to the system). Eligible<br />
Waitlist Demand is presented at the bed type level.<br />
Supply data is presented by bed vacancies, and operational beds in<br />
the CCAC service area, by type.<br />
The vacancy and waitlist data is supplied at month-end by the<br />
CCAC’s.<br />
<strong>Utilization</strong> indicates the percentage of LTC beds currently filled on the<br />
month-end date.<br />
Current<br />
Month Eligible<br />
Waitlist<br />
Demand &<br />
Supply by<br />
Class<br />
As above, except SUPPLY is provided by Structural Class. (New, A, B,<br />
C, or D)<br />
Current<br />
Month CCAC<br />
Waitlist<br />
This report presents waitlist data by client location and waitlist<br />
preferences at the bed type level at the month-end report date. The<br />
data is presented at the CCAC level with totals at the Regional and<br />
Provincial level.<br />
Eligible Demand represents the numbers of clients that, based on<br />
reports from the CCAC’s, have applied and are eligible for <strong>Long</strong> <strong>Term</strong><br />
<strong>Care</strong>. Occupied interim beds are included in the Eligible Demand.<br />
Waitlist data is supplied at month-end by the CCAC’s.<br />
Rolling<br />
Supply<br />
Projections<br />
by<br />
Classification<br />
This report shows current total beds by Facility Classification with<br />
projections for 6, 12, 24 months from the month-end report date. Bed<br />
totals are at the CCAC level with totals for the Regional and Provincial<br />
levels.<br />
<strong>Long</strong>-<strong>Term</strong> <strong>Care</strong> Planning & Renewal Branch<br />
<strong>Utilization</strong> Management Report Package –December, 2006<br />
23
These reports are confidential and not for distribution<br />
Rolling<br />
Supply<br />
Projection by<br />
Bed Type<br />
This report shows current total beds by Bed Type (Basic, Semi-<br />
Private, or Private) with projections for 6, 12, 24 months from the<br />
month-end report date. Bed totals are at the CCAC level with totals for<br />
the Regional and Provincial levels.<br />
<strong>Utilization</strong>-<br />
Normal &<br />
Adjusted<br />
Month-Over-<br />
Month<br />
This report shows each CCAC’s normal <strong>Utilization</strong> Rate (% of beds<br />
available currently in use) and the Fill Rate Adjusted <strong>Utilization</strong> Rate<br />
for the current reporting period and the previous reporting period with<br />
the month-over-month change. The Fill Rate Adjustment accounts for<br />
a new facility’s or an RFP Awardee’s fill period. (The time required to<br />
fill newly opened beds as defined in the Fill Rate Guidelines.)<br />
Please see the Fill Rate Guidelines for more information on fill periods.<br />
<strong>Utilization</strong> by<br />
Type and<br />
Class<br />
This report presents each CCAC’s Fill Rate Adjusted <strong>Utilization</strong> Rate<br />
(% of beds available currently in use) by bed Type and structural class<br />
for the current reporting period. The Fill Rate Adjustment accounts for<br />
a new facility’s or an RFP Awardee’s fill period. (The time required to<br />
fill newly opened beds as defined in the Fill Rate Guidelines.)<br />
Please see the Fill Rate Guidelines for more information on fill periods.<br />
<strong>Long</strong>-<strong>Term</strong> <strong>Care</strong> Planning & Renewal Branch<br />
<strong>Utilization</strong> Management Report Package –December, 2006<br />
24
These reports are confidential and not for distribution<br />
Chart Summaries<br />
Current<br />
Demand vs.<br />
Current and<br />
Projected<br />
Supply- by<br />
Region<br />
This chart captures the current demand and supply (as of the reporting<br />
date) as well as the Current + 24 Months supply, presented as a bar<br />
graph by Region.<br />
Current<br />
Demand vs.<br />
Current and<br />
Projected<br />
Supply by<br />
CCAC - Top<br />
10<br />
This chart captures the ten greatest differences between the current<br />
demand and the Current + 24 Months supply, as calculated as a<br />
percentage (Current Demand/ Current + 24 Months Supply). This<br />
calculation is presented as a bar graph, by bed numbers, by CCAC<br />
and includes current supply.<br />
Current<br />
Demand vs.<br />
Current and<br />
Projected<br />
Supply by<br />
CCAC -<br />
Bottom 10<br />
This chart captures the ten smallest differences between the current<br />
demand and the Current + 24 Months supply, as calculated as a<br />
percentage (Current Demand/ Current + 24 Months Supply). This<br />
calculation is presented as a bar graph, by bed numbers, by CCAC<br />
and includes current supply.<br />
CCAC New<br />
Bed Fill<br />
Period<br />
Overlap<br />
This chart lists the expected opening dates and fill period of ‘NEW’<br />
facilities or RFP Awards only, by month for 2004 to 2006. The number<br />
of new beds is listed in the expected month of the facility opening. The<br />
zeros in subsequent months indicate the expected fill period. The fill<br />
period is calculated at the rate of two beds per calendar day.<br />
Please see definitions for a more complete explanation of Fill Rate<br />
calculations.<br />
The intent of this report is to identify the CCAC’s in the province where<br />
multiple facilities are opening or filling within the same month. This will<br />
support proper strategy and planning to meet fill rate targets.<br />
<strong>Long</strong>-<strong>Term</strong> <strong>Care</strong> Planning & Renewal Branch<br />
<strong>Utilization</strong> Management Report Package –December, 2006<br />
25
These reports are confidential and not for distribution<br />
Bed Supply<br />
Ratio –<br />
Current<br />
Month<br />
This chart indicates the ratio of operational beds available for the<br />
month-end reported per 1,000 people over the age of 75 for the<br />
current year, as supplied by Statistics Canada. (2001 Census<br />
Projections)<br />
Bed Supply<br />
Ratio –<br />
Current + 24<br />
Months<br />
This chart indicates the ratio of operational beds available in 24<br />
Months, per 1,000 people over the age of 75, as supplied by Statistics<br />
Canada. (2001 Census Projections)<br />
Demand Ratio<br />
– Current<br />
Month<br />
This chart indicates CCAC demand for <strong>Long</strong>-<strong>Term</strong> <strong>Care</strong> beds per<br />
1,000 people over the age of 75 for the current year, as supplied by<br />
Statistics Canada. (2001 Census Projections)<br />
Demand is defined as Total Demand. See the ‘Definitions’ section for<br />
more information.<br />
<strong>Long</strong>-<strong>Term</strong> <strong>Care</strong> Planning & Renewal Branch<br />
<strong>Utilization</strong> Management Report Package –December, 2006<br />
26
These reports are confidential and not for distribution<br />
Data Collection<br />
Demand Data<br />
Collection<br />
Demand data is collected at the month-end using data extracts from<br />
the Client Profiling Database (CPRO). The data is provided and<br />
supported by <strong>Ontario</strong>’s 42 CCAC’s. Additional information on the<br />
number of vacancies by facility is collected monthly from CCAC’s.<br />
Supply Data<br />
Collection<br />
Supply data is collected and analyzed from a number of existing<br />
Ministry of Health systems.<br />
‘New’ facilities, not yet constructed or open, are assumed to have a<br />
60/40 split of Private / Basic beds. As the actual bed designations<br />
become available, this information will be revised.<br />
Known Data<br />
Issues<br />
• For the purposes of management reporting, Bed Classification<br />
information should be considered to be complete. Certain<br />
assumptions have been made regarding the Bed Type split at<br />
some facilities. As the actual structural composition of the facilities<br />
becomes available, the information will be revised.<br />
• D Beds designated for major refurbishment are assumed to be<br />
continuously available throughout the project.<br />
<strong>Long</strong>-<strong>Term</strong> <strong>Care</strong> Planning & Renewal Branch<br />
<strong>Utilization</strong> Management Report Package –December, 2006<br />
27
These reports are confidential and not for distribution<br />
Definitions<br />
A Beds<br />
Beds located in facilities, or sections of facilities, structurally classified<br />
as ‘A’, that are occupied or available for occupancy at the facility level<br />
on the month-end report date(s). Facility level information is available<br />
from September 30, 2002 onward.<br />
B Beds<br />
Beds located in facilities, or sections of facilities, structurally classified<br />
as ‘B’, that are occupied or available for occupancy at the facility level<br />
on the month-end report date(s). Facility level information is available<br />
from September 30, 2002 onward.<br />
Basic Beds<br />
Beds located in facilities, or sections of facilities, structurally classified<br />
as ‘Basic’ (as determined by comparative structural standards) that are<br />
occupied or available for occupancy at the facility level on the monthend<br />
report date(s). Facility level information is available from<br />
September 30, 2002 onward.<br />
Bed Type<br />
Types of beds are Basic, Semi-Private or Private. The bed type is<br />
determined by structural standards and number of beds per room.<br />
Facility level information is available from September 30, 2002 onward.<br />
C Beds<br />
Beds located in facilities, or sections of facilities, structurally classified<br />
as ‘C’ or former D beds that completed their upgrade (D Upgrade<br />
Beds), that are occupied or available for occupancy at the facility level<br />
on the month-end report date. Facility level information is available<br />
from September 30, 2002 onward.<br />
CCAC<br />
Community <strong>Care</strong> Access Centre<br />
Class/<br />
Classification<br />
The designated classification of a facility, or section of a facility, as<br />
determined by a structural standards survey. Classifications are New,<br />
A, B, C, D, in descending order.<br />
<strong>Long</strong>-<strong>Term</strong> <strong>Care</strong> Planning & Renewal Branch<br />
<strong>Utilization</strong> Management Report Package –December, 2006<br />
28
These reports are confidential and not for distribution<br />
Clients From<br />
Out Of CCAC<br />
Area<br />
Number of eligible clients who are waitlisted for a facility within the<br />
CCAC's service area, whose current location is outside the CCAC<br />
service area on the month-end report date(s). These numbers include<br />
clients who are in a long term care home in another CCAC who wish to<br />
transfer to a home within the CCAC; individuals in interim beds outside<br />
of the CCAC seeking permanent placement to a home within the<br />
CCAC; and individuals residing in the community outside of the CCAC<br />
seeking a first placement to a home within the CCAC. NOTE: Clients<br />
waiting for multiple facilities in this CCAC area are only counted once.<br />
D Beds<br />
Beds located in facilities, or sections of facilities, structurally classified<br />
as ‘D’, that are occupied or available for occupancy at the facility level<br />
as of the month-end report date(s). Beds in ‘D’ class facilities<br />
designated for upgrade to the ‘C’ classification are assumed to be<br />
continuously available throughout the project. Beds in ‘D’ class<br />
facilities that have opted to redevelop (build wholly new facilities) or<br />
have opted to retro-fit their existing facilities, will be re-classified as<br />
‘New’ facilities at the date of the new facility opening. Facility level<br />
information is available from September 30, 2002 onward.<br />
Demand<br />
Number of <strong>Long</strong>-<strong>Term</strong> <strong>Care</strong> residents combined with the number of<br />
clients designated as eligible for placement to a <strong>Long</strong> -<strong>Term</strong> <strong>Care</strong><br />
facility on the month-end report date(s).<br />
See “Eligible Client Waitlist” definition.<br />
Eldcap Beds<br />
Eldcap (Elderly Capital Assistance Program) beds were established<br />
with capital assistance from the Ministry of Northern Development and<br />
Mines in Northern <strong>Ontario</strong> communities that did not have any <strong>Long</strong>-<br />
<strong>Term</strong> <strong>Care</strong> Facilities. These beds are operated by local hospitals and<br />
are either additions to existing hospitals or are free-standing homes<br />
operated by hospitals. These beds are licensed under the same<br />
legislation that governs <strong>Long</strong>-<strong>Term</strong> <strong>Care</strong> Homes (Nursing Homes Act)<br />
and are subject to the <strong>Long</strong>-<strong>Term</strong> <strong>Care</strong> Program requirements and<br />
compliance regime but are funded through a hospital’s global budget.<br />
<strong>Long</strong>-<strong>Term</strong> <strong>Care</strong> Planning & Renewal Branch<br />
<strong>Utilization</strong> Management Report Package –December, 2006<br />
29
These reports are confidential and not for distribution<br />
Eligible Client<br />
Waitlist<br />
The total number of clients, not currently residing in a permanent LTC<br />
bed, who have applied for <strong>Long</strong>-<strong>Term</strong> <strong>Care</strong> and have been designated<br />
eligible. Occupied interim beds are included in the Eligible Demand.<br />
This calculation is extracted from data in the Client Profiling (CPRO)<br />
and Occupancy Monitoring (OCCM) databases.<br />
Calculation: [Number of clients by CCAC waiting for LTC facility] -<br />
[Waitlisted for LTC Facility Transfer] + [Interim Beds] – [Interim<br />
Vacancies]<br />
Fill Period<br />
The projected amount of time required for a facility’s New beds to be<br />
filled, based on the Fill Rate.<br />
See the Fill Rate definition below.<br />
Fill Rate<br />
It is assumed New beds (i.e. - additional capacity) will be filled at two<br />
beds per day for two months and three beds a day thereafter.<br />
Redeveloped ‘D’ beds are assumed to be filled immediately.<br />
FMIS<br />
Facility Management Information System managed by the Ministry of<br />
Health and <strong>Long</strong>-<strong>Term</strong> <strong>Care</strong>.<br />
LTC<br />
<strong>Long</strong>-<strong>Term</strong> <strong>Care</strong><br />
MIS<br />
Management Information System. The proprietary project<br />
management system used by the Account Managers of the <strong>Long</strong>-<strong>Term</strong><br />
<strong>Care</strong> Redevelopment Project.<br />
New Beds<br />
‘New’ beds are beds built, based on Ministry of Health Request For<br />
Proposal Awards (1998, 1999 and 2001), Direct Ministry Awards or<br />
beds in formerly ‘D’ class facilities that have opted to build wholly new<br />
facilities or retro-fit existing facilities and are therefore considered<br />
‘New.’ ‘New’ bed totals represent beds available for occupancy at the<br />
facility on the month-end report date(s). Facility level information is<br />
available from September 30, 2002 onward.<br />
<strong>Long</strong>-<strong>Term</strong> <strong>Care</strong> Planning & Renewal Branch<br />
<strong>Utilization</strong> Management Report Package –December, 2006<br />
30
These reports are confidential and not for distribution<br />
OCCM<br />
Occupancy Monitoring database.<br />
Preferred<br />
Beds<br />
Total Preferred Beds available for occupancy, as of the month-end<br />
report date(s). Facility level information will be available from<br />
September 30, 2002 onward. Semi-Private and Private Beds are<br />
reported separately effective December 2002.<br />
Calculation: Preferred Beds = (Semi-Private Beds) + (Private Beds)<br />
Private Beds<br />
Beds of the Private bed type (as determined by comparative structural<br />
standards) in operation or available for occupancy, on the month-end<br />
report date(s). Facility level information is available from September<br />
30, 2002 onward.<br />
Rationalized<br />
Clients<br />
Waitlist<br />
Represents the total number of clients, not currently residing in a LTC<br />
bed (excluding Interim beds), should be considered as true demand<br />
for <strong>Long</strong> <strong>Term</strong> <strong>Care</strong> in a particular CCAC, discounted by the CCAC’s<br />
historical Waitlist Attrition % on the month-end report date(s). It is<br />
intended to represent the number of clients who would accept a bed<br />
offer, if all offers were made on the month-end date.<br />
Calculation: (Eligible Clients Waitlist x (1 – Waitlist Attrition))<br />
RHA<br />
Resident Home Area.<br />
Semi-Private<br />
Beds<br />
Number of beds of the Semi-Private bed type (as determined by<br />
comparative structural standards) in operation or available for<br />
occupancy, on the month-end report date(s).<br />
Supply<br />
Supply refers to the capacity, on the month-end report date(s),<br />
measured by the number of beds occupied or available for occupancy<br />
in <strong>Long</strong>-<strong>Term</strong> <strong>Care</strong> facilities at the facility level.<br />
<strong>Long</strong>-<strong>Term</strong> <strong>Care</strong> Planning & Renewal Branch<br />
<strong>Utilization</strong> Management Report Package –December, 2006<br />
31
These reports are confidential and not for distribution<br />
Supply Ratio<br />
The ratio of <strong>Long</strong>-<strong>Term</strong> <strong>Care</strong> beds per 1000 people of the population,<br />
over the age of 75. This ratio is provided by annual projections from<br />
Statistics Canada. (2001 Census Projections)<br />
Total Beds<br />
Total number of beds available for occupancy, as of the month-end<br />
report date(s). Temporary unavailability is not seen as a lapse in<br />
availability (minor refurbish, outbreak, etc.). Beds held in abeyance<br />
are not considered available. Beds designated for major<br />
refurbishment (D beds) will be assumed to be continuously available.<br />
Beds by Bed Type are available by Facility.<br />
Calculation:<br />
(Basic Beds) + (Semi-Private Beds) + (Private Beds) + (Interim Beds)<br />
Sources for this data include FMIS and the LTCRP MIS system (for<br />
new beds). Discrepancies are investigated and resolved.<br />
Total Demand<br />
Number of clients, residing in, or are eligible for, or eligible and<br />
waitlisted for placement in a <strong>Long</strong>-<strong>Term</strong> <strong>Care</strong> facility as of the monthend<br />
report date(s).<br />
<strong>Utilization</strong><br />
Percentage of <strong>Long</strong>-<strong>Term</strong> <strong>Care</strong> beds currently in use.<br />
Calculation: ((Total Beds) – (Total Vacancies)) / (Total Beds) * 100<br />
Vacancy<br />
Basic<br />
Number of available Basic beds reported as unoccupied by the CCAC<br />
on the month-end report date(s). NOTE: Facility level vacancies are<br />
available from September 30, 2002 onward.<br />
Vacancy<br />
Preferred<br />
Number of available Private and Semi-Private beds reported as<br />
unoccupied by the CCAC as of the month-end report date(s). NOTE:<br />
Facility level vacancies are available from September 30, 2002<br />
onward.<br />
<strong>Long</strong>-<strong>Term</strong> <strong>Care</strong> Planning & Renewal Branch<br />
<strong>Utilization</strong> Management Report Package –December, 2006<br />
32
These reports are confidential and not for distribution<br />
Vacancy Total<br />
Total number of available beds reported as unoccupied by the CCAC<br />
on the month-end report date(s). NOTE: Facility level information is<br />
available from September 30, 2002 onward.<br />
Waiting Acute<br />
<strong>Care</strong><br />
Applicants, whose current location is an acute care bed, and who are<br />
waiting for admission to a <strong>Long</strong>-<strong>Term</strong> <strong>Care</strong> facility.<br />
Waiting 1 st<br />
Choice<br />
Total clients, eligible for <strong>Long</strong>-<strong>Term</strong> <strong>Care</strong>, who are waiting to be<br />
accepted onto the waitlist of the clients’ preferred facility. (1 st choice)<br />
Waitlist<br />
Applications<br />
Withdrawn<br />
Number of eligible clients who withdrew their application for admission<br />
to a <strong>Long</strong>-<strong>Term</strong> <strong>Care</strong> facility for any reason apart from death, during<br />
the reporting period. This includes refusing bed offers, leading to<br />
automatic withdrawal. At the CCAC level, the client's file is closed.<br />
See Eligible Client Waitlist definition.<br />
Waitlist<br />
Attrition<br />
The total of waitlist withdrawals and waitlist deaths for the last six<br />
months calculated as a percentage of the total eligible waitlist for the<br />
same period.<br />
Waitlist Basic<br />
Eligible clients who are waitlisted for Basic beds, on the month-end<br />
report date(s).<br />
Waitlist<br />
Deaths<br />
Number of Eligible clients in the CCAC area who died during the<br />
reporting period before being placed in a <strong>Long</strong>-<strong>Term</strong> <strong>Care</strong> facility.<br />
Waitlist<br />
Preferred<br />
Eligible clients, waitlisted for Private or Semi-Private beds, on the<br />
month-end report date(s).<br />
Waitlisted 1 st<br />
Choice<br />
Total clients, eligible for <strong>Long</strong>-<strong>Term</strong> <strong>Care</strong> and accepted by the clients’<br />
facility of preference (1 st choice) as an eligible resident once a bed<br />
becomes vacant. The client is on a facility waitlist.<br />
<strong>Long</strong>-<strong>Term</strong> <strong>Care</strong> Planning & Renewal Branch<br />
<strong>Utilization</strong> Management Report Package –December, 2006<br />
33
These reports are confidential and not for distribution<br />
Waitlisted<br />
Clients<br />
Number of clients designated as eligible for LTC and waitlisted for their<br />
first choice facility for a particular CCAC on the month-end report<br />
date(s). This number will be greater than Eligible Clients Waitlist<br />
because it will include inter-facility transfers. This number is extracted<br />
from the Client Profiling Database (CPRO) using data compiled by<br />
CCAC’s.<br />
Waitlisted for<br />
LTC Facility<br />
Transfer<br />
Number of eligible clients who are waitlisted for a LTC facility in the<br />
same CCAC area and whose current location is a LTC facility on the<br />
month-end report date(s). This includes interim placements. Clients<br />
waiting for multiple facilities are only counted once.<br />
Additional Information<br />
If you have<br />
additional<br />
questions or<br />
require more<br />
information<br />
Please contact Greg Payne at:<br />
LTCRP.ISG@moh.gov.on.ca<br />
<strong>Long</strong>-<strong>Term</strong> <strong>Care</strong> Planning & Renewal Branch<br />
<strong>Utilization</strong> Management Report Package –December, 2006<br />
34