Microsoft PowerPoint - 1.45pm C Hartwell Presentation 05.05.2011.pdf
Microsoft PowerPoint - 1.45pm C Hartwell Presentation 05.05.2011.pdf
Microsoft PowerPoint - 1.45pm C Hartwell Presentation 05.05.2011.pdf

You also want an ePaper? Increase the reach of your titles
YUMPU automatically turns print PDFs into web optimized ePapers that Google loves.
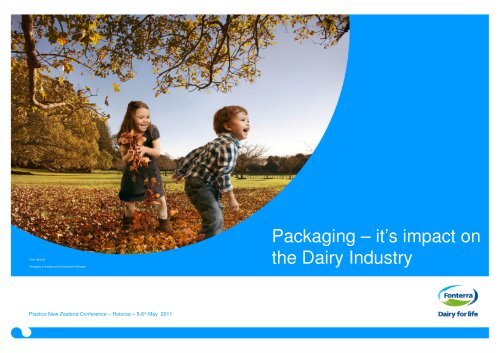
Chris <strong>Hartwell</strong><br />
Packaging Innovation and Development Manager<br />
Packaging – it’s impact on<br />
the Dairy Industry<br />
Plastics New Zealand Conference – Rotorua – 5-6 th May 2011
Scope of the presentation<br />
Food Sector Packaging<br />
• Global Food Retail Sector is worth some<br />
US$3 Trillion annually (excludes beverage)<br />
• Produced by some 2.6 billion farmers.<br />
• The Food Sector is one the world depends<br />
upon heavily<br />
• 70% of packaging is food related, and<br />
plastics are the largest food contact<br />
materials<br />
• But the world is changing and growing at a<br />
staggering pace<br />
Page 2
Chinese middle-class helps Fonterra set new export<br />
record<br />
• Wednesday 27th April 2011<br />
The world's biggest dairy exporter, Fonterra, says demand from aspiring middleclass<br />
consumers in Asia - particularly China - has underpinned recorded the<br />
cooperative's record level of monthly exports: 229,000 tonnes in March.<br />
"The real driver for the export record is the ongoing strong demand from China,<br />
South East Asia and the Middle East," said the company's managing director of<br />
trade and operations, Gary Romano.<br />
The record shipments were part of continued growth in global demand for high<br />
quality dairy products from New Zealand.<br />
"Our supply chain team were effectively closing the door on an export container<br />
every 2.6 minutes," Romano said. "That's equivalent to 560 containers a day".<br />
"We expect the record month will inject around $1.2 billion into the New Zealand<br />
economy," he said.<br />
The cooperative has indicated that a surplus of around $8/kg milksolids is likely to<br />
result in an average of $900,000 being available for each farmer: its current<br />
forecast range for the 2011 season is $7.90-$8.00kg milksolids (before retentions)<br />
to farmers, unchanged from the levels announced in late February.<br />
Page 3
Picture of Dairy Exports<br />
Page 4
Global Dairy Trade<br />
Page 5
Fonterra Global Trade Flows<br />
Source: AAG Center for Global Geography Education<br />
Page 6
New Zealand Exports<br />
New Zealand’s<br />
Top 10<br />
Exports<br />
(millions of<br />
NZ dollars)<br />
Dairy, eggs, and<br />
honey<br />
YE Dec 2009 YE Dec 2010<br />
8,115.92 10,413.93<br />
Meat 5,141.73 5,089.39<br />
Wood 2,318.94 2,948.96<br />
Mineral fuel and<br />
oil<br />
1,893.02 2,067.56<br />
Machinery 1,658.29 1,722.31<br />
Source: Statistics New Zealand<br />
NZ$19.5bn or 67%<br />
of New Zealand<br />
export revenue is<br />
food related<br />
Confidential<br />
items*<br />
Edible fruit and<br />
nuts<br />
1,374.90 1,635.10<br />
1,600.77 1,471.03<br />
Beverages 1,197.56 1,312.39<br />
Fish and seafood 1,262.08 1,307.06<br />
Aluminium 882.83 1,212.67<br />
Source: Statistics New Zealand via the World Trade Atlas.<br />
* Coal is likely to make up most of the confidential exports. Coal exports are classified as confidential by Statistics New Zealand.<br />
Page 7
Global Trend Analysis<br />
People trends<br />
Economic trends<br />
Tech trends<br />
Environmental trends<br />
Underlying Trends<br />
Underlying Trends<br />
Underlying Trends<br />
Underlying Trends<br />
• Healthcare spending<br />
• Changing age profiles<br />
• Urbanisation<br />
• Time compression<br />
• Migration/Ethnic Diversity<br />
• Trading up/down<br />
• Product safety concerns<br />
• Globalisation<br />
• Rise of Emerging powers<br />
• Consolidation<br />
-Channel<br />
-FMCG<br />
-Ingredient processing<br />
-Production<br />
• Technical advance of<br />
modern biotechnology<br />
• Computing/AI<br />
• Human genome project<br />
• Emerging technologies<br />
-Nano-technology<br />
-Smart devises<br />
-Advanced materials<br />
• Water Scarcity<br />
• Energy & power<br />
• Regulatory response to<br />
potential climate change<br />
Uncertainties<br />
Uncertainties<br />
Uncertainties<br />
Uncertainties<br />
• Organic/Natural/Ethical<br />
• Obesity and diet<br />
• Sports and Fitness<br />
• Wealth Disparities<br />
• Cost vs Convenience<br />
• Increased Government<br />
regulation of<br />
food/packaging<br />
• Leisure spending<br />
• Infrastructure blockage<br />
• E-trade<br />
• Off-shoring/outsourcing<br />
• Move from products to<br />
services<br />
• Islamic Finance<br />
• Neutraceuticals /<br />
Functional Foods<br />
• Consumer acceptance of<br />
GM<br />
• Consumer demand for<br />
sustainability<br />
• Climate change<br />
• Food scarcity (link to<br />
consumer acceptance of<br />
GM)<br />
• Food for energy<br />
Page 8<br />
Moody’s Investors Service is forecasting the market for Islamic financial products to surpass US$1 trillion this year. The market for Halal products<br />
is expected to exceed US $2.3 trillion this year
Global trend analysis – People Trends<br />
Urbanisation<br />
By 2015 the world will have 23<br />
mega cities, 19 of them in<br />
developing countries<br />
• 70% increase in food demand<br />
• 86% of consumers are in developing countries<br />
Source: UN<br />
Page 9
Global trend analysis – Economic influences<br />
• Globalisation<br />
– Simplification of the value chain to produce affordable products<br />
– Safe, affordable nutrition<br />
• Average Indian can spend double what he did in 1985<br />
• India is expected to be 5 th largest consumer market by<br />
2025<br />
• Middle class currently 50M people<br />
• By 2025 – 583M people or 41% of population will be<br />
middle class<br />
• Income will be 11x today<br />
Page 10
Global trend analysis – People Trends<br />
Healthcare spending/Changing age profiles<br />
– Total Global Population Growing<br />
– Life Expectancy Increase<br />
– Birth rate declining in developed countries<br />
– Unaffordable healthcare burden<br />
• Less Infant Formula demand<br />
• Package opening designed for elderly<br />
• Elderly more likely to recycle<br />
• Different spend habits<br />
• Labeling for elderly – smart communication technology<br />
• Food used for health benefits<br />
Requirements in<br />
developing countries<br />
are vastly different to<br />
those of developed<br />
countries<br />
Page 11<br />
Source: US Census Bureau
Global trend analysis – People Trends<br />
Sustainable/Organic/Local/Ethical<br />
– More of a concern in the developed world<br />
• Rise in Ethicurean -SOLE food<br />
• Bio materials, renewable materials<br />
• Low carbon footprint vs. renewable<br />
• Carbon footprint / Food miles<br />
• Environmental waste<br />
• Demand for less chemicals/additives<br />
• Ethical sourcing and manufacturing<br />
• Don’t compromise performance and<br />
must be at same cost<br />
• Low carbon foods –<br />
exclude meat and dairy<br />
from diet<br />
Page 12
Global trend analysis – People Trends<br />
Product Safety Concerns<br />
– More of a concern in the developing world • Cow to consumer traceability<br />
• Extending shelf-life<br />
• Demand for less chemicals/additives<br />
• Ambient distribution<br />
• Active packaging – biocides, colour, light<br />
blocker, scavengers<br />
• Improved barriers<br />
• Intelligent packaging – smart sensors<br />
- In-pack detection<br />
- Shelf life as function of quality not predetermined<br />
date<br />
• Chemical migration through packaging<br />
• Modeling of shelf life<br />
Page 13<br />
Packaging protects and<br />
preserves the product.<br />
Product preservation<br />
underpins our business
Consumer and Retailer demands<br />
• Food tastes and looks like it’s fresh<br />
– Low salt/low acid<br />
– No preservatives or chemicals<br />
– Low/no heat treatment<br />
– Available all year round<br />
– Food must be safe<br />
• Low supply chain costs<br />
– Ambient distribution<br />
– Longer shelf life<br />
– No damage/waste<br />
– Low cost to serve<br />
• Packaging seen as the “Magic Bullet” by<br />
manufacturers<br />
• Lobby groups see packaging as “the” major<br />
environmental problem<br />
Page 14<br />
Conflicting demands
Packaging has a bad image<br />
Consumer perception<br />
• Mountains of packaging<br />
• Biggest waste contributor<br />
– Visible litter<br />
• Not enough materials being recycled<br />
• Over-packaging is a major problem<br />
Facts<br />
• Amount of packaging used per person alters<br />
by 200% across developed world<br />
• Amount of packaging recovered exceeds the<br />
amount being recycled by approx 20%<br />
• Packaging is not our biggest waste problem<br />
Page 15
Packaging impact on the environment – A picture from<br />
the UK<br />
• Each UK household buys 3,000kg of products per year<br />
– Protected and contained by 200kg of packaging<br />
– Packaging is 18% of household waste<br />
– Household packaging waste is less than 1.5% of solid waste<br />
• 60% of packaging materials from all sources are recycled<br />
Household<br />
Household<br />
Landfill<br />
Page 16<br />
Source: Advisory Committee on<br />
Packaging – Packaging in<br />
Perspective
Packaging Reduction<br />
Waste items that continue to grow<br />
• Food<br />
• Magazines<br />
• Unsolicited Mail<br />
• Clothing<br />
Page 17
Impact of packaging over-under engineering<br />
Source:<br />
Page 18
UK Findings - WRAP<br />
1/3 rd of food brought is thrown away<br />
• 61% is avoidable<br />
• 19% unavoidable<br />
• 20% avoidable if prepared differently<br />
© copyright WRAP<br />
This equates to<br />
• Grapes (4.8 billion a year)<br />
• Potatoes (1.9 billion a year)<br />
• Apples (1.6 billion a year)<br />
• Slices of bread (2.6 billion a year)<br />
• Tomatoes (1 billion a year)<br />
• Bread rolls (775 million a year)<br />
• Yoghurts and yoghurt drinks (424 million a year)<br />
• Sausages (440 million a year)<br />
• Chocolate and sweets (259 million a year)<br />
• Rashers of bacon (200 million)<br />
• Meat-based meals – mainly ready meals and<br />
takeaways (120 million a year)<br />
Source - WRAP<br />
Page 19
Today’s Focus is often on impact of environmental<br />
issues<br />
Page 20
Global trend analysis – Environmental influences<br />
• Water Scarcity<br />
– 40% of the world will live in water-scarce regions by 2025<br />
– 70% of available fresh water is used for irrigation<br />
– 140 litres water for 1 cup coffee<br />
– 5000 litres of water for 1 litre bio-fuel • Increased consumer awareness of<br />
water use<br />
• Increased cost and lower availability /<br />
quality<br />
• Bio materials are large users of water<br />
- PLA<br />
- Paper production<br />
• Reduce water usage / recycle in<br />
factories<br />
Page 21
Global trend analysis – Environmental influences<br />
• Energy & power<br />
– Increased food to energy<br />
– Described as “A crime against humanity”<br />
– 34% of corn grown in USA in 2008 was for ethanol<br />
• 40% electricity used in Florida is for<br />
cooling – 15% in UK<br />
• Increase in oil costs is reflected in<br />
plastic resin costs<br />
• Increase in ethanol use pushes up<br />
PLA and food costs<br />
• Some renewable packaging<br />
sources often have worse over-all<br />
impact<br />
• Minimisation of materials<br />
irrespective of source<br />
Page 22
Packaging Function Reflects Market Segment<br />
Packaging Role<br />
Commodity<br />
Ingredient<br />
Food Service<br />
FMCG<br />
Product Safety √ √ √ √ √ √ √ √ √<br />
Product Protection √ √ √ √ √ √<br />
Shelf Life √ √ √ √ √ √<br />
Supply-chain Effectiveness √ √ √ √ √ √<br />
Environmental Impact √ √ √ √ √ √<br />
Economics √ √ √ √ √ √<br />
Convenience/Functionality √ √ √ √ √ √<br />
Communication √ √ √ √ √ √<br />
Commodity<br />
Ingredient – Cost<br />
and Quality; No<br />
choice (contracted supply)<br />
Food Service –<br />
Product Choice<br />
FMCG – Product<br />
and Brand choice<br />
Legislation √ √ √ √ √ √ √ √ √<br />
Shape and Design √ √ √ √ √ √<br />
Page 23<br />
√ - Not important<br />
√ √ - Some importance<br />
√ √ √ - Very important
Global trend analysis – Technological influences<br />
• Emerging technologies<br />
– Nano-technology<br />
– Smart devises<br />
• Nanochromic displays<br />
• Thermochromic inks<br />
• Smart supermarkets<br />
- smart trolleys<br />
- smart shelves<br />
• Smart labels<br />
- spoilage indicators<br />
- communication<br />
- shelf life indicator (temperature)<br />
• Tamper evidence<br />
• Counterfeiting – etched nano particles<br />
• Traceability<br />
- 2D/3D barcodes, RFID, single fibre<br />
• Conductive polymers<br />
- injection moulded electronics<br />
• Nano clays<br />
Page 24
Food Safety Concerns for Dairy producers<br />
• Pathogens (two levels apply for general population and infants, old,<br />
pregnant, immuno compromised)<br />
– Salmonella<br />
– Listeria monocytogenes<br />
– Coagulase positive staphylococcus aureus<br />
– Bacillus cereus (infant formula)<br />
– E-coli<br />
– Enterobacter sakazakii (infant formula, special medical purposes)<br />
Principle: Packaging<br />
should not be an<br />
innoculator of our food<br />
• Foreign Matter<br />
– Very wide range<br />
• Chemical migration from packaging or the storage environment<br />
– Will be covered in more detail<br />
Page 25<br />
Principle: Consumers<br />
don’t want your<br />
manufacturing plant<br />
Principle: Packaging<br />
should not leach<br />
unsafe levels of<br />
residues
Global trend analysis – People Trends<br />
Increased Government Regulation of Food and Packaging<br />
• Globally more people are concerned about food safety<br />
– Asia<br />
• Melamine in milk has been the key driver in packaging regulation updates<br />
• Food Safety is prompting a review of regulations globally<br />
• Packaging issues including<br />
- Phthalates<br />
- Acrylamide<br />
• Increase in monitoring<br />
– Additional resources<br />
– Improved limits of detection<br />
• More chemicals are being banned<br />
– e.g. BPA<br />
- ITX in Tetra Paks to Nestle<br />
- Azodicarbonamide in baby food<br />
- Benzophenone / 4-methylbenzophenone in<br />
cartonboard<br />
- Bisphenol A in baby food<br />
- Melamine<br />
- Mineral Oil<br />
• Major issue in the eyes of consumers which is driving regulators<br />
• Can become non-tariff barriers to trade<br />
• Becoming more costly to comply, increased focus on compliance, tighter regulations<br />
Page 26
Consumers - Chinese Packaging Regulation GB9685-2008<br />
Now includes<br />
-Leather protein<br />
-Nitrites<br />
Page 27
Market regulation of New Zealand’s $20bn Food Industry<br />
Countries with food contact plastics regulations<br />
Australasia – VCM, Acrylonitrile, Colourants. Comply USA or EU<br />
Canada – Food and Drug regulations Div 23<br />
China – Positive list GB9685 , resin, finished product testing<br />
USA – Chapter 21 parts 109 – 189, FCN, some finished product testing<br />
Europe – Positive list 10/2011, finished product testing, partial agreements,<br />
national legislation<br />
India – BIS standards for polymers, pigments, migration testing<br />
Indonesia –Similar to USA, 604 substances approved for food Contact.<br />
Solvents and pigments and heavy metals regulated<br />
Japan – Food Sanitation Law, resin and finished product testing,<br />
colourants, industry guidelines – JHOSPA, JHPA, JHAVC<br />
Korea – Similar to Japan<br />
Malaysia – PVC 1mg/kg, heavy metals<br />
Philippines – USA or Japan recognised<br />
Saudi Arabia – SASO standards for finished article, including inks exclusion<br />
list<br />
Singapore – PVC 0.05ppm<br />
Taiwan – Sanitation standards<br />
Thailand – Sanitation standards<br />
Venezuela – Global migration, resins, inks<br />
Vietnam – positive list, testing required for PE,PP,PET,PVC, colourants<br />
regulated<br />
Page 28
Food Recalls due to Chemical Contamination in Packaging -<br />
Europe<br />
Year<br />
No. Notifications<br />
Chemical<br />
No. Notifications<br />
Lowest level Reported<br />
2006<br />
3<br />
Phthalates<br />
79 400ppb<br />
2007<br />
12<br />
ITX 7 7ppb<br />
2008<br />
34<br />
Benzophenone/4-methyl<br />
benzophenone<br />
17 110ppb<br />
2009<br />
33<br />
Excess total migration<br />
8 23.8mg/dm2<br />
2010<br />
29<br />
ESBO<br />
11 3.7ppm<br />
2011<br />
13 YTD<br />
Majority of rejections of<br />
non-packaging FCMs –<br />
kitchen utensils from<br />
China<br />
Page 29<br />
Increasing surveillance
Summary<br />
• World Population<br />
– We will need to feed another 3 billion people by 2050<br />
• Packaging Industry size<br />
– 70% of packaging is used by the Food Industry<br />
– 67% of New Zealand Exports are Food and Beverage – NZ$19.5bn industry that rests on your shoulders<br />
• Food Safety<br />
– Food safety is paramount – pathogens, foreign matter and chemical migration from packaging<br />
– Food contact legislation is growing – how many markets are you either unaware of the regulations or non compliant<br />
• Supply chain<br />
– Smart technology to take complexity out for supply chain and deliver affordable nutrition to the consumer<br />
– Market growth for food will be in third world countries<br />
– Simplification of the value chain to produce affordable products<br />
• Packaging’s impact on society<br />
– Environmental impact – need for a balanced view<br />
– Good selling story<br />
Page 30
Amount of packaging for products used on a daily basis<br />
Source: Advisory Committee on<br />
Packaging – Packaging in Perspective<br />
Before you have that beer<br />
tonight look at how it’s<br />
packaged<br />
Page 31
Thank You