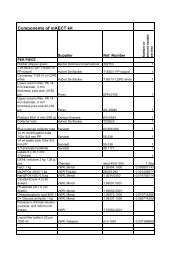
download pdf 1.2 Mb
download pdf 1.2 Mb
download pdf 1.2 Mb

Create successful ePaper yourself
Turn your PDF publications into a flip-book with our unique Google optimized e-Paper software.
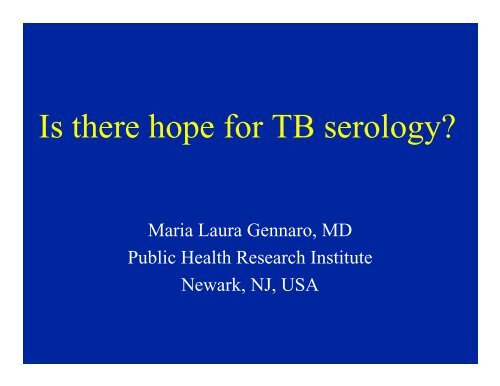
Is there hope for TB serology<br />
Maria Laura Gennaro, MD<br />
Public Health Research Institute<br />
Newark, NJ, USA
TB serology<br />
Highly desirable<br />
– rapid, simple, inexpensive, safe, non-invasive<br />
Difficult
The challenges of TB serodiagnosis<br />
A varied antibody response<br />
– not all patients with active TB have antibodies against the<br />
same antigens<br />
HIV coinfection<br />
– reduced anti-Mtb antibody titers<br />
“Confounding” states<br />
– Exposure to mycobacterial antigens<br />
– Natural history of M. tuberculosis infection
Exposure to mycobacterial antigens<br />
Non-TB mycobacterioses AVOID CROSS-REACTIVE AGs<br />
BCG vaccination<br />
SERONEGATIVE
Natural history of tuberculosis<br />
Infection<br />
Primary tuberculosis<br />
5%<br />
w/ HIV 40%<br />
Latent infection<br />
95%<br />
w/ HIV 60%<br />
Active disease<br />
5-10% lifetime<br />
w/ HIV 2%-10% yearly<br />
Lifelong containment<br />
95%<br />
Inactive tuberculosis<br />
treated/self-cured
Natural history of tuberculosis<br />
Latent infection<br />
Inactive TB<br />
SERONEGATIVE<br />
SEROPOSITIVE
Antibody responses in active TB and inactive (past) TB<br />
Mean OD450<br />
Mean OD450<br />
.5<br />
.4<br />
.3<br />
.2<br />
.1<br />
0.0<br />
38kDa Antigen<br />
TB Status<br />
Act TB Inact TB TST+ TSTp<br />
< 0.05<br />
active TB inactive TB tst-neg tst-pos<br />
Latently infected (TST + ) and non-infected (TST - ) groups<br />
were serologically indistinguishable (p > 0.5)<br />
Active TB was associated with greater reactivity to the<br />
38 kDa antigen than any other group<br />
Inactive TB was associated with greater reactivity to<br />
ESAT-6 and 16 kDa antigen than any other group<br />
.30<br />
.25<br />
ESAT-6 Antigen<br />
p < 0.001<br />
.16<br />
.14<br />
16kDa 14 kDa Antigen<br />
p < 0.001<br />
.12<br />
Mean OD450<br />
Mean OD450<br />
.20<br />
.15<br />
.10<br />
Mean OD450<br />
Mean OD450<br />
.10<br />
.08<br />
.06<br />
.04<br />
.05<br />
.02<br />
0.00<br />
active TB inactive TB tst-neg tst-pos<br />
Act TB Inact TB TST+ TST-<br />
TB status<br />
0.00<br />
active TB inactive TB tst-neg tst-pos<br />
Act TB Inact TB TST+ TST-<br />
TB status
A bar-code<br />
Inactive TB<br />
Active TB<br />
38kDa Ag<br />
AlaDH<br />
ESAT-6<br />
Rv2626c<br />
16kDa Ag<br />
0 0.2 0.4 0.6 0.8 1<br />
ORi/(ORi+ORa) x 100
Since<br />
Latent infection is seronegative<br />
Active TB can be distinguished from<br />
inactive TB<br />
There is hope for TB serology
The evolution of TB serodiagnostic tests<br />
Single antigen tests<br />
One antigen fits all!<br />
Multi-antigen tests<br />
Multiple, positive markers<br />
Bar-codes<br />
Multiple, positive and<br />
negative markers
How do we identify the<br />
antibody profiles specific for<br />
each TB state
The genome<br />
A high throughput approach<br />
PCR fragments with<br />
5Õ& 3ÕŅadapterÓsequences<br />
No Purification Required<br />
Day 1<br />
Mix linear vector with PCR<br />
fragments and transform E. coli<br />
Overnight Culture<br />
No Colony Selection Required<br />
MiniPrep Plasmid<br />
Day 2<br />
In vitro<br />
Transcription &Translation<br />
No Purification Required<br />
The proteome on a chip<br />
Microarray Chip Printing<br />
Probed microarrays<br />
Naive Immunized<br />
Day 3<br />
Mouse
Course of the antibody response in BalbC mice<br />
infected with M. tuberculosis<br />
Time 0<br />
1400<br />
1200<br />
1000<br />
800<br />
600<br />
400<br />
200<br />
0<br />
0 2 4 6 8 10 12<br />
weeks<br />
[(I antigen -I control )/(I antigen,t=0 -I control,t=0 )]<br />
900 TB protein microarray
Course of the antibody response in BalbC mice<br />
infected with M. tuberculosis<br />
Time 2 weeks<br />
1400<br />
1200<br />
1000<br />
800<br />
600<br />
400<br />
200<br />
0<br />
0 2 4 6 8 10 12<br />
weeks<br />
[(I antigen -I control )/(I antigen,t=0 -I control,t=0 )]<br />
900 TB protein microarray
Course of the antibody response in BalbC mice<br />
infected with M. tuberculosis<br />
Time 5 weeks<br />
1400<br />
1200<br />
1000<br />
800<br />
600<br />
400<br />
200<br />
0<br />
0 2 4 6 8 10 12<br />
weeks<br />
[(I antigen -I control )/(I antigen,t=0 -I control,t=0 )]<br />
900 TB protein microarray
Course of the antibody response in BalbC mice<br />
infected with M. tuberculosis<br />
Time 7 weeks<br />
1400<br />
1200<br />
1000<br />
800<br />
600<br />
400<br />
200<br />
0<br />
0 2 4 6 8 10 12<br />
weeks<br />
[(I antigen -I control )/(I antigen,t=0 -I control,t=0 )]<br />
900 TB protein microarray
Course of the antibody response in BalbC mice<br />
infected with M. tuberculosis<br />
Time 11 weeks<br />
1400<br />
1200<br />
1000<br />
800<br />
600<br />
400<br />
200<br />
0<br />
0 2 4 6 8 10 12<br />
weeks<br />
[(I antigen -I control )/(I antigen,t=0 -I control,t=0 )]<br />
900 TB protein microarray
(1)<br />
top<br />
(2)<br />
(3)<br />
Hierarchical clustering<br />
of data collected with<br />
serial mouse sera<br />
bottom
Close-up on hierarchical tree showing the two top clusters<br />
cluster 1 -- 2 proteins<br />
naive1<br />
naive2<br />
2wk1<br />
2wk2<br />
5wk1<br />
5wk2<br />
7wk1<br />
7wk2<br />
11wk1<br />
11wk2<br />
2<br />
1<br />
0<br />
-1<br />
-2<br />
-3<br />
-4<br />
-5<br />
-6<br />
infection time points<br />
cluster 2 -- 5 proteins<br />
naive1<br />
naive2<br />
2wk1<br />
2wk2<br />
5wk1<br />
5wk2<br />
7wk1<br />
7wk2<br />
11wk1<br />
11wk2<br />
4<br />
3<br />
2<br />
1<br />
0<br />
-1<br />
-2<br />
-3<br />
-4<br />
infection time points
4 additional clusters (559 protein total) showing<br />
increased antibody production by 2 weeks post-infection<br />
cluster 3 -- 242 protein<br />
cluster 6 -- 49 protein<br />
C3<br />
3<br />
2<br />
1<br />
3<br />
2<br />
1<br />
0<br />
-1<br />
naive1 naive2 2wk1 2wk2 5wk1 5wk2 7wk1 7wk2 11wk1 11wk2<br />
0<br />
-1<br />
naive1 naive2 2wk1 2wk2 5wk1 5wk2 7wk1 7wk2 11wk1 11wk2<br />
-2<br />
-2<br />
-3<br />
infection time point<br />
-3<br />
infection time point<br />
cluster 7 -- 42 protein<br />
cluster 8 -- 226 protein<br />
C6<br />
3<br />
2<br />
3<br />
2<br />
C7<br />
1<br />
0<br />
-1<br />
naive1 naive2 2wk1 2wk2 5wk1 5wk2 7wk1 7wk2 11wk1 11wk2<br />
1<br />
0<br />
-1<br />
naive1 naive2 2wk1 2wk2 5wk1 5wk2 7wk1 7wk2 11wk1 11wk2<br />
-2<br />
-2<br />
C8<br />
-3<br />
infection time point<br />
-3<br />
infection time point
Conclusions<br />
A comprehensive antibody profiling of M.<br />
tuberculosis infection needs to be developed<br />
to define a diagnostic bar-code for active TB<br />
High-throughput methods for whole<br />
proteome screens are available
There is most definitely hope<br />
for TB serology
Acknowledgements<br />
Gennaro Lab<br />
– Lanbo Shi<br />
– Shajo Kunnath<br />
– Ganga Kanaujia<br />
– PierNatale Brusasca<br />
– Yanis BenAmor<br />
– XuDong Guo<br />
– Konstantin Lyashchenko<br />
– Roberto Colangeli<br />
– Claudia Manca<br />
Experimental TB<br />
– Bob North (Trudeau Institute)<br />
– Padmini Salgame (UMDNJ)<br />
Human TB<br />
– Dick Menzies (McGill U.)<br />
– Amy Davidow (UMDNJ)<br />
– Lee Reichmann (UMDNJ)<br />
– Mahmoud Affouf (Kean College)<br />
Protein chip microarray<br />
– Phil Felgner (UC Irvine)

![Download in English [pdf 2Mb] - Foundation for Innovative New ...](https://img.yumpu.com/49580359/1/184x260/download-in-english-pdf-2mb-foundation-for-innovative-new-.jpg?quality=85)

![New laboratory diagnostic tools for tuberculosis control [.pdf]](https://img.yumpu.com/43339906/1/190x135/new-laboratory-diagnostic-tools-for-tuberculosis-control-pdf.jpg?quality=85)