PHY406-Lab#4-1D Motion - DrJJ - UiTM
PHY406-Lab#4-1D Motion - DrJJ - UiTM
PHY406-Lab#4-1D Motion - DrJJ - UiTM

You also want an ePaper? Increase the reach of your titles
YUMPU automatically turns print PDFs into web optimized ePapers that Google loves.
Material Tech/Food Tech/Textile Tech <strong>PHY406</strong> Lab #3<br />
Universiti Teknologi MARA<br />
Fakulti Sains Gunaan<br />
Kinematics: Describing Non-Accelerated and<br />
Accelerated One-Dimensional <strong>Motion</strong><br />
<strong>PHY406</strong>: A Physical Science Activity<br />
Name:____________________________ HP: ____________________ Lab # 4:<br />
The goal of today’s activity is to further explore and describe the nature of one-dimensional<br />
horizontal motion pictorially, textually, graphically and mathematically when an object is<br />
moving after an instantaneous push and when the object is moving with a constant<br />
continuous push.<br />
At the end of the activity, students will be able to:<br />
1. Discuss the planned investigation methods, including the physical quantities<br />
investigated and manipulated and the devices chosen to perform the investigations<br />
on observing the one-dimensional instantaneous push and the motion with a<br />
constant continuous push.<br />
2. Draw and compare pictorial representations of motion along the x-axis after<br />
observing an object moving along the horizontal when given an instantaneous push<br />
and when experiencing a constant continuous push.<br />
3. Describe, verbally and in writing, the motions shown by the pictorial representation.<br />
4. Organize the collected data (perhaps by tabulating the data) and use MS EXCEL to<br />
construct graphs of position vs. time, velocity vs. time and acceleration vs. time.<br />
5. Describe the features of the graph, the indirect quantities derived from the graph and<br />
the inferred relationship deduced from it.<br />
6. Compare and contrast the acceleration vs. time graph, the velocity vs. time graph<br />
and the position vs. time graph for a non-accelerating and for a constant acceleration<br />
horizontal motion.<br />
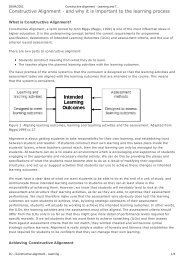
Background Information<br />
<strong>Motion</strong> in one-dimension along the horizontal can be described pictorially, verbally (in<br />
words), graphically and mathematically. In fact, given any one of the representations, you<br />
must be able to describe the motion of the object by using any or all of the other three<br />
descriptions. Graphs and mathematical representations are often used by scientists and<br />
physicists because they are elegant, concise and compact ways for describing motion.<br />
In lab #3, you had to visually inspect the position of the glider to measure its position as the<br />
glider was moving. How certain were you in locating its position at a particular clock reading<br />
(such as at clock reading 2 seconds) especially when the glider was moving faster and<br />
faster Can you be certain of its position to within 5 cm How much error did you make<br />
when you determined the speed from the position vs. time graph that you constructed<br />
Physics and all other sciences rely a lot on minimizing uncertainties and errors when<br />
conducting investigations. Your activities in lab #2 had introduced you to the significance of<br />
making multiple measurements and finding an average value from those multiple<br />
measurements. The activities guide you to minimize the errors and improve on the accuracy<br />
of values that you report. The smaller the uncertainty, the more accurate and trustworthiness<br />
Created on 8/15/2010 10:15:00 PMby Dr. JJ, FSG, <strong>UiTM</strong> Shah<br />
Alam<br />
Page 1 of 12 Last updated 8/16/2010
Material Tech/Food Tech/Textile Tech <strong>PHY406</strong> Lab #3<br />
your result and conclusion will be. Hence, in today’s activity, you will be minimizing those<br />
uncertainties by using ticker-timer and ticker tapes.<br />
Today, in addition to causing the glider to move with an instant push like you did in lab #3,<br />
you will also make the glider move by exerting a constant continuous push produced by a<br />
fan. In both activities, you will be using the ticker timer and ticker tape which is attached to<br />
the glider to record the positions of the glider at every instant of 0.02 seconds. On the ticker<br />
tape you will be marking off and label the glider’s position. You will then use the positions<br />
indicated on the ticker tape to draw a position vs. time graph, obtain the instantaneous<br />
velocities of the glider and construct an instantaneous velocity vs. time graph. For the case<br />
where the glider is given a constant push by a fan attached to it, you will be repeating the<br />
same activity as before. Additionally, you also determine the instantaneous acceleration and<br />
then construct the acceleration vs. time graph.<br />
The velocity vs. time graph will allow you to determine the distance travelled by an object for<br />
a certain time interval or for an entire motion while the acceleration vs. time graph will reveal<br />
the velocities of an object during the same motion.<br />
Created on 8/15/2010 10:15:00 PMby Dr. JJ, FSG, <strong>UiTM</strong> Shah<br />
Alam<br />
Page 2 of 12 Last updated 8/16/2010
Material Tech/Food Tech/Textile Tech <strong>PHY406</strong> Lab #3<br />
STUDENT ACTIVITIES<br />
INVESTIGATION 1-PICTORIAL REPRESENTATION OF A GLIDER ON A FRICTIONLESS<br />
AIR TRACK<br />
This activity will let you locate and draw the center of a glider as it glides on a frictionless air<br />
track after being given a push. You will be connecting the glider to a ticker tape and push the<br />
glider to make it move.<br />
Activity 1:<br />
Materials:<br />
Air track with gliders and its accessories (ticker timer and ticker tapes.)<br />
Prediction 1:<br />
Predict and draw a picture of the dots that you will observe on the ticker tape after the glider<br />
had been instantaneously pushed.<br />
Predicted picture of dots on ticker tape<br />
1.1.0 METHOD<br />
This activity is best done in groups of 3 or 4.<br />
Plan and discuss your investigation procedure with your group members. Identify the<br />
variables (quantities) that you are measuring and that you keep constant. Jot down all<br />
the information that you had discussed. Discuss how you will present the data and how<br />
you will construct graphs associated with the data. You and your group members will<br />
verbally report your procedure to the lab instructor before you proceed with the<br />
investigation.<br />
You will need to adjust the screws underneath the air track to ensure it is leveled. Be<br />
sure to test that it is leveled before beginning your investigation.<br />
Do a trial run of your investigation. When everyone in the group is comfortable that your<br />
procedure is workable, proceed with the investigation.<br />
Remember to repeat your investigation at least once.<br />
Created on 8/15/2010 10:15:00 PMby Dr. JJ, FSG, <strong>UiTM</strong> Shah<br />
Alam<br />
Page 3 of 12 Last updated 8/16/2010
Material Tech/Food Tech/Textile Tech <strong>PHY406</strong> Lab #3<br />
1.1.1 DATA<br />
Draw the positions of the glider or affix (glue) the ticker tape on this table.<br />
Trial #1<br />
Picture of dots on ticker tape<br />
Trial #2<br />
Record your data from the ticker tape in a table below and in MS EXCEL. Label the first dot<br />
you chose as dot #1 and assign the position at this dot as x = 0 cm. An example of the table<br />
is shown below.<br />
Table 1.1: Distance the glider travel, its instantaneous speed and instantaneous<br />
acceleration<br />
A B C D E F<br />
2 Dots Position Distance ∆ t Instantaneous Instantaneous<br />
(cm) ( ∆ x = x n +1<br />
− xn<br />
s speed, acceleration,<br />
Eg: ∆ x = x 2<br />
− x1<br />
)<br />
v = ∆x<br />
∆v<br />
vn+1<br />
− v<br />
∆t<br />
a = =<br />
(cm)<br />
∆t<br />
∆t<br />
(cm/s)<br />
3 1 0.02<br />
4 2 0.02<br />
5 3 0.02<br />
6 4 0.02<br />
7 5 0.02<br />
8 6 0.02<br />
9 7 0.02<br />
10 8 0.02<br />
11 9 0.02<br />
12 10 0.02<br />
13 11 0.02<br />
The gray zones in Table 1.1 are the rows and columns indicated in your spreadsheet.<br />
1.1.2 RESULTS<br />
CALCULATION USING SPREADSHEET<br />
Created on 8/15/2010 10:15:00 PMby Dr. JJ, FSG, <strong>UiTM</strong> Shah<br />
Alam<br />
(cm/s 2 )<br />
a. Open a new file in the MS EXCEL spreadsheet.<br />
b. Key in your data beginning from line 2 and column A. In other words, write the labeling<br />
numbers in cell A2. Then just fill in the rest of your information from the TABLE 1.1 in the<br />
adjacent cells.<br />
c. Your spreadsheet data for ∆ x , v , and a for the event should be located in cells C3, E3<br />
and F3 respectively.<br />
d. You will now calculate the ∆ x , v , and a respectively<br />
To determine position change, ∆ x : In cell C3, type =B4-B3.<br />
Page 4 of 12 Last updated 8/16/2010<br />
n
Material Tech/Food Tech/Textile Tech <strong>PHY406</strong> Lab #3<br />
To determine the instantaneous speed, v : In cell E3, type =C3/D3.<br />
To determine the instantaneous acceleration, a : In cell F3, type =(E4-E3)/D3<br />
Then you can just copy the content of cell C3:F3 to the lower cells C4 through<br />
F11.<br />
e. SAVE your file with a file name, yourname-exp4-phy406-datecreated. For example, drjjexp4-phy406-160810.<br />
GRAPHING & ANALYZING THE ONE-DIMENSIONAL HORIZONTAL MOTION<br />
Use the same file to construct graphs of position vs. time, velocity vs. time and<br />
acceleration vs. time.<br />
<br />
Describe the graphs you constructed. Then discuss the similarities and the differences<br />
between the graphs. What relevant facts and information can you extract from the<br />
velocity and acceleration graphs respectively<br />
Created on 8/15/2010 10:15:00 PMby Dr. JJ, FSG, <strong>UiTM</strong> Shah<br />
Alam<br />
Page 5 of 12 Last updated 8/16/2010
Material Tech/Food Tech/Textile Tech <strong>PHY406</strong> Lab #3<br />
Activity 2:<br />
In this activity, you will repeat what you did in Activity 1 but this time you will explore the onedimensional<br />
horizontal motion where the glider is continuously pushed by a fan attached to<br />
it.<br />
Materials:<br />
Air track with gliders and its accessories (fan attachments, ticker timer and ticker tapes.)<br />
Prediction 2:<br />
Predict and draw a picture of the dots that you will observe on the ticker tape when the glider<br />
is continuously pushed.<br />
Predicted picture of dots on ticker tape<br />
2.1.0 METHOD<br />
This activity is best done in groups of 3 or 4.<br />
Plan and discuss your investigation procedure with your group members. Identify the<br />
variables (quantities) that you are measuring and that you keep constant. Jot down all<br />
the information that you had discussed. Discuss how you will present the data and how<br />
you will construct graphs associated with the data. You and your group members will<br />
verbally report your procedure to the lab instructor before you proceed with the<br />
investigation.<br />
You will need to adjust the screws underneath the air track to ensure it is leveled. Be<br />
sure to test that it is leveled before beginning your investigation.<br />
Do a trial run of your investigation. When everyone in the group is comfortable that your<br />
procedure is workable, proceed with the investigation.<br />
Remember to repeat your investigation at least once.<br />
2.1.1 DATA<br />
Draw the positions of the glider or affix (glue) the ticker tape on this table.<br />
Trial #1<br />
Picture of dots on ticker tape<br />
Trial #2<br />
Created on 8/15/2010 10:15:00 PMby Dr. JJ, FSG, <strong>UiTM</strong> Shah<br />
Alam<br />
Page 6 of 12 Last updated 8/16/2010
Material Tech/Food Tech/Textile Tech <strong>PHY406</strong> Lab #3<br />
Record your data from the ticker tape in a table below and in MS EXCEL. Label the first dot<br />
you chose as dot #1 and assign the position at this dot as x = 0 cm. An example of the table<br />
is shown below.<br />
Table 2.1: Distance the glider travel, its instantaneous speed and instantaneous<br />
acceleration<br />
A B C D E F<br />
2 Dots Position Distance ∆ t Instantaneous Instantaneous<br />
(cm) ( ∆ x = x n +1<br />
− xn<br />
s speed, acceleration,<br />
Eg: ∆ x = x 2<br />
− x1<br />
)<br />
v = ∆x<br />
∆v<br />
vn+1<br />
− v<br />
∆t<br />
a = =<br />
(cm)<br />
∆t<br />
∆t<br />
(cm/s)<br />
3 1 0.02<br />
4 2 0.02<br />
5 3 0.02<br />
6 4 0.02<br />
7 5 0.02<br />
8 6 0.02<br />
9 7 0.02<br />
10 8 0.02<br />
11 9 0.02<br />
12 10 0.02<br />
13 11 0.02<br />
The gray zones in Table 1.1 are the rows and columns indicated in your spreadsheet.<br />
2.1.2 RESULTS<br />
CALCULATION USING SPREADSHEET<br />
(cm/s 2 )<br />
a. Use Sheet 2 of the same file in Activity 1.<br />
b. Key in your data beginning from line 2 and column A. In other words, write the labeling<br />
numbers in cell A2. Then just fill in the rest of your information from the TABLE 1.1 in the<br />
adjacent cells.<br />
c. Your spreadsheet data for ∆ x , v , and a for the event should be located in cells C3, E3<br />
and F3 respectively.<br />
d. You will now calculate the ∆ x , v , and a respectively<br />
e. To determine position change, ∆ x : In cell C3, type =B4-B3.<br />
f. To determine the instantaneous speed, v : In cell E3, type =C3/D3.<br />
g. To determine the instantaneous acceleration, a : In cell F3, type =(E4-E3)/D3<br />
h. Then you can just copy the content of cell C3:F3 to the lower cells C4 through F11.<br />
i. SAVE your file with a file name, yourname-exp4-phy406-datecreated. For example, drjjexp4-phy406-160810.<br />
n<br />
Created on 8/15/2010 10:15:00 PMby Dr. JJ, FSG, <strong>UiTM</strong> Shah<br />
Alam<br />
Page 7 of 12 Last updated 8/16/2010
Material Tech/Food Tech/Textile Tech <strong>PHY406</strong> Lab #3<br />
GRAPHING & ANALYZING THE ONE-DIMENSIONAL HORIZONTAL MOTION<br />
Construct graphs of position vs. time, velocity vs. time and acceleration vs. time.<br />
Created on 8/15/2010 10:15:00 PMby Dr. JJ, FSG, <strong>UiTM</strong> Shah<br />
Alam<br />
Page 8 of 12 Last updated 8/16/2010
Material Tech/Food Tech/Textile Tech <strong>PHY406</strong> Lab #3<br />
Describe the graphs that you constructed.<br />
Then discuss the similarities and the differences between the graphs. What relevant<br />
facts and information can you extract from the velocity and acceleration graphs<br />
respectively (Try determining areas of the graph. Remember to include the units.)<br />
How similar or different are these graphs than those in Activity 1 Explain.<br />
Created on 8/15/2010 10:15:00 PMby Dr. JJ, FSG, <strong>UiTM</strong> Shah<br />
Alam<br />
Page 9 of 12 Last updated 8/16/2010
Material Tech/Food Tech/Textile Tech <strong>PHY406</strong> Lab #3<br />
INVESTIGATION 2-DESCRIBING POSITION, VELOCITY AND ACCELERATION WITH<br />
WORDS AND GRAPHS<br />
This section will allow you to describe velocity of an object using words and graph.<br />
Activity 2: PHeT Activities<br />
You will need to obtain the Java applets from the Colorado University by visiting the<br />
following website:http://phet.colorado.edu/en/simulation/moving-man<br />
You will then be prompted to Download or Run Now. Choose the Run Now and you will be<br />
asked to save the following file: moving-man_en.jnlp. Save it to a folder on your desktop or<br />
anywhere on your hard drive. (Place it in the <strong>PHY406</strong> folder in a subfolder called PHeT. If<br />
the subfolder has not been created, then create it.). Be sure that your laptop had already<br />
been installed with Java.<br />
Case 1: Man moving to the left and to the right<br />
Explore the activities by moving the man left or right until x = ±0. 8 m. You can imagine<br />
the man to be you.<br />
Draw the position-time, velocity-time and acceleration time graphs using the same time<br />
axis on the x axis.<br />
Describe how the velocity and acceleration graph changes as you move to the right and<br />
then to the left.<br />
Created on 8/15/2010 10:15:00 PMby Dr. JJ, FSG, <strong>UiTM</strong> Shah<br />
Alam<br />
Page 10 of 12 Last updated 8/16/2010
Material Tech/Food Tech/Textile Tech <strong>PHY406</strong> Lab #3<br />
Case 2: Constant Velocity<br />
Explore the activities by setting the man to move at a constant speed, both positive and<br />
negative. (Try v = ±0. 5 , v = ±1. 0 . Stop the motion when you reach the position<br />
x = ±8 m. Make sure you go back to x = 0 m and reset the graphs before you begin with<br />
a new motion.<br />
Draw the position-time, velocity-time and acceleration time graphs using the same time<br />
axis on the x axis.<br />
Describe how the position vs. time and acceleration vs. time graph change. Is it similar to<br />
the graph you constructed in Activity 1 and Activity 2 Describe the similarities and<br />
differences.<br />
Created on 8/15/2010 10:15:00 PMby Dr. JJ, FSG, <strong>UiTM</strong> Shah<br />
Alam<br />
Page 11 of 12 Last updated 8/16/2010
Material Tech/Food Tech/Textile Tech <strong>PHY406</strong> Lab #3<br />
Case 3: Constant Acceleration<br />
Explore the activities by setting the man to move at a constant acceleration, both positive<br />
and negative. (Try a = ±0. 4 m/s 2 , a = ±0. 8 m/s 2 . Stop the motion when you reach the<br />
position x = ± 8 m. Make sure you go back to x = 0 m and reset the graphs before you<br />
begin with a new motion.<br />
Draw the position-time, velocity-time and acceleration time graphs using the same time<br />
axis on the x axis.<br />
Describe how the position vs. time and velocity vs. time graph change Is it similar to the<br />
graph you constructed in Activity 1 and Activity 2 Describe the similarities and<br />
differences.<br />
Suggest possible mathematical relationships that exist between position, clock readings,<br />
instantaneous velocity and instantaneous acceleration for non-accelerated motion and<br />
accelerated motion in one dimension. Explain your suggestion.<br />
Created on 8/15/2010 10:15:00 PMby Dr. JJ, FSG, <strong>UiTM</strong> Shah<br />
Alam<br />
Page 12 of 12 Last updated 8/16/2010