(PIVA) and Visual Dyslexia - Adlandia
(PIVA) and Visual Dyslexia - Adlandia
(PIVA) and Visual Dyslexia - Adlandia

Create successful ePaper yourself
Turn your PDF publications into a flip-book with our unique Google optimized e-Paper software.
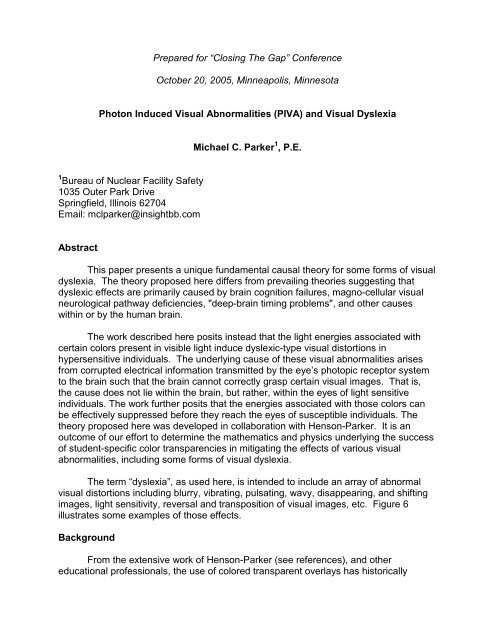
Prepared for “Closing The Gap” Conference<br />
October 20, 2005, Minneapolis, Minnesota<br />
Photon Induced <strong>Visual</strong> Abnormalities (<strong>PIVA</strong>) <strong>and</strong> <strong>Visual</strong> <strong>Dyslexia</strong><br />
Michael C. Parker 1 , P.E.<br />
1 Bureau of Nuclear Facility Safety<br />
1035 Outer Park Drive<br />
Springfield, Illinois 62704<br />
Email: mclparker@insightbb.com<br />
Abstract<br />
This paper presents a unique fundamental causal theory for some forms of visual<br />
dyslexia. The theory proposed here differs from prevailing theories suggesting that<br />
dyslexic effects are primarily caused by brain cognition failures, magno-cellular visual<br />
neurological pathway deficiencies, "deep-brain timing problems", <strong>and</strong> other causes<br />
within or by the human brain.<br />
The work described here posits instead that the light energies associated with<br />
certain colors present in visible light induce dyslexic-type visual distortions in<br />
hypersensitive individuals. The underlying cause of these visual abnormalities arises<br />
from corrupted electrical information transmitted by the eye’s photopic receptor system<br />
to the brain such that the brain cannot correctly grasp certain visual images. That is,<br />
the cause does not lie within the brain, but rather, within the eyes of light sensitive<br />
individuals. The work further posits that the energies associated with those colors can<br />
be effectively suppressed before they reach the eyes of susceptible individuals. The<br />
theory proposed here was developed in collaboration with Henson-Parker. It is an<br />
outcome of our effort to determine the mathematics <strong>and</strong> physics underlying the success<br />
of student-specific color transparencies in mitigating the effects of various visual<br />
abnormalities, including some forms of visual dyslexia.<br />
The term “dyslexia”, as used here, is intended to include an array of abnormal<br />
visual distortions including blurry, vibrating, pulsating, wavy, disappearing, <strong>and</strong> shifting<br />
images, light sensitivity, reversal <strong>and</strong> transposition of visual images, etc. Figure 6<br />
illustrates some examples of those effects.<br />
Background<br />
From the extensive work of Henson-Parker (see references), <strong>and</strong> other<br />
educational professionals, the use of colored transparent overlays has historically
demonstrated dramatic therapeutic results in some individuals who suffer from dyslexia<br />
<strong>and</strong> other visual abnormalities. The theory proposed here was developed in<br />
collaboration with Henson-Parker. It is an outcome of our effort to determine the<br />
mathematics <strong>and</strong> physics underlying the success of student-specific color<br />
transparencies in mitigating the effects of various visual abnormalities, including, some<br />
forms of visual dyslexia. In selecting the research approach for this work, we began at<br />
the premise that the successful outcomes observed by educational professionals are<br />
axiomatic.<br />
To date, there has not been a physical theory that explains why or how studentspecific<br />
color transparencies mitigate dyslexic effects. The author believes that<br />
absence of such a theory has been central to failures in achieving therapeutic <strong>and</strong><br />
research consensus within the medical <strong>and</strong> educational research communities.<br />
This work was undertaken in the sincere hope that it will benefit educational,<br />
medical, <strong>and</strong> other technical professionals <strong>and</strong> will prompt further research into<br />
development of testing <strong>and</strong> corrective strategies for children <strong>and</strong> adults with visual<br />
learning disabilities arising from what is termed here as the <strong>PIVA</strong> Effect.<br />
<strong>PIVA</strong> Effect<br />
The Electromagnetic (EM) Spectrum is a term used to classify radiation with the<br />
property of traveling waves comprised of an electrical <strong>and</strong> a magnetic field component.<br />
Figure 1<br />
Electromagnetic Spectrum<br />
Observe that Figure 1 rather arbitrarily begins on the left with AM Radio<br />
frequencies <strong>and</strong> ends on the right with Gamma Rays. In fact, the physical EM spectrum<br />
is continuous over a much larger range of frequencies. Here, however, our interest is in<br />
that portion of the spectrum known as “Visible Light”.<br />
From Figure 1, visible light is depicted within the range of 10 14 to 10 15 Hertz (Hz).<br />
The human visual system is generally classified to be sensitive in the range sub-set of<br />
385 to 790 Tera Hertz (THz), although some individuals may be able to “perceive”<br />
2
visible light slightly above or below that estimate. EM radiation is generally accepted to<br />
be comprised of photons. A photon can be visualized as a particle of EM radiation, or,<br />
for our purpose here, particles of visible light comprised of different colors. Photons<br />
have important properties for our discussion. The <strong>PIVA</strong> Effect, introduced by this work,<br />
posits that specific photon energies induce, within the eye’s photoreceptors, the<br />
conditions that create the visual abnormalities experienced by dyslexic patients.<br />
In the author’s view, progress in developing corrective strategies for the <strong>PIVA</strong><br />
effect have, among other causes, been stifled by thinking of visible light in terms of its<br />
wavelength. Wavelength is not a true fundamental property of visible light. Wavelength<br />
is a derivative property of light, which is to say, that wavelength is derived from explicit<br />
knowledge of the speed of light in the medium in which it is traveling (e.g., vacuum, air,<br />
cornea, vitreous humor, etc.) <strong>and</strong> the associated refractive index of that medium. For<br />
instance, 600nm wavelength light entering the eye (perceived as orange in air)<br />
becomes approximately 436nm wavelength light (perceived as indigo in air) at the<br />
Fovea due to refractive index effects within the eye. What are inherent properties of EM<br />
radiation (including visible light) is frequency <strong>and</strong> that light is comprised of quantum<br />
particles known as photons. The specific photon energy associated with light’s<br />
quantum particles is the product of the photon frequency <strong>and</strong> a universal constant<br />
known as “Planck’s Constant”.<br />
Humans perceive light through a combination of electro-chemical actions<br />
occurring within the eye itself. The outcome of those electro-chemical actions is<br />
transmitted to the brain via the optic nerve bundle in the form of complex electronic<br />
frequency variant waveforms. Fourier power analysis of a simulated spectrum, <strong>and</strong> of<br />
Lewine’s data (see Figure 11 <strong>and</strong> references), confirms this. An example of frequency<br />
variant waveforms is common FM radio signals.<br />
From Figure 2, light enters the eye, <strong>and</strong> travels through the cornea, aqueous<br />
humor, iris, lens, <strong>and</strong> vitreous humor where it is reasonably well (although not always)<br />
focused on the quite important Fovea Centralis. In light’s journey through the eye, the<br />
wavelengths of the incident spectrum change, however their constituent frequencies,<br />
<strong>and</strong> therefore energy, remain constant.<br />
Figure 2<br />
3
Cross-Section Human Eye<br />
From Figure 3, the Fovea Centralis is where long, medium, <strong>and</strong> short wavelength<br />
high-density photoreceptor cones reside. These photoreceptors transform light’s<br />
photon energy into electronic signals. To date, there has been little success in<br />
attempting to electronically model the interactions of each individual component of the<br />
human visual system. The human visual system does, however, mathematically<br />
behave predictably, <strong>and</strong> reproducibly, between photon input to the visual system <strong>and</strong><br />
electronic output to the optic nerve bundle. This work will use that characteristic to<br />
electronically model the human eye as a single mathematical transfer function.<br />
The number <strong>and</strong> distribution of cones within the Fovea Centralis varies, <strong>and</strong> are<br />
not only unique to each individual, but also change with age. Cones contain a pigment<br />
known as rhodopsin, which, it is believed, is broken down <strong>and</strong> bleached by the energy<br />
transferred from the incident photons. This breaking down process sets off a series of<br />
electronic charges that transmit the color light information to the brain, by way of the<br />
optic nerve bundle, in the form of frequency-variant electronic waveforms where they<br />
are cognitively converted into “visual perceptions”. In other words the brain is<br />
processing, unaltered, the exact information contained in the electronic waveforms from<br />
the optic nerve bundle, <strong>and</strong> comparing that exact waveform information to past<br />
experience according to some as yet unknown algorithms.<br />
Figure 3<br />
Fovea Centralis<br />
Figure 4 is the commonly used format to graphically represent spectroscopic<br />
performance of color transparencies. Figure 4 is from an actual transparency that has<br />
been extensively <strong>and</strong> successfully used in correcting visual abnormalities in children<br />
suffering from reading disorders. Spectroscopic data for this transparency was obtained<br />
by Henson-Parker from a commercial laboratory. Spectroscopic performance of any<br />
individual transparency is extremely dependent on its materials constituency <strong>and</strong><br />
fabrication methodology. This particular transparency is perceived as blue by the normal<br />
human eye in ambient light conditions.<br />
4
Figure 4<br />
(Graph taken from the work of Henson-Parker)<br />
Figure 5 was developed using the same raw spectroscopic data from Figure 4,<br />
but analyzed using various data mining techniques, <strong>and</strong> presenting the outcome on<br />
different scales.<br />
Figure 5<br />
Color Transparency 1 Spectroscopic Data Analysis<br />
When viewing the spectroscopic data as depicted in Figure 5, the physics of<br />
transparency operation becomes evident. Transparency 1 is acting to suppress incident<br />
photon energies to the eye from the near b<strong>and</strong> on either side of the 441 THz color<br />
5
component of ambient light frequencies. As a point of reference, this EM frequency, in<br />
air, would be perceived as “Ultra Red”.<br />
The examples in Figure 6 demonstrate comparisons between what two different<br />
children “see” without <strong>and</strong> with the use of various color transparencies unique to each<br />
child. Other students report seeing, among other distortions, upside down <strong>and</strong><br />
backwards letters <strong>and</strong> whole words, added or missing letters in words, very irregular<br />
spacing or no spacing at all, etc.<br />
Figure 6a<br />
Henson-Parker Distortion Effect Example<br />
Figure 6b<br />
Henson-Parker Distortion Effect Example<br />
6
Mathematically, the human eye performs very much like an electronic circuit.<br />
Various simulation models were created in an effort to investigate whether any specific<br />
correlations exist between color transparency physics, ordinary electronic circuits, <strong>and</strong><br />
various electronic models of the human eye.<br />
Figure 7 is the graphical representation of the gain from a simplified electronic<br />
“notch filter” circuit designed to simulate Transparency 1. Figure 8 is the schematic of<br />
the mathematically simulated circuit that produced Figure 7.<br />
Figure 7<br />
Simulation of Transparency 1 Operation<br />
Photons to Transparency<br />
1.0n<br />
1.1f<br />
1.18E-16<br />
1.0<br />
Photons from Transparency<br />
Transfer function:<br />
1+1.3⋅10 -31 ⋅s 2<br />
W(s)=<br />
1+1.1⋅10 -15 ⋅s+1.3⋅10 -31 ⋅s 2<br />
Figure 8<br />
Electronic Circuit Transparency 1 Simulation<br />
Observe the similarities between Figures 5 <strong>and</strong> 7. A transparency with<br />
significant historical success in mitigating visual abnormalities, <strong>and</strong> a simulated<br />
electronic “notch filter” have similar performance at, in this case, the 441 THz frequency.<br />
7
The mathematical performance of other color transparencies has been<br />
examined, <strong>and</strong> in each case the result is the same, i.e., each successful transparency<br />
significantly depresses specific photon energy b<strong>and</strong>s. The theoretical implication is that<br />
the physics of the transparency <strong>and</strong> the human visual system behave very much like an<br />
electronic circuit that can be modeled <strong>and</strong> analyzed mathematically, <strong>and</strong> that<br />
uncorrected incident photon energies can be mathematically correlated to visual<br />
abnormalities.<br />
If, as proposed here, depressing specific photon energies is indeed the<br />
underlying physics behind successful transparencies, then it is also reasonable to<br />
deduce that the uncorrected eye is transmitting distorted high gain, high energy,<br />
electronic signals when the Fovea Centralis photoreceptors encounter photon energies<br />
to which they are hypersensitive. The simulation below is a simplified theoretical optic<br />
nerve distortion effect due to an uncorrected visual system hypersensitive to the photon<br />
energy associated with the 441 THz frequency.<br />
This distortion effect is similar to “feedback” from conference room speakers.<br />
When a microphone is placed too close to the speakers, sound amplifier circuits<br />
become overdriven, resulting in the distorted high pitch, high energy, feedback squeal<br />
we hear. Similarly, when symptomatic photon energies enter the human eye, the<br />
dyslexic’s photoreceptors are posited to produce distorted high energy electronic<br />
waveforms delivered to the brain via the optic nerve bundle, e.g., electronic “chaff”.<br />
Figure 9 is a partial simulation of the effect. The mathematically simulated electronic<br />
circuit depicted in Figure 10 produced the effect graphed in Figure 9.<br />
Figure 9<br />
High Gain Optic Nerve Distortion Simulation<br />
8
Observe in the Figure 9 simulation that the 441 THz signal has a circuit gain over<br />
100 times higher than the gain at 300 THz <strong>and</strong> nearly 1000 times higher than the gain at<br />
700 THz. Another important physical property of the distortion simulation is that its<br />
power spectrum energy content is higher than a non-distorted signal. This is analogous<br />
to the real-life effects observed in Figure12. Borrowing from geometry’s similarity<br />
theorems, our theory posits that for those individuals whose photoreceptor circuits are<br />
hypersensitive in the “ultra red” range, the presence of this photon energy in ambient<br />
light produces a distorted high gain, high energy content, signal to the brain causing, at<br />
least in part, the visual perception effects depicted in Figure 6. It is noteworthy <strong>and</strong><br />
relevant, from Lewine’s work shown in the reference section, <strong>and</strong> consistent with the<br />
theory here, that otherwise visually “normal” individuals can be induced to experience<br />
dyslexic dysfunction conditions by selectively altering photon energies to the eye.<br />
1.0<br />
13.0p<br />
Photon Energy<br />
100.0p<br />
10.0f<br />
1.0<br />
+ IOP1<br />
-<br />
1.0<br />
1.0E-20<br />
1.0<br />
+ IOP1<br />
-<br />
Optic Nerve Signal<br />
W(s)=1⋅10 -24 ⋅<br />
1+1⋅10 -10 ⋅s+1⋅10 -24 ⋅s 2 +1.3⋅10 -41 ⋅s 3 +1.3⋅10 -55 ⋅s 4<br />
s 2<br />
Figure 10<br />
Electronic Circuit Simulation of 441 THz Distortion Effect to the Brain<br />
Figures 11 <strong>and</strong> 12 graphically represent the optic nerve time series data taken from the<br />
Lewine study (see references) <strong>and</strong> the author’s time series Fast Fourier Transform<br />
(FFT) power spectrum analysis of that data. In that study, Lewine captured <strong>and</strong><br />
compared optic nerve electronic signal data from a dyslexic subject with uncorrected<br />
<strong>and</strong> corrected (with color glasses) vision. The Lewine data were taken from the work of<br />
James Irvine (see references). When the Lewine time series power spectrum data are<br />
compared (Figure 12), the energy content of the uncorrected vision is higher than the<br />
energy content of the corrected vision. This correlates with the theory presented here<br />
that the circuits of the dyslexic’s visual system are overdriven by incident high photon<br />
energies to which they are hypersensitive.<br />
9
Figure 11<br />
Lewine Optic Nerve Signal (graph taken from the work of Jim Irvine)<br />
Figure 12<br />
Lewine Optic Nerve Electronic Power Spectrum Comparison<br />
(uncorrected power minus corrected power)<br />
10
Conclusions<br />
This work proposes a unique causal theory of visual dyslexia. It was an outcome<br />
of a collaborative effort with Henson-Parker to determine the physics underlying the<br />
success of color transparencies in mitigating the effects of visual dyslexic symptoms.<br />
The theory proposed here differs from prevailing theories suggesting that<br />
dyslexic effects are primarily caused by brain cognition failures, magnocellular visual<br />
neurological pathway deficiencies, “deep-brain timing problems”, <strong>and</strong> other causes<br />
within or by the human brain. Although these various theories all correlate well with<br />
observed dyslexic conditions, our analysis indicates that prevailing theories do not<br />
appear fundamentally causal. We speculate that perhaps the observed conditions from<br />
other theories are outcomes, rather than causal, of the brain’s natural adaptation<br />
process.<br />
The <strong>PIVA</strong> theory proposes instead that symptoms of visual dyslexia <strong>and</strong> other<br />
related visual abnormalities are induced by specific photon energies that cause electrochemical<br />
abnormalities within the eye’s photoreceptors, that those photoreceptor<br />
abnormalities process a distorted high energy content frequency-variant electronic<br />
waveform to the brain via the optic nerve bundle, <strong>and</strong> that many visual abnormalities<br />
can indeed be corrected by selectively depressing specific photon energies incident to<br />
the visual system of hypersensitive individuals. The proposed theory is not only<br />
consistent with the observed performance of subject-specific color transparencies, e.g.,<br />
see Figure 6 <strong>and</strong> references, but is derived from knowledge of their successes.<br />
This theory also deduces, from photon energy analysis, that the dyslexic effect is<br />
predominately photopic, <strong>and</strong> not scotopic, in its underlying cause.<br />
Henson-Parker’s extensive studies with “normal” <strong>and</strong> dyslexic students <strong>and</strong>, color<br />
transparencies, provided the statistical database from which <strong>PIVA</strong> was derived.<br />
James Irvine of the Naval Air Warfare Center conducted a study into the basis for<br />
successful operation of color transparencies in correcting dyslexic effects. Irvine’s<br />
approach, applied to a dyslexic subject, involved the use of colored transparencies <strong>and</strong><br />
sophisticated mathematical <strong>and</strong> statistical techniques empirically applied to different<br />
theoretical models of the human visual system. The color transparencies were used to<br />
reduce the ambient energy of the EM spectrum to the test subject. Among other<br />
discoveries, Irvine’s analysis found that it is indeed possible to mathematically simulate<br />
the output of the human vision system, <strong>and</strong> that, to a significant degree of correlation,<br />
empirical data from his experiments fit major elements of the Receptor Field Theory of<br />
Human Vision. The Receptor Field Theory posits that the eye’s photoreceptors combine<br />
their electro-chemical outputs in systematic <strong>and</strong> unique ways such that an electronic<br />
waveform, uniquely representative of given photon energy spectral input to the eye, is<br />
processed to the brain via the optic nerve bundle.<br />
11
Dr. Jeffrey Lewine of the University of Utah conducted studies on human<br />
subjects using Magnetoencephalographic techniques. In simplified form, these<br />
techniques involve electromagnetic coupling <strong>and</strong> data logging of electronic signal<br />
information from the optic nerve <strong>and</strong> in the brain. Lewine’s data verifies correlations<br />
between uncorrected <strong>and</strong> photon energy corrected (with the use of colored glasses)<br />
optic nerve electronic waveforms in subjects who suffer dyslexic type symptoms.<br />
Fourier analysis of the Lewine time series data shows that the power spectrum content<br />
for uncorrected vision in a dyslexic is higher than the power spectrum for corrected<br />
vision in the same subject. This is consistent with the <strong>PIVA</strong> Effect described here.<br />
Any valid physical theory requires that certain tests be met, among them, it<br />
should correlate with experimental data, it should agree with known physical laws, it<br />
should contain no unexplained anomalies, its predictions should be successful, testable,<br />
<strong>and</strong> verifiable, it should contain sufficient information to be able to prove it untrue, <strong>and</strong>, it<br />
should offer the simplest possible explanation (Occam’s Razor). Theoretical electronic<br />
models of human eye <strong>and</strong> its components, light experiments showing that dyslexic type<br />
symptoms can be induced in otherwise visually normal humans, <strong>and</strong>, the pioneering<br />
experimental work of Henson-Parker, Irvine, Lewine, <strong>and</strong> others, all fit within, <strong>and</strong> are<br />
consistent with, the theoretical conclusions proposed here.<br />
References<br />
Henson-Parker D, 1994 “See it Right! Assessment System”, Rancho Cucamonga, CA.<br />
Irvine JH, 1997 “Scotopic Sensitivity Syndrome in a Single Individual (Case Study)”,<br />
NAWCWPNS TS 97-14, Naval Air Warfare Center Weapons Division, China Lake, CA.<br />
Irvine JH, “The Cause of Irlen Syndrome”, Naval Air Warfare Center Weapons Division,<br />
China Lake, CA.<br />
Lewine JD, Davis JT, Provencal S, Edgar JC, Orrision WW, 2001 “A<br />
Magnetoencephalographic Investigation Of <strong>Visual</strong> Information Processing In Irlen’s<br />
Scotopic Sensitivity Syndrome”, Perception.<br />
Copyright 2004 Michael C. Parker, Illinois Registered Professional Engineer<br />
12