Motion Maps and Position vs. Time Graphs - Modeling Physics
Motion Maps and Position vs. Time Graphs - Modeling Physics
Motion Maps and Position vs. Time Graphs - Modeling Physics

You also want an ePaper? Increase the reach of your titles
YUMPU automatically turns print PDFs into web optimized ePapers that Google loves.
Name<br />
Date<br />
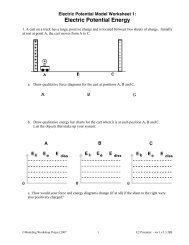
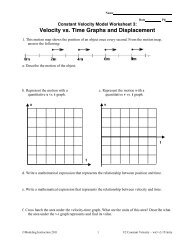
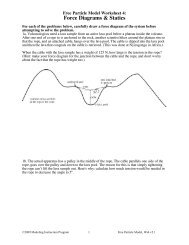
Constant Velocity Particle Model Worksheet 1:<br />
<strong>Motion</strong> <strong>Maps</strong> <strong>and</strong> <strong>Position</strong> <strong>vs</strong>. <strong>Time</strong> <strong>Graphs</strong><br />
Pd<br />
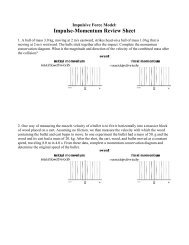
1. Given the following position <strong>vs</strong>. time graph, draw a motion map with one dot for each second.<br />
4<br />
<strong>Position</strong> <strong>vs</strong>. <strong>Time</strong><br />
3<br />
2<br />
1<br />
0 m 5 m<br />
+<br />
0<br />
0 1 2 3 4 5 6 7 8<br />
time (seconds)<br />
Describe the motion of the object in words:<br />
2. Given the following motion map, where positions have been recorded with one dot each second,<br />
draw a position <strong>vs</strong>. time graph.<br />
<strong>Position</strong> <strong>vs</strong>. <strong>Time</strong><br />
0 m 5 m<br />
+<br />
Describe the motion of the object in words:<br />
time (seconds)<br />
©<strong>Modeling</strong> Instruction 2010 1 U2 Constant Velocity ws 1 v3.0
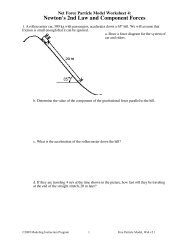
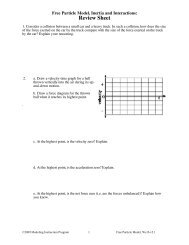
3. Consider the position <strong>vs</strong>. time graph below for cyclists A <strong>and</strong> B.<br />
a. Do the cyclists start at the same point How do you know If not, which is ahead<br />
b. At t= 7s, which cyclist is ahead How do you know<br />
c. Which cyclist is traveling faster at 3s How do you know<br />
d. Are their velocities equal at any time How do you know<br />
e. What is happening at the intersection of lines A <strong>and</strong> B<br />
f. Draw a motion map for cyclists A <strong>and</strong> B.<br />
0 m<br />
+<br />
©<strong>Modeling</strong> Instruction 2010 2 U2 Constant Velocity ws 1 v3.0
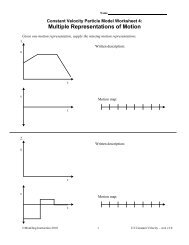
Produce a <strong>Motion</strong> Map from each position <strong>vs</strong>. time graph.<br />
4.<br />
position (m)<br />
5<br />
4<br />
3<br />
2<br />
0 m 5 m<br />
+<br />
1<br />
0<br />
0<br />
1<br />
2 3 4<br />
5<br />
time (s)<br />
5.<br />
5<br />
position (m)<br />
4<br />
3<br />
0 m 5 m<br />
2<br />
+<br />
1<br />
0<br />
0<br />
1<br />
2 3 4<br />
5<br />
time (s)<br />
6.<br />
5<br />
position (m)<br />
4<br />
3<br />
2<br />
1<br />
0 m 5 m<br />
+<br />
0<br />
0<br />
1<br />
2 3 4<br />
5<br />
time (s)<br />
©<strong>Modeling</strong> Instruction 2010 3 U2 Constant Velocity ws 1 v3.0
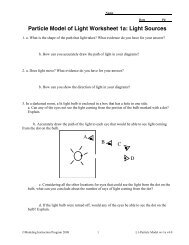
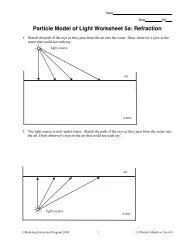
7. To rank the following, you may need to look at the key ideas sheet for the difference between<br />
displacement <strong>and</strong> distance (odometer reading.)<br />
x (m)<br />
A<br />
x (m)<br />
B<br />
x (m)<br />
C<br />
25<br />
0<br />
0<br />
10<br />
t (s)<br />
5<br />
0<br />
0<br />
10<br />
t (s)<br />
10<br />
0<br />
0<br />
10<br />
t (s)<br />
x (m)<br />
10<br />
D<br />
x (m)<br />
15<br />
E<br />
x (m)<br />
10<br />
F<br />
5<br />
3<br />
0<br />
0<br />
10<br />
t (s)<br />
0<br />
0<br />
10<br />
t (s)<br />
0<br />
0<br />
3 10<br />
t (s)<br />
a. Rank the graphs according to which show the greatest displacement from the beginning to the<br />
end of the motion.<br />
Most positive 1______ 2______ 3______ 4______ 5______ 6______ Most negative<br />
Explain your reasoning for your ranking:<br />
b. Rank the graphs according to which show the greatest distance (odometer reading) from the<br />
beginning to the end of the motion.<br />
Greatest 1________ 2________ 3________ 4________ 5________ 6________ Least<br />
Explain your reasoning for your ranking:<br />
©<strong>Modeling</strong> Instruction 2010 4 U2 Constant Velocity ws 1 v3.0