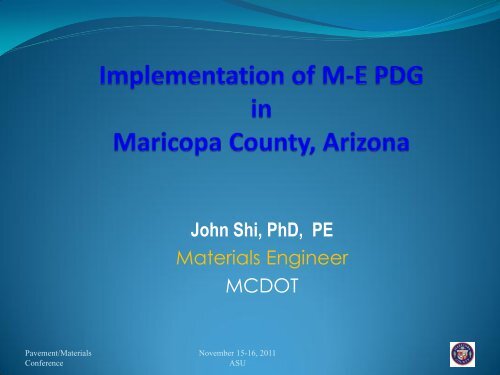
Implementation of M-E PDG in Maricopa County, Arizona
Implementation of M-E PDG in Maricopa County, Arizona
Implementation of M-E PDG in Maricopa County, Arizona
You also want an ePaper? Increase the reach of your titles
YUMPU automatically turns print PDFs into web optimized ePapers that Google loves.
John Shi, PhD, PE<br />
Materials Eng<strong>in</strong>eer<br />
MCDOT<br />
Pavement/Materials<br />
Conference<br />
November 15-16, 2011<br />
ASU
Mechanistic-<br />
Empirical<br />
Pavement<br />
Design<br />
Guide<br />
Pavement/Materials<br />
Conference<br />
November 15-16, 2011<br />
ASU
• 15 projects:<br />
8 new constructions<br />
4 overlays<br />
3 <strong>in</strong>tersection improvements<br />
• 4 types <strong>of</strong> AC mixes (24 samples): 19 mm Superpave<br />
12.5 mm Superpave<br />
Rubberized Asphalt (Term<strong>in</strong>al Blend)<br />
Asphalt Rubber (AR)<br />
• 3 types <strong>of</strong> b<strong>in</strong>der: Term<strong>in</strong>al Blend (PG 76-22)<br />
Regular B<strong>in</strong>der (PG 70-10)<br />
AR B<strong>in</strong>der (PG 64-16 w/ Crumb Rubber)<br />
• 2 types subgrade soils Silty/Sandy soil<br />
(2 samples): Clayey soil<br />
• One type <strong>of</strong> MAG AB:<br />
From R<strong>in</strong>ker Plant <strong>in</strong> Phoenix, AZ<br />
• Samples were tested for material<br />
characterization:<br />
ASU Lab<br />
MCDOT Lab<br />
MCTEC Lab<br />
Pavement/Materials<br />
Conference<br />
November 15-16, 2011<br />
ASU
• Test run M-E <strong>PDG</strong> program for 3 <strong>of</strong> the 8 new construction projects<br />
• Establish pavement distress evaluation for all <strong>of</strong> the 15 projects<br />
• Compare observed distresses with predicted from M-E <strong>PDG</strong> <strong>in</strong> the<br />
calibration process<br />
• Consider us<strong>in</strong>g ADOT data with<strong>in</strong> the <strong>County</strong><br />
Pavement/Materials<br />
Conference<br />
November 15-16, 2011<br />
ASU
Hot Mix Asphalt and Asphalt B<strong>in</strong>der<br />
• Conduct Level 1, E* Test and other tests to obta<strong>in</strong> actual master curve<br />
and shift factor l<strong>in</strong>e<br />
• Conduct conventional mix gradation, b<strong>in</strong>der content, air voids, b<strong>in</strong>der<br />
viscosity tests<br />
• Use the predictive equation (correlation equation) to determ<strong>in</strong>e the<br />
master curve or parameters<br />
• Compare the correlated properties with the actual tested.<br />
Pavement/Materials<br />
Conference<br />
November 15-16, 2011<br />
ASU
E* Dynamic Modulus, psi<br />
Master Curves <strong>of</strong> 19mm Superpave Mix<br />
1.00E+07<br />
1.00E+06<br />
1.00E+05<br />
Series1<br />
Series2<br />
Series3<br />
Series4<br />
Series5<br />
Series6<br />
Series7<br />
Series8<br />
Series9<br />
Series10<br />
Series12<br />
Series13<br />
Average<br />
1.00E+04<br />
-8 -6 -4 -2 0 2 4 6 8<br />
Log Reduced Time, s<br />
Pavement/Materials<br />
Conference<br />
November 15-16, 2011<br />
ASU
E* Dynamic Modulus, psi<br />
Master Curves <strong>of</strong> 12.5mm Superpave Mix<br />
1.00E+07<br />
1.00E+06<br />
1.00E+05<br />
Series1<br />
Series2<br />
Series3<br />
Series4<br />
Series5<br />
Series6<br />
Series7<br />
Average<br />
1.00E+04<br />
-8 -6 -4 -2 0 2 4 6 8<br />
Log Reduced Time, s<br />
Pavement/Materials<br />
Conference<br />
November 15-16, 2011<br />
ASU
E* Dynamic Modulus, psi<br />
Master Curves <strong>of</strong> AR Mix<br />
1.00E+07<br />
1.00E+06<br />
1.00E+05<br />
Series1<br />
Series2<br />
Series3<br />
Series4<br />
Series5<br />
Series6<br />
Series7<br />
Average<br />
1.00E+04<br />
-8 -6 -4 -2 0 2 4 6 8<br />
Log Reduced Time, s<br />
Pavement/Materials<br />
Conference<br />
November 15-16, 2011<br />
ASU
E* Dynamic Modulus, psi<br />
Master Curves <strong>of</strong> Hot Mix<br />
1.00E+07<br />
1.00E+06<br />
1.00E+05<br />
19mm Superpave<br />
12.5mm Superpave<br />
AR Marshall Mix<br />
L 3-19mm<br />
L3-12.5mm<br />
1.00E+04<br />
-8 -6 -4 -2 0 2 4 6 8<br />
Log Reduced Time, s<br />
Pavement/Materials<br />
Conference<br />
November 15-16, 2011<br />
ASU
Pavement/Materials<br />
Conference<br />
November 15-16, 2011<br />
ASU
B<strong>in</strong>der Properties<br />
B<strong>in</strong>der<br />
Type<br />
PG70-10<br />
Level 1<br />
PG70-10<br />
Level 3<br />
AR<br />
B<strong>in</strong>der<br />
Term<strong>in</strong>al<br />
Blend<br />
Ai 10.592 10.690 6.298 8.486<br />
VTSi -3.527 -3.566 -1.962 -2.758<br />
Pavement/Materials<br />
Conference<br />
November 15-16, 2011<br />
ASU
Log Log( Viscosity (cP))<br />
1.4<br />
B<strong>in</strong>der Viscosity Chart<br />
1.2<br />
1<br />
0.8<br />
0.6<br />
0.4<br />
y = -3.5265x + 10.592<br />
PG70-10<br />
AR<br />
Term<strong>in</strong>al Blend<br />
L<strong>in</strong>ear (PG70-10)<br />
L<strong>in</strong>ear (AR)<br />
L<strong>in</strong>ear (Term<strong>in</strong>al Blend )<br />
0.2<br />
0<br />
2.65 2.70 2.75 2.80 2.85 2.90 2.95<br />
Log (Teperature (R))<br />
Pavement/Materials<br />
Conference<br />
November 15-16, 2011<br />
ASU
Subgrade Material Database<br />
• Create a user friendly GIS based database for MCDOT<br />
• Soil units, def<strong>in</strong>ed <strong>in</strong> terms <strong>of</strong> Pedologic, AASHTO and USCS<br />
units, crossed by the major MCDOT streets and routes<br />
• Soil unit material properties, <strong>in</strong>clud<strong>in</strong>g PI, P 200 , R-Value if<br />
available, saturated hydraulic conductivity, soil classification,<br />
soil suction and expansion potential<br />
• Groundwater table depth<br />
• They will be used as <strong>in</strong>put parameters required <strong>in</strong> the<br />
constitutive models recommended with<strong>in</strong> the ME-<strong>PDG</strong><br />
Pavement/Materials<br />
Conference<br />
November 15-16, 2011<br />
ASU
M R for Soil and Aggregate Base<br />
• Select <strong>in</strong>put Level 2 <strong>in</strong> the future<br />
• No Level 1 cyclic tri-axial tests required<br />
• Commonly used R-value, PI, gradation, Proctor, swell potential<br />
tests will be needed<br />
• M R from correlations depend on moisture fluctuations<br />
• EICM uses weather data and SWCC to predict M R<br />
• Level 1 and Level 2 tests performed dur<strong>in</strong>g <strong>in</strong>put characterization<br />
• Verify correlation<br />
Pavement/Materials<br />
Conference<br />
November 15-16, 2011<br />
ASU
M R for Soil and Aggregates Base (Cont’d…)<br />
• Three water content values or suction levels selected<br />
• Conduct cyclic tri-axial tests<br />
• Determ<strong>in</strong>e the regression constant k 1 , k 2 , and k 3 correspond<strong>in</strong>g to<br />
the moisture levels<br />
• M R can be obta<strong>in</strong>ed for given stress state and moisture condition<br />
• Typical hot and cold condition stress levels for AB and subgrade<br />
provided<br />
• Typical hot and cold condition M R provided for the above mentioned<br />
moisture levels<br />
Pavement/Materials<br />
Conference<br />
November 15-16, 2011<br />
ASU
Parameter<br />
AB<br />
Subgrade Subgrade<br />
(A-1-a or GP-GM) (A-4 or SM) (A-4 or SC)<br />
P 200 6.8% 47.7% 47.4%<br />
PI NP 3 5<br />
d, max 2.263 g/cm 3 1.935 g/cm 3 1.906 g/cm 3<br />
w opt 7.0% 12.5% 12.2%<br />
SG 2.679 2.739 2.710<br />
M R, hot 46,620 psi 22,272 psi 16,851 psi<br />
M R, cold 16,600 psi 22,457 psi 21,782 psi<br />
M R, corr 40,500 psi 25,600 psi 21,318 psi<br />
Pavement/Materials<br />
Conference<br />
November 15-16, 2011<br />
ASU
Climatic Model Specific for MCDOT<br />
• Default <strong>in</strong>put climatic data files and typical climatic<br />
zones will be developed<br />
• Data Sources <strong>in</strong>clude:<br />
• The National Climatic Data Center (NCDC)<br />
• The Federal Highway Adm<strong>in</strong>istration (FHWA) Long-Term<br />
Pavement Performance (LTPP) Database<br />
• The <strong>Arizona</strong> Meteorological Network (AZMET)<br />
Database<br />
Pavement/Materials<br />
Conference<br />
November 15-16, 2011<br />
ASU
• Traffic data with<strong>in</strong> the entire <strong>County</strong> for<br />
ME-<strong>PDG</strong> is not available<br />
• Extremely costly to establish weigh-<strong>in</strong>-motion (WIM)<br />
sites and collect WIM data<br />
• We used the national database values for our trials<br />
• Most likely, the exist<strong>in</strong>g data such as AADT,<br />
Classification, direction counts, hourly counts will<br />
be used<br />
Pavement/Materials<br />
Conference<br />
November 15-16, 2011<br />
ASU
Tested Flexible Pavement Locations<br />
Indian School<br />
Road<br />
Gavilan Peak<br />
Pkwy<br />
Ellsworth<br />
Road<br />
Pavement/Materials<br />
Conference<br />
November 15-16, 2011<br />
ASU
Tested Flexible Pavement Structures<br />
2.5-<strong>in</strong> AC (19 mm, Superpave)<br />
3.0-<strong>in</strong> AC (19 mm, Superpave)<br />
10-<strong>in</strong> AB<br />
SM subgrade<br />
1.5-<strong>in</strong> AR<br />
2.5-<strong>in</strong> AC (19 mm, Superpave)<br />
2.5-<strong>in</strong> AC (19 mm, Superpave)<br />
6-<strong>in</strong> Soil Cement<br />
CL subgrade<br />
1.5-<strong>in</strong> AR<br />
3.0-<strong>in</strong> AC (19 mm, Superpave)<br />
2.0-<strong>in</strong> AC (12.5 mm, Superpave)<br />
6-<strong>in</strong> AB<br />
SM w/G subgrade<br />
Ellsworth Rd<br />
Currently owned by<br />
City <strong>of</strong> Mesa<br />
Indian School Rd<br />
Currently owned by<br />
City <strong>of</strong> Goodyear<br />
Gavilan Peak Pkwy<br />
Currently owned by<br />
<strong>Maricopa</strong> <strong>County</strong><br />
Pavement/Materials<br />
Conference<br />
November 15-16, 2011<br />
ASU
Ellsworth<br />
Road<br />
• Pr<strong>in</strong>cipal Arterial<br />
• East Valley<br />
• New Construction<br />
• 2-Lane, 2-Way<br />
• 5.5” AC<br />
• 10” AB<br />
• SM subgrade<br />
• Initial IRI 65<br />
• Opened <strong>in</strong> 2007<br />
• Current ADT 29,000<br />
• Current Trucks 5%<br />
• Growth rate 7%<br />
Indian School<br />
Road<br />
• Pr<strong>in</strong>cipal Arterial<br />
• West Valley<br />
• New Construction<br />
• 2-Lane, 2-Way<br />
• 1.5” AR over 5” AC<br />
• 6” soil cement<br />
• CL subgrade<br />
• Initial IRI 58<br />
• Opened <strong>in</strong> 2008<br />
• Current ADT 24,000<br />
• Current Trucks 2%<br />
• Growth rate 2%<br />
Gavilan Peak<br />
Parkway<br />
• Pr<strong>in</strong>cipal Arterial<br />
• Northern Area<br />
• New Road<br />
• 2-Lane, 2-Way<br />
• 1.5” AR over 5” AC<br />
• 6” AB<br />
• SM w/ G subgrade<br />
• Initial IRI 62<br />
• Opened <strong>in</strong> 2009<br />
• Current ADT 7,800<br />
• Current Trucks 8%<br />
• Growth rate 4%<br />
Pavement/Materials<br />
Conference<br />
November 15-16, 2011<br />
ASU
ME-<strong>PDG</strong> Runs—Cases*<br />
Level 1 Runs<br />
Ellsworth Rd<br />
Indian School<br />
Rd<br />
Gavilan Peak<br />
Pkwy<br />
ESALs<br />
Case 1 As-Built Pavement Old Design Traffic 14.4 Million<br />
Case 2 As-Built Pavement Actual Exist<strong>in</strong>g Traffic 17.8 Million<br />
Case 1 As-Built Pavement Old Design Traffic 7.9 Million<br />
Case 2 As-Built Pavement Actual Exist<strong>in</strong>g Traffic 4.5 Million<br />
Case 1 As-Built Pavement Old Design Traffic 7.0 Million<br />
Case 2 As-Built Pavement Actual Exist<strong>in</strong>g Traffic 2.3 Million<br />
Level 3 Runs<br />
Ellsworth Rd<br />
Indian School<br />
Rd<br />
Gavilan Peak<br />
Pkwy<br />
Pavement/Materials<br />
Conference<br />
ESALs<br />
Case 1 As-Built Pavement Old Design Traffic 14.4 Million<br />
Case 2 As-Built Pavement Actual Exist<strong>in</strong>g Traffic 17.8 Million<br />
Case 1 As-Built Pavement Old Design Traffic 7.9 Million<br />
Case 2 As-Built Pavement Actual Exist<strong>in</strong>g Traffic 4.5 Million<br />
Case 1 As-Built Pavement Old Design Traffic 7.0 Million<br />
Case 2 As-Built Pavement Actual Exist<strong>in</strong>g Traffic 2.3 Million<br />
* ME-<strong>PDG</strong> Version 1.100 was used to run these cases<br />
November 15-16, 2011<br />
ASU
ME-<strong>PDG</strong> Runs—Distress Target and Reliability<br />
Performance Criteria<br />
Units<br />
Distress*<br />
Target<br />
Reliability *<br />
Target<br />
Term<strong>in</strong>al IRI <strong>in</strong>/mile 172 90<br />
Longitud<strong>in</strong>al Crack<strong>in</strong>g (Surface Down) ft/mile 1000 90<br />
Alligator Crack<strong>in</strong>g (Bottom Up) % 100 90<br />
Transverse Crack<strong>in</strong>g (Thermal) ft/mile 100 90<br />
Rutt<strong>in</strong>g (AC Only) <strong>in</strong> 0.25 90<br />
Rutt<strong>in</strong>g (Total) <strong>in</strong> 0.75 90<br />
* Distress and Reliability targets are the default values <strong>in</strong> the program.<br />
Pavement/Materials<br />
Conference<br />
November 15-16, 2011<br />
ASU
Level 1 Case 1<br />
ME-<strong>PDG</strong> Runs—Results<br />
Ellsworth Road<br />
Performance<br />
Criteria<br />
Distress Predicted<br />
L1<br />
C1<br />
L1<br />
C2<br />
L3<br />
C1<br />
L3<br />
C2<br />
L1<br />
C1<br />
Reliability<br />
Predicted<br />
L1<br />
C2<br />
L3<br />
C1<br />
L3<br />
C2<br />
L1<br />
C1<br />
Acceptable<br />
L1<br />
C2<br />
L3<br />
C1<br />
L3<br />
C2<br />
Term<strong>in</strong>al IRI <strong>in</strong>/mi<br />
172, Rel. 90%<br />
Longitud<strong>in</strong>al Crack<strong>in</strong>g<br />
(Surface Down) ft/mi<br />
1000, Rel. 90%<br />
Alligator Crack<strong>in</strong>g (Bottom<br />
Up) %<br />
100, Rel. 90%<br />
Transverse Crack<strong>in</strong>g<br />
(Thermal) ft/mi<br />
100, Rel. 90%<br />
Rutt<strong>in</strong>g (AC Only) <strong>in</strong><br />
0.25, Rel. 90%<br />
Rutt<strong>in</strong>g (Total) <strong>in</strong><br />
0.75, Rel. 90%<br />
111.6 108.4 116.2 118.8 97.43 98.24 95.96 94.75 P P P P<br />
749 441 501 732 72.11 78.05 76.81 72.42 F F F F<br />
1.9 1.4 1.6 2.4 99.94 99.99 99.99 97.38 P P P P<br />
1 1 1 1 99.99 99.99 99.99 99.99 P P P P<br />
0.41 0.35 0.50 0.56 9.24 17.01 3.63 1.99 F F F F<br />
0.66 0.59 0.78 0.84 74.34 90.57 41.64 30.23 F P F F<br />
Pavement/Materials<br />
Conference<br />
Overall<br />
Best<br />
November 15-16, 2011<br />
ASU<br />
Overall<br />
Best<br />
Overall<br />
Best
ME-<strong>PDG</strong> Runs—Results<br />
Indian School Road Road<br />
Performance<br />
Criteria<br />
Distress Predicted<br />
L1<br />
C1<br />
L1<br />
C2<br />
L3<br />
C1<br />
L3<br />
C2<br />
L1<br />
C1<br />
Reliability<br />
Predicted<br />
L1<br />
C2<br />
L3<br />
C1<br />
L3<br />
C2<br />
L1<br />
C1<br />
Acceptable<br />
L1<br />
C2<br />
L3<br />
C1<br />
L3<br />
C2<br />
Term<strong>in</strong>al IRI <strong>in</strong>/mi<br />
172, Rel. 90%<br />
Longitud<strong>in</strong>al Crack<strong>in</strong>g<br />
(Surface Down) ft/mi<br />
1000, Rel. 90%<br />
Alligator Crack<strong>in</strong>g (Bottom<br />
Up) %<br />
100, Rel. 90%<br />
Transverse Crack<strong>in</strong>g<br />
(Thermal) ft/mi<br />
100, Rel. 90%<br />
Rutt<strong>in</strong>g (AC Only) <strong>in</strong><br />
0.25, Rel. 90%<br />
Rutt<strong>in</strong>g (Total) <strong>in</strong><br />
0.75, Rel. 90%<br />
100.7 96.2 115.9 100.8 99.39 99.75 95.94 99.41 P P P P<br />
122 48.0 1910 302 87.46 93.23 51.56 81.22 F P F F<br />
2.4 1.2 7.7 1.9 98.85 99.99 88.99 99.99 P P F P<br />
1 1 1 1 99.99 99.99 99.99 99.99 P P P P<br />
0.27 0.20 0.51 0.27 39.54 77.73 3.12 39.42 F F F F<br />
0.54 0.45 0.85 0.55 97.26 99.96 26.11 96.64 P P F F<br />
Overall<br />
Best<br />
Overall<br />
Best<br />
Overall<br />
Best<br />
Pavement/Materials<br />
Conference<br />
November 15-16, 2011<br />
ASU
ME-<strong>PDG</strong> Runs—Results<br />
Gavilan Peak Parkway<br />
Performance<br />
Criteria<br />
Distress Predicted<br />
L1<br />
C1<br />
L1<br />
C2<br />
L3<br />
C1<br />
L3<br />
C2<br />
L1<br />
C1<br />
Reliability<br />
Predicted<br />
L1<br />
C2<br />
L3<br />
C1<br />
L3<br />
C2<br />
L1<br />
C1<br />
Acceptable<br />
L1<br />
C2<br />
L3<br />
C1<br />
L3<br />
C2<br />
Term<strong>in</strong>al IRI <strong>in</strong>/mi<br />
172, Rel. 90%<br />
Longitud<strong>in</strong>al Crack<strong>in</strong>g<br />
(Surface Down) ft/mi<br />
1000, Rel. 90%<br />
Alligator Crack<strong>in</strong>g (Bottom<br />
Up) %<br />
100, Rel. 90%<br />
Transverse Crack<strong>in</strong>g<br />
(Thermal) ft/mi<br />
100, Rel. 90%<br />
Rutt<strong>in</strong>g (AC Only) <strong>in</strong><br />
0.25, Rel. 90%<br />
Rutt<strong>in</strong>g (Total) <strong>in</strong><br />
0.75, Rel. 90%<br />
95.7 91.5 100.6 93.2 99.76 99.90 99.42 99.86 P P P P<br />
75.3 2.4 79.5 1.6 73.57 97.86 73.21 98.94 F P F P<br />
0.6 0.3 0.7 0.2 99.99 99.99 99.99 99.99 P P P P<br />
1 1 1 1 93.61 93.61 93.61 93.61 P P P P<br />
0.24 0.18 0.36 0.22 52.69 89.30 15.31 68.53 F F F F<br />
0.43 0.33 0.55 0.37 99.97 99.99 95.39 99.99 P P P P<br />
Overall<br />
Best<br />
Overall<br />
Best<br />
Overall<br />
Best<br />
Pavement/Materials<br />
Conference<br />
November 15-16, 2011<br />
ASU
IRI (<strong>in</strong>/mi)<br />
Comparison <strong>of</strong> Results<br />
Ellsworth Road<br />
IRI<br />
200<br />
180<br />
160<br />
140<br />
120<br />
100<br />
80<br />
60<br />
40<br />
IRI<br />
IRI at Reliability<br />
Design Limit<br />
IRI Observed<br />
20<br />
0<br />
0 24 48 72 96 120 144 168 192 216 240 264<br />
Pavement/Materials<br />
Conference<br />
Pavement Age (month)<br />
November 15-16, 2011<br />
ASU
Rutt<strong>in</strong>g Depth (<strong>in</strong>)<br />
Comparison <strong>of</strong> Results<br />
Ellsworth Road<br />
Rutt<strong>in</strong>g<br />
0.80<br />
0.70<br />
0.60<br />
0.50<br />
AC Rutt<strong>in</strong>g Design Value = 0.25<br />
Total Rutt<strong>in</strong>g Design Limit = 0.75<br />
SubTotalAC<br />
SubTotalBase<br />
SubTotalSG<br />
Total Rutt<strong>in</strong>g<br />
TotalRutReliability<br />
0.40<br />
0.30<br />
0.20<br />
0.10<br />
0.00<br />
Pavement/Materials<br />
Conference<br />
0 24 48 72 96 120 144 168 192 216 240 264<br />
Pavement Age (month)<br />
November 15-16, 2011<br />
ASU
IRI (<strong>in</strong>/mi)<br />
Comparison <strong>of</strong> Results<br />
200<br />
Indian School Rd<br />
IRI<br />
180<br />
160<br />
140<br />
120<br />
100<br />
80<br />
60<br />
40<br />
20<br />
IRI<br />
IRI at Reliability<br />
Design Limit<br />
IRI Observed<br />
0<br />
Pavement/Materials<br />
Conference<br />
0 24 48 72 96 120 144 168 192 216 240 264<br />
Pavement Age (month)<br />
November 15-16, 2011<br />
ASU
Rutt<strong>in</strong>g Depth (<strong>in</strong>)<br />
Comparison <strong>of</strong> Results<br />
0.80<br />
Indian School Road<br />
Rutt<strong>in</strong>g<br />
0.70<br />
0.60<br />
0.50<br />
AC Rutt<strong>in</strong>g Design Value = 0.25<br />
Total Rutt<strong>in</strong>g Design Limit = 0.75<br />
SubTotalAC<br />
SubTotalBase<br />
SubTotalSG<br />
Total Rutt<strong>in</strong>g<br />
TotalRutReliability<br />
Total Rutt<strong>in</strong>g Design Limit<br />
Observed Rutt<strong>in</strong>g<br />
0.40<br />
0.30<br />
0.20<br />
0.10<br />
0.00<br />
Pavement/Materials<br />
Conference<br />
0 24 48 72 96 120 144 168 192 216 240 264<br />
Pavement Age (month)<br />
November 15-16, 2011<br />
ASU
IRI (<strong>in</strong>/mi)<br />
Comparison <strong>of</strong> Results<br />
200<br />
Gavilan Peak Parkway<br />
IRI<br />
180<br />
160<br />
140<br />
120<br />
100<br />
80<br />
60<br />
40<br />
20<br />
0<br />
IRI<br />
IRI at Reliability<br />
Design Limit<br />
IRI Observed<br />
0 24 48 72 96 120 144 168 192 216 240 264<br />
Pavement/Materials<br />
Conference<br />
Pavement Age (month)<br />
November 15-16, 2011<br />
ASU
Rutt<strong>in</strong>g Depth (<strong>in</strong>)<br />
Comparison <strong>of</strong> Results<br />
Gavilan Peak Parkway<br />
Rutt<strong>in</strong>g<br />
0.80<br />
0.70<br />
0.60<br />
0.50<br />
AC Rutt<strong>in</strong>g Design Value = 0.25<br />
Total Rutt<strong>in</strong>g Design Limit = 0.75<br />
SubTotalAC<br />
SubTotalBase<br />
SubTotalSG<br />
Total Rutt<strong>in</strong>g<br />
TotalRutReliability<br />
Total Rutt<strong>in</strong>g Design Limit<br />
Observed Rutt<strong>in</strong>g<br />
0.40<br />
0.30<br />
0.20<br />
0.10<br />
0.00<br />
0 24 48 72 96 120 144 168 192 216 240 264<br />
Pavement/Materials<br />
Conference<br />
Pavement Age (month)<br />
November 15-16, 2011<br />
ASU
Based on the results:<br />
Analysis <strong>of</strong> Results<br />
• Level 1 (L1) runs with Current Traffic (C2) generally <strong>in</strong>dicated the<br />
predicted distress was lower &reliability was higher<br />
• Level 3 runs generally produced fail<strong>in</strong>g results<br />
• Measured IRI values were lower than the Predicted IRI<br />
from L1 runs, so far<br />
• Measured IRI values were lower than 50% reliability prediction<br />
• Measured Rutt<strong>in</strong>g values were also lower than 50% reliability<br />
prediction<br />
• Some <strong>in</strong>stances distress was acceptable but not the reliability<br />
Pavement/Materials<br />
Conference<br />
November 15-16, 2011<br />
ASU
Conclusions<br />
• Level 1 runs can be used to optimize the pavement design<br />
for site conditions<br />
• Level 3 runs may produce conservative pavement sections<br />
• The program can be calibrated to produce realistic results for<br />
<strong>Maricopa</strong> <strong>County</strong><br />
• The national data used for reliability predictions can be replaced<br />
if enough data is available with<strong>in</strong> the <strong>County</strong><br />
• The desired calibration can be obta<strong>in</strong>ed over several years <strong>of</strong><br />
data collection & comparison<br />
Pavement/Materials<br />
Conference<br />
November 15-16, 2011<br />
ASU
Future Work<br />
• Only 3 <strong>County</strong> sites were subject to analysis at this time, but<br />
there are 5 more <strong>County</strong> sites with data necessary to run the<br />
program<br />
• All these 8 sites will be analyzed at least for seven years<br />
• All these 8 sites will be subject to constant distress monitor<strong>in</strong>g<br />
and IRI measurements<br />
• ADOT has several sites with data with<strong>in</strong> the <strong>County</strong>, and these<br />
sites also will be added to the pool so that the results are<br />
statistically sound<br />
• The program will be calibrated to <strong>County</strong> specific conditions<br />
once enough measured and predicted comparisons are<br />
available<br />
• <strong>County</strong> specific adjustments will be verified<br />
Pavement/Materials<br />
Conference<br />
November 15-16, 2011<br />
ASU
Acknowledgements<br />
Gant Yasanayake, PhD, PE<br />
Pavement Design Eng<strong>in</strong>eer—Project Management & Construction, MCDOT<br />
Al Kattan, PE<br />
Division Manager—Project Management & Construction, MCDOT<br />
John Hausk<strong>in</strong>s, PE<br />
Director—MCDOT<br />
Mike Mamlouk, PhD, PE<br />
Pr<strong>of</strong>essor—Dept. <strong>of</strong> Civil, Environmental and Susta<strong>in</strong>able Eng<strong>in</strong>eer<strong>in</strong>g, ASU<br />
Claudia Zapata, PhD<br />
Asst. Pr<strong>of</strong>essor—Dept. <strong>of</strong> Civil, Environmental and Susta<strong>in</strong>able Eng<strong>in</strong>eer<strong>in</strong>g, ASU<br />
Matthew Witczak, PhD, PE<br />
Pr<strong>of</strong>essor—Dept. <strong>of</strong> Civil, Environmental and Susta<strong>in</strong>able Eng<strong>in</strong>eer<strong>in</strong>g, ASU<br />
Pavement/Materials<br />
Conference<br />
November 15-16, 2011<br />
ASU
Pavement/Materials<br />
Conference<br />
November 15-16, 2011<br />
ASU


