1.0Executive Summary - Futron Corporation
1.0Executive Summary - Futron Corporation
1.0Executive Summary - Futron Corporation

Create successful ePaper yourself
Turn your PDF publications into a flip-book with our unique Google optimized e-Paper software.
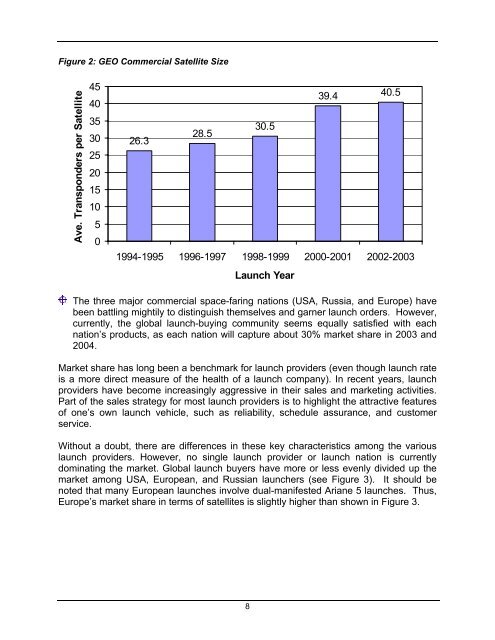
Figure 2: GEO Commercial Satellite Size<br />
Ave. Transponders per Satellite<br />
45<br />
40<br />
35<br />
30<br />
25<br />
20<br />
15<br />
10<br />
5<br />
0<br />
39.4 40.5<br />
30.5<br />
28.5<br />
26.3<br />
1994-1995 1996-1997 1998-1999 2000-2001 2002-2003<br />
Launch Year<br />
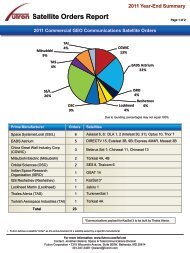
The three major commercial space-faring nations (USA, Russia, and Europe) have<br />
been battling mightily to distinguish themselves and garner launch orders. However,<br />
currently, the global launch-buying community seems equally satisfied with each<br />
nation’s products, as each nation will capture about 30% market share in 2003 and<br />
2004.<br />
Market share has long been a benchmark for launch providers (even though launch rate<br />
is a more direct measure of the health of a launch company). In recent years, launch<br />
providers have become increasingly aggressive in their sales and marketing activities.<br />
Part of the sales strategy for most launch providers is to highlight the attractive features<br />
of one’s own launch vehicle, such as reliability, schedule assurance, and customer<br />
service.<br />
Without a doubt, there are differences in these key characteristics among the various<br />
launch providers. However, no single launch provider or launch nation is currently<br />
dominating the market. Global launch buyers have more or less evenly divided up the<br />
market among USA, European, and Russian launchers (see Figure 3). It should be<br />
noted that many European launches involve dual-manifested Ariane 5 launches. Thus,<br />
Europe’s market share in terms of satellites is slightly higher than shown in Figure 3.<br />
8