1.0Executive Summary - Futron Corporation
1.0Executive Summary - Futron Corporation
1.0Executive Summary - Futron Corporation

Create successful ePaper yourself
Turn your PDF publications into a flip-book with our unique Google optimized e-Paper software.
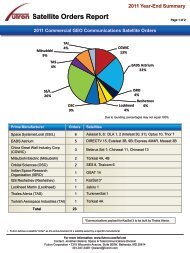
Figure 3: Commercial Launch Market Share, by Nation<br />
Multinational<br />
13%<br />
2003<br />
U.S.<br />
31%<br />
Multinational<br />
12%<br />
Japan<br />
4%<br />
2004<br />
U.S.<br />
23%<br />
Europe<br />
26%<br />
Europe<br />
27%<br />
Russia<br />
30%<br />
Russia<br />
34%<br />
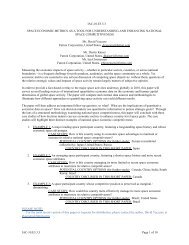
There are ominous signs ahead for the commercial launch industry. While the nearterm<br />
commercial manifest if fairly stable, the outlook is much less robust after 2004.<br />
There is a strong correlation between the number of commercial GEO comsats<br />
launched and the number previously ordered. The number of launches usually follows<br />
the number ordered by about three years (see Figure 4). While the correlation is not<br />
perfect, the two data points do track. If this correlation continues, 2005 could be a very<br />
challenging year for the launch industry.<br />
Figure 4: GEO Commercial Communications Satellite Orders and Corresponding<br />
Launches with a 3-year Shift<br />
40<br />
35<br />
30<br />
25<br />
20<br />
15<br />
10<br />
5<br />
0<br />
1995 1996 1997 1998 1999 2000 2001 2002<br />
1998 1999 2000 2001 2002 2003 (est.) 2004 (est.)<br />
Satellites Ordered Launches (3-year shift)<br />
9