Facts & Figures 2011/2012 - Sembcorp
Facts & Figures 2011/2012 - Sembcorp
Facts & Figures 2011/2012 - Sembcorp

Create successful ePaper yourself
Turn your PDF publications into a flip-book with our unique Google optimized e-Paper software.
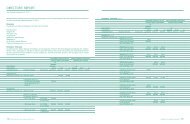
Utilities<br />
At a Glance<br />
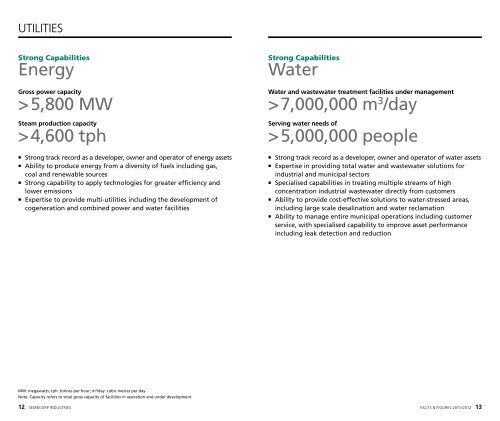
• A leading energy and water player<br />
• Over 5,800 MW of gross power capacity installed and under<br />
development worldwide<br />
• Global water service provider with over seven million m 3 /day of<br />
water capacity in operation and under development<br />
• Global leader in the provision of energy, water and on-site logistics<br />
to multiple industrial site customers<br />
FY<strong>2011</strong> Key <strong>Figures</strong><br />
Turnover<br />
S$4.9<br />
billion<br />
US$3.8 billion<br />
Profit from Operations<br />
S$421<br />
million<br />
US$324 million<br />
Net Profit<br />
S$304<br />
million<br />
US$234 million<br />
Net Profit by Product Segment<br />
Excluding Corporate<br />
13%<br />
S$42m<br />
26%<br />
S$80m<br />
• Energy<br />
• Water<br />
• On-site logistics<br />
& solid waste management<br />
61%<br />
S$189m<br />
<strong>Sembcorp</strong>’s combined power and desalination plant in Fujairah, UAE<br />
Profit from operations: earnings before interest and tax (EBIT) + share of associates’ and joint ventures’ results<br />
(net of tax); MW: megawatts; m: million; m 3 /day: cubic metres per day<br />
<strong>Facts</strong> & <strong>Figures</strong> <strong>2011</strong>/<strong>2012</strong> 7