Sembcorp Industries Annual Report 2011
Sembcorp Industries Annual Report 2011
Sembcorp Industries Annual Report 2011

Create successful ePaper yourself
Turn your PDF publications into a flip-book with our unique Google optimized e-Paper software.
GROWING<br />
SUSTAINABLE<br />
BUSINESSES<br />
Solutions for Tomorrow’s Needs<br />
<strong>Sembcorp</strong> <strong>Industries</strong> <strong>Annual</strong> <strong>Report</strong> <strong>2011</strong>
CONTENTS<br />
<strong>Sembcorp</strong> provides essential solutions that are indispensable to<br />
everyday life. As vital partners to industries and households, we are<br />
committed to growing businesses that are strong and lasting.<br />
Letter to Shareholders 10<br />
Group Financial Highlights 16<br />
Group Quarterly Performance 17<br />
Five-Year Performance Profile 18<br />
Significant Events 22<br />
Operating & Financial Review<br />
Company Overview 26<br />
Business Description 26<br />
Objective & Strategies 26<br />
Group Structure 30<br />
Group Review 32<br />
Overview 32<br />
Turnover 32<br />
Net Profit 32<br />
Cash Flow and Liquidity 32<br />
Financial Position 33<br />
Shareholder Returns 34<br />
Economic Value Added 34<br />
Value Added and Productivity Data 34<br />
Critical Accounting Policies 34<br />
Financial Risk Management 34<br />
Treasury Management 34<br />
Facilities 34<br />
Borrowings 37<br />
Utilities Review 43<br />
Marine Review 49<br />
Integrated Urban Development Review 55<br />
Environmental, Social<br />
& Governance Review<br />
Board of Directors 60<br />
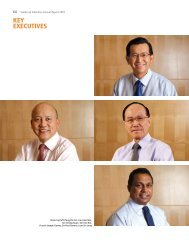
Key Executives 64<br />
Corporate Governance 68<br />
Risk Management &<br />
Mitigation Strategies 80<br />
Investor Relations 85<br />
Sustainability 88<br />
Financial Statements<br />
Directors’ <strong>Report</strong> 114<br />
Statement by Directors 132<br />
Independent Auditors’ <strong>Report</strong> 133<br />
Balance Sheets 134<br />
Consolidated Income Statement 135<br />
Consolidated Statement<br />
of Comprehensive Income 136<br />
Consolidated Statement<br />
of Changes in Equity 137<br />
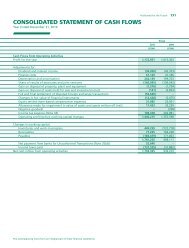
Consolidated Statement of Cash Flows 141<br />
Notes to the Financial Statements 143<br />
Supplementary Information 260<br />
EVA Statement 263<br />
Shareholders’ Information 264<br />
Corporate Information 265<br />
Notice of <strong>Annual</strong> General Meeting 266<br />
Proxy Form 271<br />
Financial Calendar Inside Back Cover<br />
Our energy business supports industrialisation and powers<br />
households. Serving over five million people worldwide, our<br />
water and wastewater solutions enhance quality of life and limit<br />
environmental impact. Meanwhile, our marine business drives<br />
progress in the oil and gas and marine sectors with a full spectrum<br />
of integrated solutions. We also support sustainable urbanisation<br />
with integrated urban developments in emerging markets.<br />
With businesses that provide essential solutions to serve the world’s<br />
growing needs, <strong>Sembcorp</strong> is well-positioned with the resilience to<br />
deliver sustainable value today, tomorrow and beyond.
PROVIDING<br />
ENERGY<br />
TO POWER<br />
LIVES<br />
<strong>Sembcorp</strong> provides essential energy required<br />
in daily lives through efficient power and steam<br />
generation. With 5,600 megawatts of gross power<br />
capacity and a healthy pipeline of projects under<br />
development worldwide, our energy business<br />
supports industrialisation and urbanisation while<br />
providing a growing recurring income base.<br />
<strong>Sembcorp</strong>’s combined power and desalination plant in Fujairah, UAE<br />
2 SEMBCORP INDUSTRIES ANNUAL REPORT <strong>2011</strong>
MANAGING<br />
PRECIOUS<br />
WATER<br />
RESOURCES<br />
<strong>Industries</strong> and households rely on <strong>Sembcorp</strong>’s<br />
innovative and sustainable water solutions to<br />
support development and enhance the quality<br />
of life. Managing more than seven million<br />
cubic metres of water per day, we provide<br />
total water solutions that meet the growing<br />
needs of industries, communities and<br />
governments. Our water operations serve<br />
over five million people worldwide while<br />
contributing a stable revenue stream.<br />
The <strong>Sembcorp</strong> NEWater Plant, Singapore<br />
4 SEMBCORP INDUSTRIES ANNUAL REPORT <strong>2011</strong>
OFFERING<br />
DIVERSIFIED<br />
MARINE<br />
AND OFFSHORE<br />
SOLUTIONS<br />
From the building of jack-up and semi-submersible<br />
rigs and offshore platforms, to offshore conversion<br />
projects and ship repair, <strong>Sembcorp</strong> provides a<br />
wide spectrum of marine and offshore solutions.<br />
Our diversified portfolio serves the varied needs of<br />
international oil and gas players and ship operators,<br />
while our ship repair operations provide a steady<br />
baseload for our business and shareholders.<br />
<strong>Sembcorp</strong> Marine’s Jurong Shipyard, Singapore<br />
6 SEMBCORP INDUSTRIES ANNUAL REPORT <strong>2011</strong>
SUPPORTING<br />
SUSTAINABLE<br />
URBAN<br />
DEVELOPMENT<br />
<strong>Sembcorp</strong> develops and manages integrated<br />
urban developments comprising industrial parks<br />
as well as business, commercial and residential<br />
space. Our projects in some of the world’s<br />
fastest growing markets drive investments<br />
and support sustainable urbanisation, while<br />
providing a robust pipeline for growth.<br />
An artist’s impression of the Sino-Singapore Nanjing Eco Hi-tech Island, China<br />
8 SEMBCORP INDUSTRIES ANNUAL REPORT <strong>2011</strong>
LETTER TO SHAREHOLDERS<br />
ANG KONG HUA, Chairman (right)<br />
TANG KIN FEI, Group President & CEO (left)<br />
In <strong>2011</strong>, our Group delivered a robust operating performance and<br />
achieved significant milestones in the execution and development<br />
of more than S$5 billion worth of new projects.<br />
Dear Shareholders,<br />
<strong>Sembcorp</strong> delivered a strong performance in<br />
<strong>2011</strong>. Our net profit attributable to shareholders (net<br />
profit) for the year grew 2% from S$792.9 million in<br />
2010 to S$809.3 million, while turnover was up 3%<br />
from S$8.8 billion in the previous year to S$9.0 billion.<br />
Our main profit contributors continued to be our<br />
Utilities and Marine businesses, which accounted for<br />
37% and 55% of Group net profit respectively. Our<br />
Utilities business delivered robust profit growth in<br />
<strong>2011</strong>, with net profit growing 32% to S$304.4 million,<br />
while Marine’s net profit was S$456.2 million<br />
compared to S$492.8 million in 2010.<br />
The Group’s return on equity was 20.4% and<br />
earnings per share amounted to 45.3 cents. Economic<br />
value added was a positive S$728.2 million, while<br />
cash and cash equivalents stood at S$3.0 billion.<br />
For <strong>2011</strong>, we are pleased to inform you that the<br />
Board of Directors is proposing a final tax exempt<br />
one-tier dividend of 17 cents per ordinary share,<br />
comprising an ordinary dividend of 15 cents and a<br />
bonus dividend of 2 cents.<br />
Maintaining Momentum,<br />
Achieving Milestones<br />
In a year marked by economic uncertainty,<br />
our Group delivered a robust operating performance.<br />
We also continued to position our businesses for<br />
sustainable growth with the achievement of significant<br />
milestones in the execution and development of more<br />
than S$5 billion worth of new projects.<br />
Providing a growing recurring earnings base, our<br />
Utilities business delivered a strong performance.<br />
Record profits for the business were driven by good<br />
operating performance in Singapore, China and the<br />
Middle East & Africa. Our Singapore operations,<br />
underpinned by a solid performance from our<br />
existing combined cycle gas turbine cogeneration<br />
plant, remained the business’ key contributor. During<br />
the year we also saw the commencement of the<br />
delivery of an additional 90 billion British thermal<br />
units per day of natural gas from West Natuna Sea<br />
in the fourth quarter of the year. This second gas<br />
sales agreement increases our existing supply by<br />
26%. We also successfully integrated businesses we<br />
had acquired into the Group and made significant<br />
progress in executing our new projects in Singapore,<br />
Oman and India.<br />
During the year, we integrated the operations<br />
of Cascal into the <strong>Sembcorp</strong> Group following our<br />
acquisition in 2010. Demonstrating our ability to<br />
execute and extract value from acquisitions, its<br />
municipal water and wastewater businesses in 18<br />
operating locations across eight countries delivered<br />
a good performance. In Australia, our solid waste<br />
management associate, SembSITA Australia, is now<br />
the second largest waste management operator in<br />
the country with the successful acquisition and<br />
integration of WSN Environmental Solutions, a solid<br />
waste management service provider formerly owned<br />
by the New South Wales government.<br />
We strengthened our market position as a<br />
global leader in the provision of energy, water and<br />
on-site logistics to industrial sites with our successful<br />
expansion into a new growth area on Jurong<br />
Island, Singapore. During the year, we commenced<br />
construction of facilities to provide the integrated<br />
supply of steam, water and industrial wastewater<br />
treatment as well as a new combined cycle gas<br />
turbine cogeneration plant in the Banyan and<br />
Angsana districts of the island. Our industrial<br />
10 SEMBCORP INDUSTRIES ANNUAL REPORT <strong>2011</strong>
LETTER TO SHAREHOLDERS<br />
The key to <strong>Sembcorp</strong>’s long-term sustainability lies in the strength<br />
of our businesses.<br />
wastewater treatment capacity will more than<br />
double when the new 9,600 cubic metres per<br />
day industrial wastewater treatment plant, capable<br />
of treating multiple streams of complex industrial<br />
wastewater, is operational in the second half of<br />
2012. Meanwhile, our new cogeneration plant, our<br />
second on Jurong Island, will increase our generation<br />
capacity in the Singapore energy market by 50%.<br />
Complementing our existing facility with a capacity<br />
of 400 megawatts of power and 200 tonnes per<br />
hour of process steam, this initial phase is due for<br />
completion in the fourth quarter of 2013.<br />
Key milestones were also achieved in Oman<br />
and India where we are actively building platforms<br />
for future growth. In Oman, we successfully met<br />
a tight timeline to complete the first phase of the<br />
US$1 billion Salalah Independent Water and Power<br />
Plant on schedule. With the completion of the first<br />
phase, the facility began dispatching 61 megawatts<br />
of net power to the Dhofar power grid in southern<br />
Oman in July <strong>2011</strong>. Targeted to begin full commercial<br />
operations in the second quarter of 2012, the project<br />
is set to be the most energy-efficient power and<br />
water plant in Dhofar, with a total gross power<br />
capacity of 490 megawatts and water production<br />
capacity of 15 million imperial gallons (69,000 cubic<br />
metres) per day. Meanwhile, in India, we completed<br />
our acquisition of a 49% stake in Thermal Powertech<br />
Corporation India and commenced construction of<br />
the 1,320-megawatt coal-fired power plant applying<br />
high efficiency supercritical technology in<br />
Krishnapatnam, Nellore District in Andhra Pradesh.<br />
The S$1.9 billion plant, our first in the fast-growing<br />
Indian energy market, is expected to begin full<br />
commercial operations in 2014.<br />
The year also saw international recognition for<br />
<strong>Sembcorp</strong>’s capabilities as a leading global water<br />
player. <strong>Sembcorp</strong> was named the Water Company<br />
of the Year at the Global Water Intelligence’s <strong>2011</strong><br />
Global Water Awards. In addition to winning the top<br />
honour at the prestigious Global Water Awards, we<br />
also clinched the Desalination Deal of the Year award<br />
for our Salalah Independent Water and Power Plant.<br />
In <strong>2011</strong>, our Marine business continued to<br />
deliver satisfactory results underpinned by its rig<br />
building, ship conversion and offshore and ship repair<br />
sectors. During the year, we completed and delivered<br />
a record number of four semi-submersible rigs, three<br />
jack-up rigs and five ship conversion and offshore<br />
projects on schedule or ahead of schedule. This<br />
included the Gajah Baru platforms for Premier Oil<br />
Natuna Sea as well as the West Elara, a Gusto MSC<br />
CJ70 150A harsh-environment jack-up rig for<br />
Seadrill. Classed among the biggest and most<br />
advanced jack-up rigs in the world, the West Elara<br />
is our Marine business’ first harsh-environment,<br />
high-specification jack-up newbuild and the largest<br />
of its kind constructed in Singapore. <strong>Sembcorp</strong><br />
Marine has a net orderbook of S$6.3 billion as at<br />
February 2012, with completions and deliveries till<br />
2015. This includes S$1.3 billion in contract orders<br />
secured since the start of 2012, excluding ship repair<br />
contracts. For ship repair, several long-term contracts<br />
were secured during the year which will provide a<br />
stable baseload for the business.<br />
Over the course of the year, we also strengthened<br />
our Marine business’ global network of shipyards. In<br />
Brazil, an important milestone was achieved with the<br />
groundbreaking of <strong>Sembcorp</strong> Marine’s wholly-owned<br />
Estaleiro Jurong Aracruz, our first overseas Integrated<br />
New Yard Facility in the state of Espirito Santo,<br />
Brazil’s second largest oil producer. Strategically<br />
placed close to the rich oil and gas basin of Espirito<br />
Santo, one of Brazil’s giant pre-salt reservoirs,<br />
Estaleiro Jurong Aracruz is well-positioned to support<br />
developments in one of the fastest growing offshore<br />
oil and gas exploration markets in the world. In<br />
February 2012, Estaleiro Jurong Aracruz secured<br />
its first project, a US$792.5 million contract<br />
from a subsidiary of Sete Brasil Participacões for<br />
the design and construction of a drillship based on<br />
our proprietary Jurong Espadon drillship design. This<br />
represents the first drillship that our Marine business<br />
is building for Brazil. In India, we increased our<br />
stake in Sembmarine Kakinada from 19.9% to 40%,<br />
making us the largest single shareholder of the joint<br />
venture facility. Located in the east coast of India,<br />
the integrated marine and offshore facility is<br />
well-placed to capitalise on the development and<br />
long-term growth potential of the offshore industry<br />
in India and South Asia. Meanwhile in Singapore,<br />
construction of the Integrated New Yard Facility in<br />
Tuas View Extension is progressing on schedule. The<br />
state-of-the-art yard, with its innovative workefficient<br />
design, represents a major milestone in<br />
our growth and expansion strategy as it will further<br />
bolster our home-based capabilities to deliver<br />
value-added cost-efficient solutions to our customers.<br />
Upon the yard becoming operational in 2013, our<br />
ship repair and ship conversion and offshore capacity<br />
will nearly double from the current 1.9 million<br />
deadweight tonnes.<br />
<strong>2011</strong> was also a fruitful year for our Integrated<br />
Urban Development business (formerly known<br />
as Industrial Parks) as we continued to step up<br />
our presence, undertaking integrated developments<br />
comprising industrial parks as well as business,<br />
commercial and residential space in Vietnam<br />
and China.<br />
In <strong>2011</strong>, our Vietnam Singapore Industrial Park<br />
(VSIP) joint venture turned in a solid year led by<br />
industrial land sales. Following the success of our first<br />
four VSIP projects, a memorandum of understanding<br />
was signed with the People’s Committee of Quang<br />
Ngai province during the year to explore the<br />
feasibility of a fifth VSIP, a 1,020-hectare integrated<br />
urban development in Quang Ngai province, central<br />
Vietnam. The signing was witnessed by the President<br />
of Vietnam His Excellency Truong Tan Sang and<br />
Singapore Prime Minister Lee Hsien Loong. In China,<br />
we sold the first plot of land in the Sino-Singapore<br />
Nanjing Eco Hi-tech Island, kick-starting a mixed-use<br />
development, New One North. The development will<br />
comprise a research and development park, an<br />
exhibition centre and a waterfront commercialleisure-residential<br />
precinct overlooking Nanjing city<br />
on the mainland.<br />
In <strong>2011</strong>, the business sold a total of 226 hectares<br />
of land, a 24% increase from the previous year and<br />
had 227 hectares of land commitments at year-end.<br />
During the year, we also studied the feasibility of<br />
a new integrated development in Chengdu, China.<br />
The Singapore-Sichuan Hi-tech Innovation Park,<br />
to be located in Chengdu’s Tianfu New City central<br />
business district, adds 500 hectares to our saleable<br />
land bank. With a total gross project size of 7,687<br />
hectares and 2,711 hectares of land available for<br />
sale, our projects in Vietnam and China provide a<br />
robust development pipeline. Together with our<br />
track record in the development of raw land,<br />
including land preparation and infrastructure<br />
development, and our ability to extract further<br />
value by undertaking the selective development<br />
of commercial and residential estate at choice sites,<br />
we believe that the business is poised for growth<br />
in the coming years.<br />
Growing Sustainable Businesses<br />
In today’s volatile global economic environment,<br />
the key to <strong>Sembcorp</strong>’s long-term sustainability lies<br />
in the strength of our businesses. We aim to enhance<br />
shareholder value by excelling in businesses that<br />
deliver recurring earnings and have the ability<br />
to sustain growth over the long term. This means<br />
an unrelenting focus on operational excellence<br />
and performance, but also the same unremitting<br />
commitment to growing businesses that can<br />
deliver lasting value.<br />
12 SEMBCORP INDUSTRIES ANNUAL REPORT <strong>2011</strong> GROWING SUSTAINABLE BUSINESSES 13
LETTER TO SHAREHOLDERS<br />
As a provider of essential solutions, we believe that we are in the right<br />
businesses – businesses that meet the needs of the global market and<br />
provide innovative solutions to the challenges our world is facing.<br />
Our energy business supports industrialisation<br />
and powers households. Our water and wastewater<br />
solutions enhance quality of life and limit environmental<br />
impact. Our Marine business supports progress in the<br />
oil and gas and marine sectors with a full spectrum<br />
of integrated solutions, while our Integrated Urban<br />
Development business supports urban development<br />
in emerging markets. With globalisation and<br />
urbanisation, the world’s demand for these solutions<br />
will continue to grow. As a provider of these essential<br />
solutions, we believe that we are in the right<br />
businesses – businesses that meet the needs of the<br />
global market and provide innovative solutions to<br />
the challenges our world is facing. With a global<br />
footprint across six continents including growing<br />
emerging economies such as China, India, South<br />
Africa, Brazil and Chile, we are well-positioned with<br />
the reach and scale to meet the growing needs in<br />
these markets. At the same time, it is our belief that<br />
a climate of business uncertainty is inevitably<br />
accompanied by opportunity. All our businesses are<br />
well-placed to take advantage of value-enhancing and<br />
strategically attractive opportunities that may arise.<br />
While we generate returns for shareholders<br />
by providing essential solutions to our customers,<br />
we aim to do so responsibly, and in a sustainable<br />
manner. We believe that truly sustainable businesses<br />
will not only create economic value, but will do so in<br />
a way that creates benefit for customers, suppliers,<br />
partners and communities wherever they operate.<br />
For <strong>Sembcorp</strong>, this translates to doing our part to<br />
limit the environmental impact of our activities and<br />
helping our customers and communities do the<br />
same, as well as being a responsible employer and<br />
maintaining a commitment to invest in communities<br />
where we operate. It also means seeking out<br />
opportunities to increase our competitiveness<br />
through addressing sustainability impacts and by<br />
better meeting society’s needs and expectations.<br />
For instance, in response to the challenges posed<br />
by climate change and scarce natural resources,<br />
our businesses apply technology to produce energy<br />
efficiently in greener ways, create innovative<br />
solutions for clean sustainable water and recover<br />
resources from waste. Our new woodchip-fuelled<br />
biomass steam production plant in Singapore that<br />
was completed in <strong>2011</strong> is a case in point. The plant<br />
produces process steam for our customers on Jurong<br />
Island from waste wood collected and processed by<br />
our solid waste collection business and enhances our<br />
competitiveness on the petrochemical hub.<br />
Meanwhile, in the communities where we<br />
operate, we continue to support causes relating to<br />
the environment, children and education, sports and<br />
the elderly. In <strong>2011</strong>, we were also heartened by the<br />
recognition we received for efforts in carrying out our<br />
business responsibly. During the year, <strong>Sembcorp</strong> was<br />
selected as an index component of the Dow Jones<br />
Sustainability Asia Pacific Index. This index represents<br />
the top 20% of the largest 600 companies in the<br />
Asia Pacific developed region based on long-term<br />
economic, environmental and social criteria.<br />
<strong>Sembcorp</strong> is honoured to be one of only four<br />
Singapore companies selected for this index.<br />
Acknowledgements<br />
We would like to take this opportunity to<br />
record our deep appreciation to Richard Hale and<br />
Lee Suet Fern, who retired from the board at the<br />
last annual general meeting. Mr Hale served as an<br />
independent director of the company for over<br />
10 years, chairing the board’s Audit and Risk<br />
Committees, while Mrs Lee served as an independent<br />
director and a member of the board’s Audit and Risk<br />
Committees for over five years. We thank Mr Hale<br />
and Mrs Lee for their invaluable contributions during<br />
their time with us.<br />
We would also like to extend a warm welcome<br />
to Tham Kui Seng, who joined our board as an<br />
independent director during the year. Formerly the<br />
Chief Corporate Officer of CapitaLand, Mr Tham<br />
brings to the board a strong background in<br />
management in various industries, including a<br />
decade’s experience in the real estate business.<br />
Our thanks must also go to our shareholders, for<br />
your continued confidence in <strong>Sembcorp</strong>. While there<br />
may be further global economic challenges ahead,<br />
we remain confident of <strong>Sembcorp</strong>’s future. We have<br />
robust and resilient businesses. We have strong<br />
operational and technological capabilities and<br />
enviable market positions established in key markets<br />
around the world. We have a healthy pipeline of<br />
projects and will continue to make every effort to<br />
build platforms for our future growth.<br />
Last but not least, we turn to <strong>Sembcorp</strong>’s talented<br />
team of employees around the world. <strong>Sembcorp</strong>’s<br />
ability to deliver outstanding performance and<br />
sustainable value depends on their commitment,<br />
expertise and creativity in providing essential solutions<br />
to our customers. On behalf of the board, we would<br />
like to thank them for their steadfast contribution<br />
and dedication in <strong>2011</strong>. As <strong>Sembcorp</strong> meets<br />
tomorrow’s needs and grows sustainable businesses,<br />
this committed team will remain the foundation of<br />
your company’s success.<br />
Ang Kong Hua<br />
Chairman<br />
February 27, 2012<br />
Tang Kin Fei<br />
Group President & CEO<br />
February 27, 2012<br />
14 SEMBCORP INDUSTRIES ANNUAL REPORT <strong>2011</strong> GROWING SUSTAINABLE BUSINESSES 15
GROUP FINANCIAL HIGHLIGHTS<br />
<strong>2011</strong> 2010 Change (%)<br />
For The Year (S$ million)<br />
Turnover 9,047 8,764 3<br />
Earnings before interest, tax, depreciation and amortisation 1,336 1,478 (10)<br />
Profit from operations 1,272 1,396 (9)<br />
– Earnings before interest and tax 1,101 1,236 (11)<br />
– Share of results: Associates & JVs, net of tax 171 160 7<br />
Profit before income tax expense 1,271 1,367 (7)<br />
Net profit 809 793 2<br />
Capital expenditure and equity investment 1,290 982 31<br />
At Year End (S$ million)<br />
Shareholders’ funds 4,115 3,815 8<br />
Total assets 11,753 10,892 8<br />
Net debt / (cash) (811) (1,745) (54)<br />
Operating cash flow 975 1,702 (43)<br />
Free cash flow 866 1,684 (49)<br />
Per Share<br />
Earnings (cents) 45.32 44.44 2<br />
Net assets (S$) 2.31 2.13 8<br />
Net ordinary dividends (including bonus dividends) (cents) 17.00 17.00 –<br />
Group Quarterly Performance (S$ million)<br />
<strong>2011</strong> 2010<br />
1Q 2Q 3Q 4Q Total 1Q 2Q 3Q 4Q Total<br />
Turnover 2,003 2,166 2,632 2,246 9,047 2,406 2,135 2,154 2,069 8,764<br />
Earnings before interest, tax,<br />
depreciation and amortisation 297 309 362 368 1,336 285 308 464 421 1,478<br />
Profit from operations 275 296 355 346 1,272 263 292 444 397 1,396<br />
– Earnings before interest and tax 240 253 304 304 1,101 234 257 404 341 1,236<br />
– Share of results: Associates & JVs,<br />
net of tax 35 43 51 42 171 29 35 40 56 160<br />
Profit before income tax expense 262 283 384 342 1,271 267 288 377 435 1,367<br />
Net profit 160 175 222 252 809 159 161 244 229 793<br />
Earnings per share (cents) 8.95 9.80 12.45 14.12 45.32 8.91 9.04 13.69 12.80 44.44<br />
Turnover (S$ million)<br />
10,000<br />
8,000<br />
8,764<br />
9,047<br />
PFO (S$ million)<br />
1,500<br />
1,200<br />
1,396<br />
1,272<br />
Net Profit (S$ million)<br />
1,000<br />
800<br />
793<br />
809<br />
Financial Ratios<br />
Return on equity (%) 20.4 22.2 (8)<br />
Return on total assets (%) 10.7 12.2 (12)<br />
Interest cover (times) 20.3 24.2 (16)<br />
Net gearing (times) Net cash Net cash NM<br />
6,000<br />
900<br />
600<br />
Economic value added (S$ million) 728 809 (10)<br />
4,000<br />
600<br />
400<br />
2,000<br />
300<br />
200<br />
0<br />
2010 <strong>2011</strong><br />
0<br />
2010 <strong>2011</strong><br />
0<br />
2010 <strong>2011</strong><br />
First Quarter Second Quarter Third Quarter Fourth Quarter<br />
16 SEMBCORP INDUSTRIES ANNUAL REPORT <strong>2011</strong> GROWING SUSTAINABLE BUSINESSES 17
FIVE-YEAR PERFORMANCE PROFILE<br />
<strong>2011</strong><br />
The Group delivered a strong<br />
performance in <strong>2011</strong>. Net profit<br />
attributable to shareholders<br />
of the company (net profit)<br />
for the full year grew 2% from<br />
S$792.9 million in 2010 to<br />
S$809.3 million, while turnover<br />
was up 3% from S$8.8 billion in<br />
the previous year to S$9.0 billion.<br />
Our main profit contributors<br />
continued to be our Utilities and<br />
Marine businesses, which<br />
accounted for 92% of Group net<br />
profit. Our Utilities business<br />
delivered robust profit growth in<br />
<strong>2011</strong>, with net profit growing<br />
32% to S$304.4 million. Record<br />
profits for the business were<br />
driven by good operating<br />
performance in Singapore,<br />
China and the Middle East &<br />
Africa. The Marine business’<br />
contribution to net profit was<br />
13% lower at S$456.2 million<br />
mainly due to fewer jack-up and<br />
semi-submersible rig projects. This<br />
was offset by the higher interest<br />
income received in <strong>2011</strong> for<br />
deferred payment granted to<br />
customers and write-back of prior<br />
years’ tax over-provisions.<br />
2010<br />
<strong>Sembcorp</strong>’s net profit for the<br />
year grew 16% from S$682.7<br />
million to S$792.9 million,<br />
while turnover was S$8.8 billion<br />
compared to S$9.6 billion in 2009.<br />
The Utilities business’ net<br />
profit improved by 2% to<br />
S$231.3 million with all regions<br />
registering growth except for<br />
operations in Teesside, UK, while<br />
the Marine business’ contribution<br />
to net profit grew 22% to<br />
S$524.9 million.<br />
During the year, the Group<br />
recorded an exceptional gain<br />
of S$32.1 million comprising<br />
the Group’s share of the Marine<br />
business’ full and final amicable<br />
settlement of disputed foreign<br />
exchange transactions.<br />
2009<br />
<strong>Sembcorp</strong>’s net profit for the<br />
year grew 35% from S$507.1<br />
million to S$682.7 million, while<br />
turnover stood at S$9.6 billion.<br />
The Marine business’<br />
contribution to net profit grew<br />
63% from S$263.7 million to<br />
S$430.2 million, attributable<br />
to a combination of operational<br />
efficiency and execution of<br />
projects ahead of schedule<br />
resulting in better margins and<br />
the resumption of margin<br />
recognition for some of the<br />
business’ projects. The Utilities<br />
business’ net profit grew by<br />
12% from S$202.4 million to<br />
S$226.7 million, with operations<br />
in Singapore, China, Vietnam<br />
and the UAE showing growth.<br />
2008<br />
<strong>Sembcorp</strong>’s turnover increased<br />
by 15% from S$8.6 billion to<br />
S$9.9 billion. Net profit for the<br />
year stood at S$507.1 million.<br />
Excluding the one-off write-back<br />
of S$48.0 million of tax provisions<br />
recorded in 2007, <strong>Sembcorp</strong><br />
achieved a net profit growth<br />
of 6%.<br />
The Marine business’<br />
contribution to net profit rose<br />
75% to S$263.7 million, mainly<br />
due to higher revenue and<br />
operating margins from its rig<br />
building and ship repair<br />
businesses. The Utilities business’<br />
net profit stood at S$202.4 million<br />
mainly due to contributions from<br />
our Singapore and UK operations.<br />
During the year, the Group<br />
recorded an exceptional loss<br />
of S$26.9 million comprising<br />
the Group’s share of the Marine<br />
business’ foreign exchange losses<br />
from unauthorised transactions.<br />
2007<br />
<strong>Sembcorp</strong> achieved a<br />
6% growth in turnover to<br />
S$8.6 billion. Net profit in 2007<br />
stood at S$526.2 million. Strong<br />
business fundamentals continued<br />
to drive <strong>Sembcorp</strong>’s growth,<br />
backed by positive operating<br />
performance from the Utilities<br />
business’ Singapore and UK<br />
operations and the Marine<br />
unit’s rig building and ship<br />
repair businesses.<br />
The Group recorded a net<br />
exceptional loss of S$31.0 million<br />
during the year, which comprised<br />
the Group’s share of losses<br />
recognised by the Marine<br />
business’ unauthorised foreign<br />
exchange transactions, partially<br />
offset by gains on the sale of<br />
certain investments.<br />
Five-Year Financials<br />
<strong>2011</strong> 2010 2009 2008 2007<br />
For The Year (S$ million)<br />
Turnover 9,047 8,764 9,572 9,928 8,619<br />
Earnings before interest, tax, depreciation<br />
and amortisation 1,336 1,478 1,316 940 824<br />
Profit from operations 1,272 1,396 1,225 871 794<br />
– Earnings before interest and tax 1,101 1,236 1,116 745 641<br />
– Share of results: Associates & JVs, net of tax 171 160 109 126 153<br />
Profit before income tax expense 1,271 1,367 1,218 862 787<br />
Net profit 809 793 683 507 526<br />
At Year End (S$ million)<br />
Property, plant and equipment<br />
and investment properties 4,273 3,463 2,721 2,525 2,633<br />
Other non-current assets 2,263 2,064 1,616 1,372 1,691<br />
Net current assets 1,520 1,900 1,061 374 863<br />
Non-current liabilities (2,815) (2,407) (1,162) (1,006) (1,357)<br />
Net assets 5,241 5,020 4,236 3,265 3,830<br />
Share capital and reserves 4,115 3,815 3,320 2,594 3,033<br />
Non-controlling interests 1,126 1,205 916 671 797<br />
Total equity 5,241 5,020 4,236 3,265 3,830<br />
Per Share<br />
Earnings (cents) 45.32 44.44 38.37 28.50 29.57<br />
Net assets (S$) 2.31 2.13 1.86 1.46 1.70<br />
Net ordinary dividends (including bonus dividends) (cents) 17.00 17.00 15.00 11.00 15.00<br />
Financial Ratios<br />
Return on equity (%) 20.4 22.2 23.1 18.0 18.0<br />
Return on total assets (%) 10.7 12.2 11.9 9.0 8.7<br />
Interest cover (times) 20.3 24.2 31.9 21.2 15.3<br />
Net gearing (times) Net cash Net cash Net cash Net cash 0.01<br />
18 SEMBCORP INDUSTRIES ANNUAL REPORT <strong>2011</strong> GROWING SUSTAINABLE BUSINESSES 19
FIVE-YEAR PERFORMANCE PROFILE<br />
Turnover (S$ million)<br />
Net Profit (S$ million)<br />
Review by Business (S$ million)<br />
10,000<br />
8,000<br />
6,000<br />
4,000<br />
2,000<br />
8,619<br />
9,928<br />
9,572<br />
8,764<br />
9,047<br />
1,000<br />
800<br />
600<br />
400<br />
200<br />
526<br />
507<br />
683<br />
793<br />
809<br />
Turnover by Activity<br />
<strong>2011</strong> % 2010 % 2009 % 2008 % 2007 %<br />
Utilities 4,893 54 3,993 46 3,680 38 4,692 47 3,941 45<br />
Marine 3,957 44 4,554 52 5,723 60 5,061 51 4,512 53<br />
Integrated Urban Development 9 – 16 – 15 – 16 – 23 –<br />
Others / Corporate 188 2 201 2 154 2 159 2 143 2<br />
Total 9,047 100 8,764 100 9,572 100 9,928 100 8,619 100<br />
0<br />
2007 2008<br />
EBITDA (S$ million)<br />
2009<br />
2010<br />
<strong>2011</strong><br />
0<br />
2007 2008 2009 2010<br />
Net Ordinary Dividends Per Share (cents)<br />
<strong>2011</strong><br />
Profit from Operations by Activity<br />
Utilities 421 33 314 22 307 25 313 36 363 46<br />
Marine 793 62 1,045 75 878 72 531 61 351 44<br />
Integrated Urban Development 46 4 40 3 34 3 35 4 84 11<br />
Others / Corporate 12 1 (3) – 6 – (8) (1) (4) (1)<br />
Total 1,272 100 1,396 100 1,225 100 871 100 794 100<br />
1,500<br />
1,200<br />
900<br />
600<br />
300<br />
824<br />
940<br />
1,316<br />
1,478<br />
1,336<br />
20<br />
15<br />
10<br />
5<br />
15.00<br />
11.00<br />
15.00<br />
17.00<br />
17.00<br />
Net<br />
ofit Pr ctivity by A<br />
Utilities 304 38 231 29 227 33 202 40 244 46<br />
Marine 456 56 525 66 430 63 264 52 150 29<br />
Integrated Urban Development 39 5 37 5 28 4 32 6 73 14<br />
Others / Corporate 10 1 – – (2) – 9 2 59 11<br />
Total 809 100 793 100 683 100 507 100 526 100<br />
0<br />
2007<br />
2008<br />
2009<br />
2010<br />
<strong>2011</strong><br />
0<br />
2007 2008 2009 2010<br />
Bonus dividends of 2 cents per share<br />
<strong>2011</strong><br />
PFO (S$ million)<br />
ROE (%)<br />
1,500<br />
1,200<br />
900<br />
794<br />
871<br />
1,225<br />
1,396<br />
1,272<br />
30<br />
20<br />
18.0<br />
18.0<br />
23.1<br />
22.2<br />
20.4<br />
600<br />
10<br />
300<br />
0<br />
2007<br />
2008<br />
2009<br />
2010<br />
<strong>2011</strong><br />
0<br />
2007<br />
2008<br />
2009<br />
2010<br />
<strong>2011</strong><br />
20 SEMBCORP INDUSTRIES ANNUAL REPORT <strong>2011</strong> GROWING SUSTAINABLE BUSINESSES 21
SIGNIFICANT EVENTS<br />
January<br />
<strong>Sembcorp</strong>’s Australian solid waste<br />
management associate, SembSITA<br />
Australia, completes its A$235<br />
million acquisition of WSN<br />
Environmental Solutions, a solid<br />
waste management service<br />
provider formerly owned by the<br />
New South Wales government.<br />
<strong>Sembcorp</strong> Marine’s Sembawang<br />
Shipyard secures a newbuilding<br />
and three major upgrading<br />
contracts totalling S$215 million.<br />
<strong>Sembcorp</strong> Marine’s PPL Shipyard<br />
signs a turnkey contract worth<br />
up to US$182 million to build<br />
a jack-up rig, the first of a series<br />
of three jack-up options, for<br />
Atwood Oceanics Pacific.<br />
February<br />
<strong>Sembcorp</strong> commences<br />
construction of its 49%-owned<br />
Indian power plant project, a<br />
1,320-megawatt coal-fired power<br />
plant applying high efficiency<br />
supercritical technology<br />
in Andhra Pradesh, India.<br />
<strong>Sembcorp</strong> awards the engineering,<br />
procurement and construction<br />
contract for the development of<br />
its second cogeneration plant on<br />
Jurong Island. The 800-megawatt<br />
plant is set to double <strong>Sembcorp</strong>’s<br />
total power generation capacity<br />
in Singapore when fully completed.<br />
March<br />
<strong>Sembcorp</strong> Marine’s Jurong<br />
Shipyard secures a US$450 million<br />
contract to build a harshenvironment<br />
jack-up rig<br />
for Seadrill.<br />
<strong>Sembcorp</strong> signs up Nokia as a<br />
long-term tenant in its third<br />
Vietnam Singapore Industrial Park<br />
(VSIP) project, VSIP Bac Ninh<br />
Integrated Township and Industrial<br />
Park. The world’s leading<br />
manufacturer of mobile devices<br />
will occupy 17 hectares for its<br />
new manufacturing plant, its first<br />
in Southeast Asia.<br />
<strong>Sembcorp</strong> Marine’s Jurong Shipyard<br />
signs two turnkey contracts<br />
totalling US$427.6 million to build<br />
two jack-up rigs for a subsidiary<br />
of Noble Corporation.<br />
<strong>Sembcorp</strong> Marine’s Sembawang<br />
Shipyard secures a long-term<br />
alliance contract to provide ship<br />
repair, refurbishment, upgrading<br />
and related services to Teekay<br />
Marine Services.<br />
April<br />
<strong>Sembcorp</strong> signs a letter of intent<br />
with Jinan Quancheng Water<br />
to explore the formation of a<br />
joint venture to build, own and<br />
operate water treatment plants<br />
in the east of Jinan city, Shandong<br />
province, China.<br />
<strong>Sembcorp</strong> signs a memorandum<br />
of understanding with the Rizhao<br />
Municipal People’s Government<br />
to explore the feasibility of a<br />
638-hectare international marine<br />
city in Shandong province, China.<br />
<strong>Sembcorp</strong> is named Water<br />
Company of the Year at the<br />
prestigious Global Water<br />
Intelligence’s <strong>2011</strong> Global Water<br />
Awards. <strong>Sembcorp</strong> also clinches<br />
the Desalination Deal of the Year<br />
award for its Salalah Independent<br />
Water and Power Plant in Oman.<br />
Bobby Chin takes over as chairman<br />
of the board’s Audit Committee.<br />
<strong>Sembcorp</strong> Marine’s Jurong<br />
Shipyard secures an approximately<br />
S$20 million contract to convert<br />
a LNG tanker into a FSRU for<br />
Golar LNG Energy.<br />
June<br />
Tham Kui Seng joins the board<br />
as an independent director.<br />
<strong>Sembcorp</strong> establishes a<br />
wholly-owned holding company<br />
in Shanghai, <strong>Sembcorp</strong><br />
(China) Holding Co, to be<br />
its regional headquarters.<br />
July<br />
<strong>Sembcorp</strong> commences<br />
construction of its new 9,600<br />
cubic metres per day industrial<br />
wastewater treatment plant in<br />
Banyan, the new growth area<br />
of Jurong Island.<br />
<strong>Sembcorp</strong> signs four memoranda<br />
of understanding to explore<br />
expanding its utilities business<br />
in China with municipal and<br />
industrial water projects.<br />
<strong>Sembcorp</strong> wins the Sustainable<br />
Business Award (Enterprise<br />
category) at the <strong>2011</strong> Singapore<br />
Sustainability Awards.<br />
<strong>Sembcorp</strong> Marine’s SMOE secures<br />
a contract close to S$600 million<br />
to build an integrated processing<br />
and living quarters platform for<br />
PTTEP International Limited.<br />
<strong>Sembcorp</strong> successfully completes<br />
the first phase of its US$1 billion<br />
Salalah Independent Water and<br />
Power Plant in Oman and begins<br />
dispatching 61 megawatts of net<br />
power, on schedule, to the Dhofar<br />
power grid.<br />
<strong>Sembcorp</strong> is awarded Gold<br />
for Best <strong>Annual</strong> <strong>Report</strong>, for<br />
companies with S$1 billion<br />
and above in market<br />
capitalisation, at the Singapore<br />
Corporate Awards <strong>2011</strong>.<br />
<strong>Sembcorp</strong>’s solid waste<br />
management subsidiary clinches<br />
a S$121 million, seven-year<br />
contract by the National<br />
Environment Agency to provide<br />
refuse collection and recycling<br />
services to the Bedok sector<br />
in Singapore.<br />
August<br />
<strong>Sembcorp</strong> Marine’s Sembawang<br />
Shipyard exercises its option to<br />
increase its shareholding in<br />
Sembmarine Kakinada to 40%,<br />
and extends the technical<br />
management and services<br />
agreement to operate and manage<br />
the joint venture to 10 years.<br />
<strong>Sembcorp</strong> Marine’s Jurong<br />
Shipyard signs a US$444 million<br />
contract to build two premium<br />
jack-up rigs for a subsidiary<br />
of Noble Corporation, and<br />
secures options for a further<br />
two jack-up rigs.<br />
September<br />
<strong>Sembcorp</strong> is selected as an index<br />
component of the Dow Jones<br />
Sustainability Asia Pacific Index<br />
for <strong>2011</strong>, which ranks the top<br />
20% in terms of sustainability<br />
out of the largest 600 companies<br />
in the developed Asia Pacific<br />
markets. <strong>Sembcorp</strong> is one of<br />
only four Singapore companies<br />
included in this index.<br />
<strong>Sembcorp</strong>’s associate, Singapore-<br />
Sichuan Investment Holdings,<br />
signs an Investment Corporation<br />
Agreement to co-develop<br />
the new Singapore-Sichuan<br />
Hi-tech Innovation Park in<br />
Chengdu, China.<br />
<strong>Sembcorp</strong>’s VSIP joint venture<br />
signs a memorandum of<br />
understanding to explore a fifth<br />
integrated urban development<br />
in central Vietnam’s Quang<br />
Ngai province.<br />
<strong>Sembcorp</strong> signs three memoranda<br />
of understanding to explore<br />
further collaboration on<br />
utilities projects in Liaoning<br />
province, China.<br />
October<br />
<strong>Sembcorp</strong> Marine’s Jurong<br />
Shipyard secures an approximately<br />
S$130 million project to convert<br />
a VLCC tanker to a FPSO vessel<br />
for MODEC.<br />
<strong>Sembcorp</strong> Marine’s SMOE secures<br />
an approximately US$100 million<br />
contract, which may potentially<br />
increase to more than US$150<br />
million, for the module assembly<br />
of an Australia Pacific LNG facility.<br />
<strong>Sembcorp</strong> signs a letter of intent<br />
to explore forming a joint venture<br />
to build, own and operate an<br />
industrial wastewater treatment<br />
plant in the Qidong LVSI Coastal<br />
Economic Development Zone in<br />
Jiangsu province, China.<br />
<strong>Sembcorp</strong> signs a memorandum<br />
of understanding with the Wuxi<br />
Municipal People’s Government to<br />
deepen and expand cooperation<br />
in China’s Jiangsu province as well<br />
as internationally.<br />
22 SEMBCORP INDUSTRIES ANNUAL REPORT <strong>2011</strong> GROWING SUSTAINABLE BUSINESSES 23
SIGNIFICANT EVENTS<br />
<strong>Sembcorp</strong> is named the Most<br />
Transparent Company in the<br />
multi-industry / conglomerates<br />
category at the Securities Investors<br />
Association (Singapore) Investors’<br />
Choice Awards <strong>2011</strong> for the<br />
third year running. <strong>Sembcorp</strong><br />
Marine is named the Most<br />
Transparent Company under<br />
the award’s non-electronics<br />
manufacturing category.<br />
<strong>Sembcorp</strong> Marine’s Sembawang<br />
Shipyard secures a US$300 million<br />
FSO tanker conversion contract<br />
from Mobil Cepu.<br />
November<br />
<strong>Sembcorp</strong> is ranked joint second<br />
for “Best for Shareholders’ Rights<br />
and Equitable Treatment in<br />
Singapore” in Asiamoney’s<br />
Corporate Governance Poll <strong>2011</strong>.<br />
<strong>Sembcorp</strong> Marine is ranked second<br />
for “Best for Responsibilities<br />
of Management and the Board<br />
of Directors in Singapore”.<br />
December<br />
<strong>Sembcorp</strong> opens its first industrial<br />
water reclamation plant in China.<br />
The award-winning project,<br />
located in the Zhangjiagang Free<br />
Trade Port Zone, is a Governmentto-Government<br />
showcase for best<br />
practice in integrated industrial<br />
water management.<br />
<strong>Sembcorp</strong> Marine’s Jurong<br />
Shipyard secures a US$291.6<br />
million contract to build an<br />
accommodation semi-submersible<br />
rig with options for another two<br />
units from Prosafe.<br />
<strong>Sembcorp</strong> Marine’s Sembawang<br />
Shipyard secures a US$140 million<br />
contract to convert a ropax<br />
vessel to a DP2 accommodation<br />
and repair vessel for Equinox<br />
Offshore Accommodation.<br />
<strong>Sembcorp</strong> Marine’s Jurong<br />
Shipyard breaks ground for its<br />
first overseas Integrated New<br />
Yard Facility, Estaleiro Jurong<br />
Aracruz, in the state of Espirito<br />
Santo, Brazil.<br />
OPERATING<br />
& FINANCIAL<br />
REVIEW<br />
Company Overview 26<br />
Business Description 26<br />
Objective & Strategies 26<br />
Group Structure 30<br />
Group Review 32<br />
Overview 32<br />
Turnover 32<br />
Net Profit 32<br />
Cash Flow and Liquidity 32<br />
Financial Position 33<br />
Shareholder Returns 34<br />
Economic Value Added 34<br />
Value Added and Productivity Data 34<br />
Critical Accounting Policies 34<br />
Financial Risk Management 34<br />
Treasury Management 34<br />
Facilities 34<br />
Borrowings 37<br />
Utilities Review 43<br />
Marine Review 49<br />
Integrated Urban Development Review 55<br />
24 SEMBCORP INDUSTRIES ANNUAL REPORT <strong>2011</strong> GROWING SUSTAINABLE BUSINESSES 25
COMPANY OVERVIEW<br />
<strong>Sembcorp</strong>’s aim is to provide shareholder value by focusing on<br />
businesses that deliver recurring earnings and have the ability<br />
to sustain growth over the long term.<br />
Business Description<br />
<strong>Sembcorp</strong> <strong>Industries</strong> is a Singapore-listed company<br />
with assets totalling more than S$11 billion. The<br />
Group is primarily involved in the following businesses:<br />
Utilities<br />
Marine<br />
Integrated Urban Development<br />
The Utilities business provides energy and water<br />
to industrial and municipal customers. It operates<br />
in 14 countries with an established presence in Asia<br />
and a strong growing presence in emerging markets<br />
around the world. Key activities in the energy sector<br />
include power generation and retail, process steam<br />
production and supply, as well as natural gas import,<br />
supply and retail. In the water sector, the business<br />
offers wastewater treatment, as well as the<br />
production and supply of reclaimed, desalinated and<br />
potable water as well as water for industrial use.<br />
Together with energy and water, the business also<br />
offers on-site logistics as part of a bundled offer<br />
to industrial customers, as well as solid waste<br />
management in Singapore, Australia and India.<br />
The Marine business has a strong global<br />
reputation and 49 years’ proven track record<br />
in providing integrated solutions in ship repair,<br />
shipbuilding, ship conversion, rig building and<br />
offshore engineering and construction, including<br />
topsides fabrication. Its global network of shipyards<br />
spans Singapore, Brazil, China, Indonesia, India<br />
and the USA.<br />
The Integrated Urban Development (formerly<br />
known as Industrial Parks) business owns, develops,<br />
markets and manages integrated urban developments<br />
comprising industrial parks as well as business,<br />
commercial and residential space in Vietnam, China<br />
and Indonesia. The business offers an integrated<br />
approach to delivering urban work and living<br />
environments that will attract local and international<br />
investments. With a track record of more than 20<br />
years undertaking master planning, land preparation<br />
and infrastructure development, and transforming<br />
raw land into large scale urban developments, the<br />
business stands in good stead to capitalise on<br />
urbanisation trends in developing countries.<br />
Objective & Strategies<br />
<strong>Sembcorp</strong>’s aim is to provide shareholder value by<br />
focusing on businesses that deliver recurring earnings<br />
and have the ability to sustain growth over the long<br />
term. The Group pursues five strategic directions:<br />
Focus on key businesses<br />
<strong>Sembcorp</strong> maintains a focus on our key energy,<br />
water, marine and integrated urban development<br />
businesses, which offer strong fundamentals.<br />
Coupled with our solid operational and management<br />
capabilities and a disciplined approach towards<br />
investment, we believe that focusing on our key<br />
businesses will enable us to continue delivering<br />
long-term value to our shareholders.<br />
Build upon business models<br />
<strong>Sembcorp</strong> has developed and will continue to build<br />
on strong business models in each of our businesses.<br />
Our Utilities business has established itself as a<br />
leading energy and water player. We have a strong<br />
track record in supplying power, steam and natural<br />
gas to industrial customers and to the grid, and are<br />
a trusted provider of total water and wastewater<br />
solutions to both industries and households.<br />
Leveraging on our expertise in energy and water,<br />
we have established a niche as a global leader for<br />
the provision of energy, water and on-site logistics<br />
to customers in energy-intensive industrial sites. We<br />
also have a proven track record as a developer, owner<br />
and operator of large scale combined power and<br />
water plants.<br />
Meanwhile, our Marine business has built up<br />
a global brand name with a comprehensive range<br />
of capabilities encompassing various segments of<br />
the value chain in the global marine and offshore<br />
industry. Its orderbook provides earnings visibility<br />
while long-term strategic alliances with international<br />
ship operators provide a steady and growing<br />
baseload in ship repair.<br />
Our Integrated Urban Development unit takes<br />
an integrated approach to the development of urban<br />
work and living environments. Its early involvement<br />
in the development of industrial, residential, business<br />
and commercial areas also provides potential<br />
opportunities for the provision of utilities and other<br />
urban solutions.<br />
Leverage capabilities for growth<br />
<strong>Sembcorp</strong> believes that only businesses with clear<br />
competitive edge and leading market positions can<br />
deliver sustainable growth. To this end, we continue<br />
to leverage the unique capabilities and processes we<br />
have built up in each of our businesses, harnessing<br />
technology and innovation to further enhance our<br />
competitive advantage.<br />
Our businesses operate in synergy and build<br />
upon each business’ established relationships and<br />
successes. With this integrated approach to business,<br />
we are able to tap on the strengths of our various<br />
businesses to enhance the Group’s competitive<br />
position. We apply this strength in integration to<br />
our new acquisitions, successfully integrating them<br />
within the Group to reap the benefits of mergers<br />
and acquisitions and provide even more value for<br />
our customers and shareholders.<br />
In our energy business, we apply technologies<br />
for greater efficiency and lower emissions, such as<br />
combined cycle gas turbine, cogeneration and<br />
combined power and desalination technologies. We<br />
have also developed distinctive capabilities as<br />
operators of reliable and efficient water facilities<br />
serving both industrial customers as well as<br />
households. Our niche expertise in industrial water<br />
solutions includes applying energy-efficient and<br />
environmentally-friendly technologies for the<br />
treatment of complex high concentration wastewater<br />
from multiple sources, as well as the production of<br />
water through desalination and water reclamation.<br />
We also provide essential municipal water services<br />
to over five million people worldwide.<br />
Meanwhile, our Marine business’ proprietary<br />
technologies and designs for rigs, drillships and<br />
vessels allow us to serve our customers with<br />
technologically-advanced solutions. Our trusted<br />
brand name and reputation for quality and on-time<br />
delivery also strengthen our position as one of the<br />
leading players in the global market.<br />
Our Integrated Urban Development business’<br />
integrated approach to designing self-sufficient<br />
urban developments, featuring world-class industrial,<br />
business, commercial and residential space,<br />
demonstrates capabilities which offer us a<br />
competitive advantage. This includes the business’<br />
credibility and track record in the development<br />
of raw land, including master planning, land<br />
preparation and infrastructure development, and the<br />
ability to extract further value by undertaking the<br />
selective development of commercial and residential<br />
real estate at choice sites.<br />
With industrialisation and urbanisation, the<br />
world’s demand for energy, water and other urban<br />
solutions continues to grow. As a provider of these<br />
essential solutions, <strong>Sembcorp</strong> is well-positioned with<br />
the right businesses and in the right places to benefit<br />
from these growth trends and seize opportunities<br />
in growing markets.<br />
26 SEMBCORP INDUSTRIES ANNUAL REPORT <strong>2011</strong> GROWING SUSTAINABLE BUSINESSES 27
COMPANY OVERVIEW<br />
Develop new income streams<br />
<strong>Sembcorp</strong> is committed to developing our<br />
core businesses to generate new income streams.<br />
We seek to expand in tandem with demand through<br />
strategic partnerships with our customers, providing<br />
essential solutions to meet their needs. We also look<br />
to new markets where there is a demand for our<br />
services. To provide a platform for future growth,<br />
we continue to identify and develop a pipeline of<br />
greenfield and brownfield investments. Applying<br />
a disciplined approach, we aim to build leading<br />
positions in growth markets through selective<br />
acquisitions and partnerships. To support the world’s<br />
continued development amidst rising urbanisation<br />
and population growth, we also actively invest in<br />
sustainability and green business lines which will give<br />
us an edge in an increasingly resource-scarce world.<br />
Build on strong brand name<br />
At <strong>Sembcorp</strong>, we aim to capitalise on the<br />
strength and reliability associated with our brand.<br />
Through understanding the needs of our customers<br />
and leveraging on group strength and sector<br />
expertise, we deliver solutions that enable them to<br />
do business better and enhance the quality of life.<br />
<strong>Sembcorp</strong>’s combined power and desalination plant in Fujairah, UAE<br />
28 SEMBCORP INDUSTRIES ANNUAL REPORT <strong>2011</strong>
GROUP STRUCTURE<br />
SEMBCORP INDUSTRIES<br />
UTILITIES<br />
<strong>Sembcorp</strong> Utilities 100%<br />
SINGAPORE<br />
<strong>Sembcorp</strong> Cogen 100%<br />
<strong>Sembcorp</strong> Power 100%<br />
<strong>Sembcorp</strong> Gas 70%<br />
Sakra Island Carbon Dioxide 30%<br />
<strong>Sembcorp</strong> NEWater 100%<br />
CHINA<br />
<strong>Sembcorp</strong> Utilities Investment<br />
Management (Shanghai) 100%<br />
<strong>Sembcorp</strong> (China) Holding Co 100%<br />
Shanghai Cao Jing Co-generation Co 30%<br />
<strong>Sembcorp</strong> Nanjing SUIWU Co 95%<br />
<strong>Sembcorp</strong> NCIP Water Co 95%<br />
Zhangjiagang Free Trade Zone<br />
<strong>Sembcorp</strong> Water Co 80%<br />
Zhangjiagang Free Trade Zone <strong>Sembcorp</strong><br />
Water Recycling Co 80%<br />
Yancheng China Water Co 48.2%<br />
<strong>Sembcorp</strong> Tianjin Lingang Industrial<br />
Area Wastewater Treatment Co 90%<br />
<strong>Sembcorp</strong> Sanhe Yanjiao Water Co 92.7%<br />
Shenyang <strong>Sembcorp</strong> Water Co 80%<br />
<strong>Sembcorp</strong> Xinmin Water Co 89.4%<br />
Qitaihe <strong>Sembcorp</strong> Water Co 89.4%<br />
<strong>Sembcorp</strong> Qinzhou Water Co 80%<br />
Fuzhou <strong>Sembcorp</strong> Water Co 70.8%<br />
Zhumadian China Water Co 50.1%<br />
INDIA<br />
Thermal Powertech Corporation India 49%<br />
<strong>Sembcorp</strong> Gayatri O&M Co 70%<br />
<strong>Sembcorp</strong> Utilities India 100%<br />
INDONESIA<br />
PT Adhya Tirta Batam 49.2%<br />
PT Adhya Tirta Sriwijaya 39.3%<br />
OMAN<br />
<strong>Sembcorp</strong> Salalah Power and Water Co 60%<br />
<strong>Sembcorp</strong> Salalah O&M Services Co 70%<br />
UAE<br />
Emirates <strong>Sembcorp</strong> Water & Power Co 40%<br />
<strong>Sembcorp</strong> Gulf O&M Co 100%<br />
SOUTH AFRICA<br />
<strong>Sembcorp</strong> Silulumanzi 98.3%<br />
<strong>Sembcorp</strong> Siza Water 72.2%<br />
UK<br />
<strong>Sembcorp</strong> Utilities (UK) 100%<br />
<strong>Sembcorp</strong> Bournemouth Water 98.3%<br />
ANTIGUA<br />
<strong>Sembcorp</strong> (Antigua) Water 98.3%<br />
BONAIRE & CURAÇAO<br />
<strong>Sembcorp</strong> St Maarten Water 98.3%<br />
CHILE<br />
<strong>Sembcorp</strong> Aguas Chacabuco 98.3%<br />
<strong>Sembcorp</strong> Aguas Del Norte 98.3%<br />
<strong>Sembcorp</strong> Aguas Lampa 98.3%<br />
<strong>Sembcorp</strong> Aguas Santiago 98.3%<br />
PANAMA<br />
Aguas de Panama 98.3%<br />
<strong>Sembcorp</strong> Environment 100%<br />
SINGAPORE<br />
SembWaste 100%<br />
<strong>Sembcorp</strong> Tay Paper Recycling 60%<br />
AUSTRALIA<br />
SembSita Australia 40%<br />
MARINE<br />
<strong>Sembcorp</strong> Marine 60.60%<br />
SINGAPORE<br />
Jurong Shipyard 100%<br />
Sembawang Shipyard 100%<br />
PPL Shipyard 85%<br />
SMOE 100%<br />
Jurong SML 100%<br />
<strong>Sembcorp</strong> Marine Technology 100%<br />
BRAZIL<br />
Estaleiro Jurong Aracruz 100%<br />
Jurong do Brasil Prestação de Serviços 100%<br />
CHINA<br />
COSCO Shipyard Group 30%<br />
Shenzhen Chiwan Offshore Petroleum<br />
Equipment Repair & Manufacture Co 35%<br />
INDONESIA<br />
PT SMOE Indonesia 90%<br />
PT Karimun Sembawang Shipyard 100%<br />
INDIA<br />
SembMarine Kakinada 40%<br />
USA<br />
<strong>Sembcorp</strong>-Sabine Shipyard 100%<br />
INTEGRATED URBAN DEVELOPMENT<br />
<strong>Sembcorp</strong> Development # 100%<br />
VIETNAM<br />
Vietnam Singapore Industrial Park JV Co 40.4%<br />
Vietnam Singapore Industrial Park & Township<br />
Development Joint Stock Co 40.3%<br />
VSIP Bac Ninh Co 40.3%<br />
VSIP Hai Phong Co 40.3%<br />
CHINA<br />
Wuxi-Singapore Industrial Park Development Co 45.4%<br />
Sino-Singapore Nanjing Eco Hi-tech Island<br />
Development Co 21.5%<br />
SINGAPORE<br />
Gallant Venture 23.9%<br />
Singapore-Sichuan Investment Holdings 50%<br />
<strong>Sembcorp</strong> Parks Management 56%<br />
OTHER BUSINESSES<br />
<strong>Sembcorp</strong> Design and Construction 100%<br />
Shenzhen Chiwan Sembawang<br />
Engineering Co 32%<br />
Singapore Precision <strong>Industries</strong> /<br />
Singapore Mint 100%<br />
This list of companies is not exhaustive.<br />
The Utilities business also includes the SUT and PPU divisions of <strong>Sembcorp</strong> <strong>Industries</strong>.<br />
Figures reflect shareholdings as at March 8, 2012.<br />
#<br />
<strong>Sembcorp</strong> Industrial Parks was renamed <strong>Sembcorp</strong> Development with effect from March 8, 2012.<br />
Shareholdings of companies listed under <strong>Sembcorp</strong> Utilities, <strong>Sembcorp</strong> Environment,<br />
<strong>Sembcorp</strong> Marine and <strong>Sembcorp</strong> Development reflect stakes held by the above entities.<br />
PHILIPPINES<br />
Subic Water and Sewerage Co 29.5%<br />
INDIA<br />
SembRamky Environmental Management 51%<br />
VIETNAM<br />
Phu My 3 BOT Power Co 33.3%<br />
30 SEMBCORP INDUSTRIES ANNUAL REPORT <strong>2011</strong> GROWING SUSTAINABLE BUSINESSES 31
GROUP REVIEW<br />
Performance Scorecard (S$ million)<br />
<strong>2011</strong> 2010 Change (%)<br />
Turnover (S$ million)<br />
2010 <strong>2011</strong><br />
PFO (S$ million)<br />
2010 <strong>2011</strong><br />
Net Profit (S$ million)<br />
2010 <strong>2011</strong><br />
Turnover 9,047.1 8,763.6 3<br />
EBITDA 1,335.9 1,478.0 (10)<br />
PFO 1,271.7 1,396.0 (9)<br />
– EBIT 1,101.1 1,235.9 (11)<br />
– Share of results: Associates & JVs, net of tax 170.6 160.1 7<br />
PBT 1,270.6 1,367.3 (7)<br />
Net profit 809.3 792.9 2<br />
EPS (cents) 45.3 44.4 2<br />
ROE (%) 20.4 22.2 (8)<br />
Overview<br />
<strong>Sembcorp</strong> delivered a strong performance<br />
in <strong>2011</strong>. Our robust operating performance<br />
demonstrated the strength of our businesses. The<br />
Group’s net profit attributable to shareholders of<br />
the company (net profit) in <strong>2011</strong> grew by 2% to<br />
S$809.3 million, while turnover was up 3% from<br />
S$8.8 billion in the previous year to S$9.0 billion.<br />
Turnover<br />
The Group achieved a turnover of S$9.0 billion,<br />
with the Utilities and Marine businesses contributing<br />
98% of total turnover.<br />
The Utilities business’ turnover increased by<br />
23%, mainly attributable to our Singapore operations<br />
where part of the revenue was indexed to higher<br />
High Sulphur Fuel Oil (HSFO) prices recorded during<br />
the year. Furthermore, we started receiving our<br />
second tranche of natural gas from West Natuna,<br />
Indonesia, in November <strong>2011</strong>, further boosting<br />
revenue during the year.<br />
The Marine business’ <strong>2011</strong> turnover decreased<br />
by 13% to S$4.0 billion mainly due to lower revenue<br />
recognition from rig building projects, as well as the<br />
resumption of revenue recognition on delivery of<br />
PetroRig III semi-submersible rig and the sale of a<br />
CJ-70 harsh environment jack-up rig in 2010. This<br />
was partially offset by higher revenue recognition<br />
from ship conversion and offshore projects.<br />
Net Profit<br />
Group net profit in <strong>2011</strong> grew 2% from<br />
S$792.9 million to S$809.3 million, while profit<br />
from operations was S$1,271.7 million compared<br />
to S$1,396.0 million in the previous year.<br />
Our Utilities business delivered robust profit<br />
growth in <strong>2011</strong>, with net profit growing 32%<br />
to S$304.4 million. Record profits for the business<br />
were driven by good operating performance in<br />
Singapore, China and the Middle East & Africa.<br />
Marine’s <strong>2011</strong> net profit contribution to the Group<br />
was S$456.2 million compared to S$524.9 million<br />
in 2010. The Marine business’ net profit was lower<br />
mainly due to fewer jack-up and semi-submersible<br />
rig projects. The Integrated Urban Development<br />
business’ higher net profit in <strong>2011</strong> was primarily<br />
due to higher land sales recognised.<br />
Cash Flow and Liquidity<br />
As at December 31, <strong>2011</strong>, the Group’s cash<br />
and cash equivalents stood at S$3.0 billion.<br />
Cash flows from operating activities before<br />
changes in working capital decreased from<br />
S$1,440.2 million in 2010 to S$1,380.8 million<br />
in <strong>2011</strong>. Net cash inflow from operating<br />
activities for <strong>2011</strong> was S$975.0 million compared<br />
to S$1,702.4 million in 2010, mainly due to<br />
Marine’s increase in working capital for the<br />
ongoing projects.<br />
Utilities 3,993 4,893<br />
Utilities 314 421<br />
Utilities 231 304<br />
Marine 4,554 3,957<br />
Marine 1,045 793<br />
Marine 525 456<br />
Integrated Urban<br />
Development 16 9<br />
Integrated Urban<br />
Development 40 46<br />
Integrated Urban<br />
Development 37 39<br />
Others / Corporate 201 188<br />
Others / Corporate (3) 12<br />
Others / Corporate – 10<br />
8,764 9,047<br />
1,396 1,272<br />
793 809<br />
10,000<br />
8,000<br />
6,000<br />
4,000<br />
2,000<br />
0<br />
8,764<br />
9,047<br />
2010 <strong>2011</strong><br />
1,500<br />
1,200<br />
900<br />
600<br />
300<br />
0<br />
1,396<br />
1,272<br />
2010 <strong>2011</strong><br />
Net cash outflow for investing activities for<br />
Financial Position<br />
<strong>2011</strong> was S$1,142.9 million. S$1,090.2 million<br />
Group shareholders’ funds increased from<br />
was spent on purchase of property, plant and<br />
S$3.8 billion as at December 31, 2010 to S$4.1 billion<br />
equipment and payment for intangible assets and<br />
as at December 31, <strong>2011</strong>.<br />
S$197.6 million was used for equity interests into<br />
Non-current assets increased primarily due<br />
associates and joint ventures. The above cash<br />
to higher capital work-in-progress mainly for<br />
outflows were partially offset by dividends and<br />
Utilities and Marine projects. Trade and other<br />
interest received of S$140.4 million.<br />
receivables and trade and other payables increased<br />
Net cash outflow from financing activities<br />
in line with turnover. Tax recoverable decreased<br />
for <strong>2011</strong> was S$323.5 million, mainly related<br />
mainly due to receipt of tax refunds from the<br />
to dividends and interest paid and purchase of<br />
Inland Revenue Authority of Singapore. Cash and<br />
treasury shares, partially offset by net proceeds<br />
cash equivalents decreased mainly as a result of<br />
from borrowings.<br />
payment of dividends and funding for capital<br />
expenditure. Interest-bearing borrowings increased<br />
due to increased bank borrowings from the<br />
drawdown of project finance debts.<br />
800<br />
700<br />
600<br />
500<br />
400<br />
300<br />
200<br />
100<br />
0<br />
793<br />
809<br />
2010 <strong>2011</strong><br />
32 SEMBCORP INDUSTRIES ANNUAL REPORT <strong>2011</strong> GROWING SUSTAINABLE BUSINESSES 33
GROUP REVIEW<br />
Shareholder Returns<br />
Return on equity (ROE) for the Group was a<br />
healthy 20.4% in <strong>2011</strong> and earnings per share (EPS)<br />
increased to 45.3 cents.<br />
Subject to approval by shareholders at the next<br />
annual general meeting, a final tax exempt one-tier<br />
dividend of 17.0 cents per ordinary share, comprising<br />
an ordinary dividend of 15.0 cents and a bonus<br />
dividend of 2.0 cents, has been proposed for the<br />
financial year ended December 31, <strong>2011</strong>.<br />
Economic Value Added<br />
The Group generated positive economic value<br />
added (EVA) of S$728.2 million in <strong>2011</strong>.<br />
Our net operating profit after tax for <strong>2011</strong><br />
amounted to S$1.2 billion while capital charges<br />
increased to S$479.1 million, mainly due to a<br />
higher capital base.<br />
Value Added and Productivity Data<br />
In <strong>2011</strong>, the Group’s total value added was<br />
S$2.4 billion. This was absorbed by employees<br />
in wages, salaries and benefits of S$739.2 million,<br />
by governments in income and other taxes of<br />
S$188.3 million and by providers of capital in<br />
interest and dividends of S$369.7 million, leaving<br />
a balance of S$1.1 billion reinvested in business.<br />
Critical Accounting Policies<br />
<strong>Sembcorp</strong>’s financial statements are prepared<br />
in accordance with Singapore Financial <strong>Report</strong>ing<br />
Standards (FRS).<br />
With effect from January 1, <strong>2011</strong>, the Group adopted<br />
the following new / amended FRSs and Interpretations<br />
of Financial <strong>Report</strong>ing Standards (INT FRS):<br />
The adoption of the FRSs (including consequential<br />
amendments) does not have any significant impact<br />
on the Group’s financial statements.<br />
Financial Risk Management<br />
The Group’s activities expose it to a variety<br />
of financial risks, including changes in interest rates,<br />
foreign exchange rates and commodity prices as<br />
well as credit risk.<br />
Please refer to the Risk Management & Mitigation<br />
Strategies chapter of this report for details on the<br />
management of these risks.<br />
Treasury Management<br />
<strong>Sembcorp</strong>’s financing and treasury activities<br />
continue to be mainly centralised within our whollyowned<br />
subsidiary, <strong>Sembcorp</strong> Financial Services (SFS),<br />
the Group’s Treasury vehicle. SFS facilitates funding<br />
and on-lends funds borrowed by it to the businesses<br />
within the Group, where appropriate.<br />
SFS also actively manages the cash within the<br />
Group by taking in surplus funds from businesses<br />
with excess cash and lending to those with funding<br />
requirements. We actively manage the Group’s excess<br />
cash, deploying it to a number of financial<br />
institutions, and actively track developments in the<br />
global banking sector. Such proactive cash<br />
management continues to be an efficient and<br />
cost-effective way of managing the Group’s cash<br />
and financing its funding requirements.<br />
Facilities<br />
Including SFS’ S$1.5 billion and <strong>Sembcorp</strong><br />
Marine’s S$2.0 billion medium-term note programme,<br />
the Group’s total funded facilities as at end <strong>2011</strong><br />
Economic Value Added (S$ million)<br />
Note <strong>2011</strong> 2010<br />
Net operating profit before income tax expense 1,100 1,207<br />
Adjust for<br />
Share of associates’ and joint ventures’ profits 206 192<br />
Interest expense 1 69 58<br />
Others 2 (7) (3)<br />
Adjusted profit before interest and tax 1,368 1,454<br />
Cash operating taxes 3 (161) (245)<br />
Net operating profit after tax (NOPAT) 1,207 1,209<br />
Average capital employed 4 8,120 6,774<br />
Weighted average cost of capital (%) 5 5.9 5.9<br />
Capital charge 479 400<br />
Economic value added (EVA) 728 809<br />
Non-controlling share of EVA (256) (314)<br />
EVA attributable to shareholders 472 495<br />
Less: Unusual items (UI) gains 6 – –<br />
EVA attributable to shareholders (excluding UI) 472 495<br />
Notes:<br />
1. Interest expense includes imputed interest on present value of operating leases and capitalised interest charged to income statement upon disposal of<br />
the assets.<br />
2. Other adjustments include recovery of investment costs, timing difference of allowances made for / (write-back) of doubtful debts, warranty, inventory<br />
obsolescence and goodwill written off / impaired and construction-in-progress.<br />
3. The reported current tax is adjusted for the statutory tax impact of interest expense.<br />
4. Average capital employed is computed by taking monthly average total assets less non interest-bearing liabilities plus timing provision, goodwill written off /<br />
impaired and present value of operating leases.<br />
5. The weighted average cost of capital is calculated in accordance with the <strong>Sembcorp</strong> Group EVA Policy as follows:<br />
i. Cost of equity using capital asset pricing model with market risk premium at 5.0% (2010: 6.0%);<br />
ii. Risk-free rate of 2.69% (2010: 2.61%) based on yield-to-maturity of Singapore Government 10-year Bonds;<br />
iii. Ungeared beta ranging from 0.5 to 1.0 (2010: 0.5 to 1.0) based on <strong>Sembcorp</strong> <strong>Industries</strong>’ risk categorisation; and<br />
iv. Cost of debt rate at 2.63% (2010: 4.15%).<br />
6. Unusual items (UI) refer to gain / loss on divestment of subsidiaries, associates, joint ventures, long-term investments and disposal of major property,<br />
plant and equipment.<br />
Amendments to FRS 24<br />
Amendments to FRS 32<br />
Amendments to FRS 103<br />
Amendments to INT FRS 114<br />
INT FRS 115<br />
INT FRS 119<br />
Improvements to FRS 2010<br />
Related Party Disclosures<br />
Financial Instruments: Presentation – Classification of Rights Issues<br />
Business Combinations<br />
Prepayments of a Minimum Funding Requirement<br />
Agreements for the Construction of Real Estate<br />
Extinguishing Financial Liabilities with Equity Instruments<br />
34 SEMBCORP INDUSTRIES ANNUAL REPORT <strong>2011</strong> GROWING SUSTAINABLE BUSINESSES 35
GROUP REVIEW<br />
Economic Value Added (S$ million)<br />
1,000<br />
800<br />
600<br />
400<br />
200<br />
770<br />
511<br />
417<br />
809<br />
728<br />
Gross Value Added (S$ million)<br />
2,500<br />
2,000<br />
1,500<br />
1,000<br />
500<br />
2,016<br />
1,685<br />
1,433<br />
2,184<br />
2,079<br />
amounted to S$8.2 billion (2010: S$7.6 billion),<br />
with unfunded facilities standing at S$2.0 billion<br />
(2010: S$1.9 billion).<br />
Borrowings<br />
In <strong>2011</strong>, SFS signed a S$520.0 million bank<br />
loan comprising a S$230.0 million loan maturing<br />
in September 2017 and a S$290.0 million loan<br />
maturing in September 2020. The Group aims to<br />
term out the loans such that their maturity profile<br />
mirrors the life of our core assets, while we continue<br />
our focus on maintaining adequate liquidity for the<br />
Group’s businesses.<br />
We continue to build on our banking<br />
relationships to ensure that we are able to secure<br />
funding on competitive terms as and when<br />
commercially viable and strategically attractive<br />
opportunities arise.<br />
0<br />
2007<br />
2008<br />
2009<br />
2010<br />
<strong>2011</strong><br />
0<br />
2007<br />
2008<br />
2009<br />
2010<br />
<strong>2011</strong><br />
Value Added Statement (S$ million)<br />
<strong>2011</strong> 2010 2009 2008 2007<br />
Value Added Per Employee (S$’000)<br />
200<br />
Profit After Tax Per Employee (S$’000)<br />
100<br />
Value added from<br />
Turnover 9,047 8,764 9,572 9,928 8,619<br />
Less: Bought in materials and services (6,968) (6,580) (7,556) (8,243) (7,186)<br />
Gross value added 2,079 2,184 2,016 1,685 1,433<br />
150<br />
100<br />
99<br />
109<br />
147<br />
163<br />
146<br />
80<br />
60<br />
40<br />
45<br />
47<br />
74<br />
87<br />
81<br />
Investment, interest and other income 147 168 125 154 461<br />
Share of associates’ profit 114 109 65 91 114<br />
Share of joint ventures’ profit 92 83 71 49 60<br />
Other non-operating expenses (53) (91) (59) (145) (348)<br />
2,379 2,453 2,218 1,834 1,720<br />
50<br />
0<br />
2007<br />
2008<br />
2009<br />
2010<br />
<strong>2011</strong><br />
20<br />
0<br />
2007<br />
2008<br />
2009<br />
2010<br />
<strong>2011</strong><br />
Distribution<br />
To employees in wages, salaries and benefits 739 725 710 682 636<br />
To government in income and other taxes 188 249 243 170 186<br />
To providers of capital on:<br />
Interest paid on borrowings 66 61 41 44 54<br />
Dividends to shareholders 304 268 196 267 498<br />
1,297 1,303 1,190 1,163 1,374<br />
Economic Value Added Per Employee (S$’000)<br />
80<br />
60<br />
40<br />
20<br />
60.34<br />
56.21<br />
51.30<br />
32.92<br />
28.85<br />
Retained in business<br />
Depreciation and amortisation 235 242 200 195 185<br />
Retained profits 505 525 487 240 28<br />
Non-controlling interests 337 380 333 224 125<br />
1,077 1,147 1,020 659 338<br />
Other non-operating expenses 5 3 8 12 8<br />
1,082 1,150 1,028 671 346<br />
Total distribution 2,379 2,453 2,218 1,834 1,720<br />
0<br />
2007<br />
2008<br />
2009<br />
2010<br />
<strong>2011</strong><br />
36 SEMBCORP INDUSTRIES ANNUAL REPORT <strong>2011</strong> GROWING SUSTAINABLE BUSINESSES 37
GROUP REVIEW<br />
Productivity Data<br />
<strong>2011</strong> 2010 2009 2008 2007<br />
Financing & Treasury Highlights (S$ million)<br />
<strong>2011</strong> 2010 2009<br />
Average staff strength 14,194 13,415 13,707 15,512 14,453<br />
Employment costs (S$ million) 739 725 710 682 636<br />
Sales per employee (S$’000) 637 653 698 640 596<br />
Profit after tax per employee (S$’000) 81 87 74 47 45<br />
Economic value added (S$ million) 728 809 770 511 417<br />
Economic value added spread (%) 9.0 11.9 14.3 9.4 8.1<br />
Economic value added per employee (S$’000) 51.30 60.34 56.21 32.92 28.85<br />
Value added (S$ million) 2,079 2,184 2,016 1,685 1,433<br />
Value added per employee (S$’000) 146 163 147 109 99<br />
Value added per dollar employment costs (S$) 2.81 3.01 2.84 2.47 2.25<br />
Value added per dollar investment in property,<br />
plant and equipment (S$) 0.33 0.40 0.47 0.43 0.36<br />
Value added per dollar sales (S$) 0.23 0.25 0.21 0.17 0.17<br />
Source of Funding<br />
Cash and cash equivalents 2,995 3,488 2,598<br />
Funded bank facilities and capital markets<br />
Uncommitted facilities available for drawdown 4,571 4,415 3,753<br />
Committed facilities available for drawdown 3,601 3,224 2,918<br />
Total funded facilities 8,172 7,639 6,671<br />
Less: Amount drawn down (2,184) (1,743) (968)<br />
Unutilised funded facilities available 5,988 5,896 5,703<br />
Unfunded bank facilities<br />
Unfunded facilities available for drawdown 1,978 1,911 1,942<br />
Less: Amount drawn down (773) (551) (911)<br />
Unutilised unfunded facilities available 1,205 1,360 1,031<br />
Total unutilised funded and unfunded facilities 7,193 7,256 6,734<br />
The Group remains committed to balancing<br />
the availability of funding and the cost of funding,<br />
together with the need to maintain prudent financial<br />
ratios. We also aim to maintain an efficient and<br />
optimal mix of committed and uncommitted facilities<br />
and fixed and floating rate borrowings. Of the<br />
overall debt portfolio, 83% (2010: 79%) constituted<br />
fixed rate debts which were not exposed to interest<br />
rate fluctuations.<br />
As at December 31, <strong>2011</strong>, gross borrowings<br />
amounted to S$2.2 billion (2010: S$1.7 billion)<br />
which was higher than last year. The incremental<br />
borrowings were mainly due to drawdown of project<br />
finance loans, which were funded at relatively higher<br />
interest rates, to fund the construction of our power<br />
and water plant in Oman. As a result, Group<br />
borrowings and interest expense were slightly higher<br />
in <strong>2011</strong> as compared to 2010. The weighted average<br />
cost of funding in <strong>2011</strong> was 5.09% (2010: 5.06%)<br />
while the interest cover ratio remained in a healthy<br />
range of 20.3 times in <strong>2011</strong> (2010: 24.2 times). The<br />
lower interest cover ratio in <strong>2011</strong> was due to the<br />
combination of lower EBITDA and slightly higher<br />
interest expense as compared to 2010.<br />
As the Group strives to grow, the Group’s interest<br />
expense is expected to increase along with higher<br />
borrowings to fund its growth strategy.<br />
Funding Profile<br />
Maturity profile<br />
Due within one year 188 50 287<br />
Due between one to five years 757 587 546<br />
Due after five years 1,239 1,106 135<br />
2,184 1,743 968<br />
Debt mix<br />
Fixed rate debt 1,818 1,374 871<br />
Floating rate debt 366 369 97<br />
2,184 1,743 968<br />
Currency denomination of debt<br />
SGD 757 765 627<br />
USD 795 388 61<br />
GBP 272 287 154<br />
OMR 241 172 82<br />
RMB 100 109 44<br />
Others 19 22 –<br />
2,184 1,743 968<br />
38 SEMBCORP INDUSTRIES ANNUAL REPORT <strong>2011</strong> GROWING SUSTAINABLE BUSINESSES 39
GROUP REVIEW<br />
Financing & Treasury Highlights (S$ million)<br />
<strong>2011</strong> 2010 2009<br />
Debt Ratios<br />
Interest cover ratio<br />
Earnings before interest, tax, depreciation and amortisation 1,336 1,478 1,316<br />
Interest on borrowings 66 61 41<br />
Interest cover (times) 20.3 24.2 31.9<br />
Debt / equity ratio<br />
Non-recourse project financing 1,024 581 307<br />
Long-term debt 1,013 1,132 430<br />
Short-term debt 147 30 231<br />
2,184 1,743 968<br />
Less: Cash and cash equivalents (2,995) (3,488) (2,598)<br />
Net debt / (cash) (811) (1,745) (1,630)<br />
Net debt / (cash) excluding project financing (1,799) (2,282) (1,752)<br />
Net gearing including and excluding project financing (times) Net cash Net cash Net cash<br />
Average cost of funds (%) 5.09 5.06 4.14<br />
<strong>Sembcorp</strong>’s cogeneration plant in Shanghai, China<br />
40 SEMBCORP INDUSTRIES ANNUAL REPORT <strong>2011</strong>
UTILITIES REVIEW<br />
Performance Scorecard (S$ million)<br />
<strong>2011</strong> 2010 Change (%)<br />
Turnover 4,937.4 4,031.8 22<br />
EBITDA 497.4 395.3 26<br />
PFO 420.8 313.5 34<br />
– EBIT 355.7 244.0 46<br />
– Share of results: Associates & JVs, net of tax 65.1 69.5 (6)<br />
Net profit 304.4 231.3 32<br />
ROE (%) 18.9 15.8 20<br />
PFO by Geography<br />
Singapore<br />
China<br />
Rest of Asia & Australia<br />
11%<br />
8%<br />
Middle East & Africa<br />
UK<br />
The Americas<br />
2%<br />
PFO by Segment<br />
Energy<br />
Water<br />
On-site Logistics & Solid Waste Management<br />
10%<br />
8%<br />
61%<br />
29%<br />
61%<br />
10%<br />
Note: PFO excluding contribution from ‘Corporate’<br />
Note: PFO excluding contribution from ‘Corporate’<br />
<strong>Sembcorp</strong>’s facilities on Jurong Island, Singapore<br />
Key Developments<br />
Commenced construction of our new combined<br />
cycle gas turbine cogeneration plant and<br />
integrated industrial wastewater treatment<br />
plant in the new growth area of Jurong Island<br />
Completed the first phase of our US$1 billion<br />
Salalah Independent Water and Power Plant<br />
in Oman on schedule, meeting the tight<br />
project timeline<br />
Completed the acquisition of our 49% stake<br />
in Thermal Powertech Corporation India with<br />
the injection of the first tranche of equity<br />
Opened our first water reclamation plant in<br />
China, an award-winning plant capable of<br />
producing 20,000 cubic metres per day of<br />
industrial water and up to 4,000 cubic metres<br />
per day of demineralised water in the<br />
Zhangjiagang Free Trade Port Zone<br />
Successfully completed the integration of<br />
Cascal operations into the Group<br />
Competitive Edge<br />
A leading developer, owner and operator<br />
of energy and water assets with strong<br />
operational and technical capabilities<br />
A global leader in the provision of energy,<br />
water and on-site logistics to multiple<br />
customers in energy intensive clusters<br />
Ability to produce energy from a diversity<br />
of fuels including natural gas, coal and<br />
renewable sources<br />
Expertise in providing total water solutions for<br />
industrial and municipal sectors including the<br />
treatment of multiple streams of high<br />
concentration industrial wastewater as well as<br />
large scale desalination and water reclamation<br />
Proven track record in identifying, securing,<br />
financing and executing greenfield and<br />
brownfield projects<br />
GROWING SUSTAINABLE BUSINESSES 43
UTILITIES REVIEW<br />
Operations Review<br />
The Utilities business delivered strong profit<br />
growth in <strong>2011</strong>. We recorded a 22% increase in<br />
turnover from S$4.0 billion a year ago to S$4.9<br />
billion and grew our net profit attributable to<br />
shareholders (net profit) by 32% from S$231.3<br />
million to a record S$304.4 million. Profit from<br />
operations (PFO) increased 34% from S$313.5<br />
million to S$420.8 million. Singapore operations<br />
performed exceptionally well, with PFO growing<br />
31% and contributing 61% of the business’ PFO<br />
during the year under review. Operations outside<br />
Singapore contributed 39% of the PFO, with China<br />
and the Middle East & Africa registering the strongest<br />
growth at 53% and 51% respectively. Total contracts<br />
secured from the industrial sector during the year<br />
amounted to S$1.7 billion, comprising primarily<br />
new gas contracts secured in Singapore.<br />
In April <strong>2011</strong>, we were named the Water<br />
Company of the Year at Global Water Intelligence’s<br />
<strong>2011</strong> Global Water Awards. This top honour at the<br />
prestigious Global Water Awards recognises the<br />
water company that has made “the most significant<br />
contribution to the development of the international<br />
water sector in 2010”. Besides clinching the top<br />
honour, our Salalah Independent Water and Power<br />
Plant (IWPP) in Oman won the Desalination Deal<br />
of the Year award, in recognition of its “financial<br />
innovation or in meeting the demands of challenging<br />
circumstances”. Despite the deal coming at the tail<br />
end of the financial crisis, the project’s financing<br />
team nevertheless secured funding support at<br />
a competitive cost. Both these awards attest to<br />
our growing standing as a trusted global water<br />
services provider.<br />
During the year, we also successfully integrated<br />
the operations of Cascal into <strong>Sembcorp</strong>, following<br />
our acquisition of the municipal water and<br />
wastewater service provider in 2010. Fully integrated<br />
into the Group, its operations performed well in<br />
<strong>2011</strong> with its maiden full year contribution boosting<br />
our Utilities performance. The success of this<br />
acquisition demonstrates <strong>Sembcorp</strong>’s capabilities<br />
in executing and extracting value from acquisitions.<br />
We were not only able to successfully identify a<br />
suitable acquisition target that complemented<br />
<strong>Sembcorp</strong>’s existing business, but we were also able<br />
to smoothly integrate 18 municipal water operations<br />
across eight countries into the Group. The integration<br />
also involved the rationalisation and streamlining<br />
of operations, alignment of systems, processes and<br />
policies as well as the establishment of a unified<br />
organisation-wide branding.<br />
Singapore<br />
<strong>Sembcorp</strong>’s Singapore operations delivered<br />
strong PFO growth in <strong>2011</strong>. Our Singapore<br />
operations’ 31% increase in PFO to S$258.6 million<br />
was driven primarily by strong performance from<br />
our cogeneration plant due to high energy prices<br />
during the period.<br />
During the year, our multi-utilities operations<br />
on Jurong Island performed well and continued to<br />
provide its petrochemical customers on the island<br />
with reliable utilities, maintaining an average of<br />
97% availability and 100% reliability. To further<br />
enhance our competitiveness on Jurong Island,<br />
we completed a woodchip-fuelled biomass steam<br />
production plant, with a steam capacity of 20 tonnes<br />
per hour, in November <strong>2011</strong>. Leveraging synergy<br />
across our businesses, the biomass plant uses waste<br />
wood collected and processed by our solid waste<br />
management business to generate efficient green<br />
steam for our customers on the island. In November<br />
<strong>2011</strong>, we also started receiving the second tranche<br />
of natural gas from West Natuna, Indonesia. This<br />
second gas sales agreement is for a total of 90 billion<br />
British thermal units per day and increases our<br />
existing supply by 26%. In <strong>2011</strong>, a total of<br />
S$1.6 billion worth of new and renewed utilities<br />
and gas contracts were secured. In addition, our solid<br />
waste management business also secured a new<br />
S$121 million contract in July <strong>2011</strong> to serve the<br />
Bedok sector in Singapore. The seven-year contract,<br />
which began in November <strong>2011</strong>, entails the provision<br />
of refuse collection and recycling services. With this<br />
contract, <strong>Sembcorp</strong> now serves five out of nine<br />
geographical sectors in Singapore.<br />
In <strong>2011</strong>, our expansion projects in the new<br />
growth area of Jurong Island continued to make<br />
good progress. We commenced construction of our<br />
new combined cycle gas turbine cogeneration plant,<br />
our second on Jurong Island, in the second half of<br />
<strong>2011</strong>. With a capacity of 400 megawatts of power<br />
and 200 tonnes per hour of process steam in the<br />
initial phase, the plant is expected to be completed<br />
by the fourth quarter of 2013. Construction of our<br />
new 9,600 cubic metres per day integrated industrial<br />
wastewater treatment plant also commenced in<br />
<strong>2011</strong>. Expected to begin operations in the second<br />
half of 2012, the plant will be capable of treating<br />
high concentration industrial wastewater with<br />
chemical oxygen demand of up to 800 milligrammes<br />
per litre, which is two times the concentration of<br />
municipal sewage. Once operational, <strong>Sembcorp</strong>’s<br />
industrial wastewater treatment capacity will more<br />
than double. At the same time, we are also<br />
developing a new multi-utilities facility in the area,<br />
expected to be completed by the fourth quarter<br />
of 2013. As a provider of third-party open access<br />
service corridor networks across the island, we also<br />
continued to extend our service corridor network<br />
to the new growth area, connecting customers<br />
located there to the rest of Jurong Island. These new<br />
facilities in the Banyan and Angsana districts of<br />
Jurong Island will serve the energy and water needs<br />
of our customers as well as other companies in<br />
the new area, reinforcing our market position as a<br />
global leader in the provision of energy, water and<br />
on-site logistics to multiple customers in energy<br />
intensive clusters.<br />
China<br />
Our operations in China continued to deliver<br />
a strong performance in <strong>2011</strong>, contributing<br />
S$41.2 million of PFO, an increase of 53% over<br />
2010. This growth was largely underpinned by<br />
better performance from our cogeneration plant in<br />
Shanghai due to higher electricity tariffs, full year<br />
contribution from our municipal water business as<br />
well as higher customer demand. In <strong>2011</strong>, volume<br />
demand from our existing customers grew, with<br />
volume demand for industrial wastewater treatment,<br />
industrial water and municipal water growing<br />
approximately 20%, 30% and 12% respectively<br />
over the previous year. Our China operations also<br />
secured a total of S$63 million of new and renewed<br />
contracts in <strong>2011</strong>.<br />
During the year, we continued to expand our<br />
facilities and grow our water and wastewater<br />
capabilities in various targeted industrial sites. In<br />
Zhangjiagang, we opened our first water reclamation<br />
plant in China, capable of producing 20,000 cubic<br />
metres per day of industrial water and up to 4,000<br />
cubic metres per day of demineralised water for<br />
supply to customers in the Zhangjiagang Free Trade<br />
Port Zone. This award-winning facility is able to<br />
produce industrial water using treated effluent from<br />
<strong>Sembcorp</strong>’s existing centralised industrial wastewater<br />
treatment plant in the zone, thereby promoting<br />
water reuse and environmental conservation. In<br />
Nanjing, we expanded our industrial water capacity<br />
output by 20% to 120,000 cubic metres per day,<br />
while in Qinzhou we completed our 15,000 cubic<br />
metres per day industrial wastewater treatment plant<br />
in the Qinzhou Port Economic & Technological<br />
Development Zone.<br />
Focusing on industrial sites and the waterstressed<br />
regions of China, and leveraging our<br />
extended presence through our newly-acquired<br />
municipal operations from Cascal, we also signed<br />
several letters of intent and memoranda of<br />
understanding during the year to explore<br />
opportunities to expand our water and multi-utilities<br />
business in the provinces of Liaoning, Jiangsu,<br />
Shandong, Inner Mongolia, Hebei, Tianjin<br />
and Heilongjiang.<br />
44 SEMBCORP INDUSTRIES ANNUAL REPORT <strong>2011</strong> GROWING SUSTAINABLE BUSINESSES 45
UTILITIES REVIEW<br />
Rest of Asia & Australia<br />
PFO from Rest of Asia and Australia declined<br />
24% in <strong>2011</strong> to S$34.2 million due to one-off<br />
integration costs and purchase price allocation<br />
adjustments relating to the acquisition of WSN<br />
Environmental Solutions (WSN) in Australia as well<br />
as lower contribution from our Phu My 3 power<br />
plant in Vietnam, which was impacted by lower<br />
tariffs and the depreciation of the US dollar.<br />
Looking to expand our reach in Vietnam, we<br />
signed a memorandum of understanding with the<br />
People’s Committee of Quang Ngai Province in<br />
January 2012 to explore the feasibility of developing a<br />
1,200-megawatt coal-fired power plant in Dung Quat<br />
Economic Zone, located in central Vietnam’s Quang<br />
Ngai province. Meanwhile, in India, we made progress<br />
on our first investment in the fast-growing Indian<br />
energy market. In February <strong>2011</strong>, we injected the first<br />
tranche of equity for our 49% stake in Thermal<br />
Powertech Corporation India. The total consideration<br />
that will be injected by <strong>Sembcorp</strong> for the entire 49%<br />
stake is Rs1,042 crores (S$293 million). In the same<br />
month, we commenced construction of the<br />
1,320-megawatt coal-fired power plant in<br />
Krishnapatnam, Nellore District, Andhra Pradesh.<br />
Construction has been progressing well and full<br />
commercial operation is expected to begin in 2014.<br />
In Australia, our solid waste management<br />
associate, SembSITA Australia, strengthened its<br />
leading position with the completion of the<br />
A$235 million acquisition of WSN, a solid waste<br />
management service provider previously owned by<br />
the New South Wales government, in January <strong>2011</strong>.<br />
Adding over 90 facilities and service centres<br />
nationwide, SembSITA is now the second largest<br />
waste management operator in Australia and the<br />
largest in the state of New South Wales.<br />
Middle East & Africa<br />
PFO from the Middle East and Africa grew 51%<br />
from S$21.7 million to S$32.9 million. In the UAE,<br />
our Fujairah 1 Independent Water and Power Plant<br />
continued to deliver good operating performance,<br />
underpinned by its long-term purchase agreement<br />
with Abu Dhabi Water & Electricity Company.<br />
In Oman, a significant milestone was achieved<br />
when we successfully completed the first phase<br />
of our US$1 billion Salalah IWPP in July <strong>2011</strong>. The<br />
facility met the tight timeline of 19 months from the<br />
signing of the power and water purchase agreement<br />
and began dispatching 61 megawatts of net power,<br />
on schedule, to the Dhofar power grid in southern<br />
Oman. Targeted to commence full commercial<br />
operations in the second quarter of 2012, the plant<br />
will have a total gross power capacity of 490<br />
megawatts and will produce 15 million imperial<br />
gallons (69,000 cubic metres) per day of water. Set to<br />
be the most energy-efficient power and water plant<br />
in Dhofar, this project will enhance our Middle East<br />
portfolio and play a major role in meeting the<br />
region’s pressing power and water needs.<br />
In South Africa, in recognition of our continuing<br />
efforts to provide water and sanitation services of the<br />
highest quality to our customers, both our municipal<br />
operations, <strong>Sembcorp</strong> Silulumanzi and <strong>Sembcorp</strong> Siza<br />
Water, received the prestigious Blue Drop and Green<br />
Drop status for some of its water and wastewater<br />
systems in <strong>2011</strong>.<br />
UK & The Americas<br />
PFO from the UK improved 46% from<br />
S$30.8 million to S$45.0 million largely due to<br />
the full year contribution of our municipal water<br />
business and a reduction in the UK tax rate from<br />
27% to 25%. Our municipal water operations in<br />
Bournemouth delivered a healthy performance<br />
during the year, while contribution from our Teesside<br />
operations declined marginally compared to the<br />
previous year as the business continued to face a<br />
challenging operating environment with low power<br />
spreads and carbon prices.<br />
In Bournemouth, new tariffs were effected for<br />
our municipal operations according to the five-year<br />
tariff schedule set during its 2010 tariff review with<br />
the UK water services regulator, Ofwat. In Teesside,<br />
our 52-megawatt steam condensing turbine project<br />
was completed in the fourth quarter of <strong>2011</strong> and<br />
commenced dispatching power to the grid in<br />
February 2012. Modification works to our biomass<br />
plant were also completed to increase heat recovery<br />
and enhance our green income from renewable<br />
obligation certificates.<br />
Meanwhile, PFO from the Americas, comprising<br />
Chile, Panama and the Caribbean, grew from<br />
S$2.3 million to S$10.1 million due to full year<br />
contribution from the region as well as a one-off<br />
adjustment from the change in accounting treatment<br />
for a service concession arrangement in Chile.<br />
Market Review and Outlook<br />
In January 2012, the World Bank reduced its<br />
forecast for global economic growth in 2012 to<br />
2.5% from 3.6% in its earlier forecasts in June <strong>2011</strong>,<br />
and cautioned that the financial turmoil generated<br />
by the intensification of the fiscal crisis in Europe<br />
has spread to both developing and high-income<br />
countries and is generating significant headwinds 1 .<br />
Growth in the high-income economies is expected<br />
to be subdued at 1.4%, with the Eurozone countries<br />
expected to contract by 0.3%. Developing countries<br />
are still expected to grow, albeit at a slower pace of<br />
5.4% compared to 6.2% previously.<br />
In Singapore, the government expects 2012<br />
Gross Domestic Product growth to be in the range<br />
of 1% to 3%, compared to <strong>2011</strong>’s growth of 4.8%.<br />
Singapore’s Economic Development Board reported<br />
1<br />
The World Bank, ‘Global Economic Prospects January 2012: Uncertainties and vulnerabilities’<br />
that total fixed asset investment commitments<br />
increased from S$12.9 billion in 2010 to S$13.7 billion<br />
in <strong>2011</strong> despite economic uncertainties during the<br />
second half of the year. After the electronics sector,<br />
the chemical sector received the next largest<br />
investment commitment at S$2.5 billion. The<br />
Economic Development Board is cautiously optimistic<br />
about the investment climate in 2012, but expects<br />
investment commitments in 2012 to be sustained<br />
at <strong>2011</strong>’s level, citing that investment interest in<br />
Asia remains healthy in spite of the uncertainties<br />
in the global economy, especially in the Eurozone.<br />
Meanwhile, petrochemical companies with confirmed<br />
investments continued to push ahead with the<br />
construction of their new plants on Jurong Island.<br />
These include Denka and Sumitomo Chemical whose<br />
plants are expected to start up in 2012; Chang Chun<br />
Group, LANXESS, Asahi Kasei and Zeon in 2013; and<br />
Jurong Aromatics Corporation and Evonik in 2014.<br />
In 2012, our Utilities business is expected to<br />
deliver a steady performance despite our<br />
cogeneration plant in Singapore undertaking a<br />
planned major maintenance during the year.<br />
However, the weaker macro-economic environment<br />
may impact power and carbon prices and affect the<br />
performance of our energy businesses in Singapore<br />
and the UK.<br />
With a healthy pipeline of projects both in<br />
Singapore and overseas, we are committed to<br />
delivering long-term growth through the focused<br />
execution of these projects as well as the active<br />
pursuit of new growth opportunities.<br />
46 SEMBCORP INDUSTRIES ANNUAL REPORT <strong>2011</strong> GROWING SUSTAINABLE BUSINESSES 47
MARINE REVIEW<br />
Performance Scorecard (S$ million)<br />
<strong>2011</strong> 2010 Change (%)<br />
Turnover 3,960.2 4,554.9 (13)<br />
EBITDA 825.8 1,081.8 (24)<br />
PFO 792.4 1,045.1 (24)<br />
– EBIT 739.1 998.2 (26)<br />
– Share of results: Associates & JVs, net of tax 53.3 46.9 14<br />
Net profit 751.9 860.3 (13)<br />
ROE (%) 30.0 38.4 (22)<br />
Note: Figures taken at <strong>Sembcorp</strong> Marine level<br />
Turnover by Segment<br />
Rig building<br />
Ship repair & others<br />
27%<br />
Ship conversion & offshore<br />
Orderbook Composition<br />
Jack-ups<br />
Ship conversion & offshore<br />
Semi-submersibles Drillship<br />
15%<br />
17%<br />
56%<br />
Net Orderbook<br />
of S$6.3 billion<br />
(as at February 2012)<br />
29%<br />
8%<br />
48%<br />
West Triton Baker Marine Pacific Class 375 jack-up rig built by <strong>Sembcorp</strong> Marine<br />
Key Developments<br />
Marked a significant milestone with the<br />
ground breaking of our first overseas<br />
Integrated New Yard Facility, Estaleiro Jurong<br />
Aracruz, in the state of Espirito Santo, Brazil<br />
Increased shareholding in Sembmarine<br />
Kakinada, a joint venture between<br />
Sembawang Shipyard and Kakinada Seaports,<br />
to 40%<br />
Delivered one of the world’s largest jack-up<br />
rigs to Seadrill, specially designed for harsh<br />
operating conditions in the North Sea region<br />
S$3.7 billion worth of new orders secured in<br />
<strong>2011</strong>, including orders for premium and<br />
high-specification jack-up rigs<br />
Current net orderbook of S$6.3 billion as at<br />
February 2012, with completions and<br />
deliveries till mid-2015<br />
Competitive Edge<br />
Singapore’s leading marine and offshore<br />
engineering group with 49 years of proven<br />
track record<br />
Comprehensive portfolio encompassing the<br />
full spectrum of integrated solutions from ship<br />
repair, shipbuilding, ship conversion, rig repair<br />
and rig building to offshore engineering and<br />
construction<br />
Strong track record for quality and timely<br />
delivery as well as the ability to handle<br />
complex turnkey projects and repairs while<br />
meeting high standards for health, safety,<br />
security and environment<br />
Global network of strategically located yards<br />
Development and ownership of proprietary<br />
designs for rigs, drillships and container vessels<br />
Long-term strategic alliances with<br />
international ship operators provide a steady<br />
and growing baseload in ship repair<br />
GROWING SUSTAINABLE BUSINESSES 49
MARINE REVIEW<br />
Operations Review<br />
<strong>Sembcorp</strong>’s Marine business recorded a turnover<br />
of S$4.0 billion in <strong>2011</strong> compared to S$4.6 billion<br />
in 2010 due to the timing, number and value of the<br />
projects in varying progressive revenue recognition<br />
stages in the three different sectors of rig building,<br />
ship conversion and offshore and ship repair.<br />
The business’ profit from operations (PFO) was<br />
S$792.4 million compared to S$1.0 billion in 2010<br />
mainly due to fewer jack-up and semi-submersible<br />
rig projects. The business’ operating margin was<br />
18.6% as compared with 20.7% in 2010, largely<br />
attributable to fewer rig building projects, mainly<br />
jack-up rigs, as compared to more turnkey semisubmersible<br />
rigs in 2010.<br />
The business’ net profit attributable to<br />
shareholders of the company (net profit) was<br />
S$751.9 million compared to S$860.3 million in<br />
the previous year due to lower operating profit and<br />
the receipt of the full and final amicable settlement<br />
of the disputed foreign exchange transactions with<br />
Société Générale in 2010. This was offset by the<br />
higher interest income received in <strong>2011</strong> for deferred<br />
payment granted to customers and write-back of<br />
prior years’ tax over-provisions. Return on equity<br />
for the year stood at 30%.<br />
Ship repair<br />
During the year, ship repair turnover stood at<br />
S$643.9 million, comparable to 2010’s S$646.1 million<br />
and accounting for 16% of total turnover. A total of<br />
264 vessels docked at our yards in <strong>2011</strong>, lower than<br />
2010’s 282 vessels. However the average value per<br />
vessel increased to S$2.4 million from S$2.3 million<br />
in 2010. Long-term strategic alliance customers<br />
continued to provide a steady and growing baseload.<br />
Together with our regular repeat customers, they<br />
contributed 82% of total ship repair revenue in<br />
<strong>2011</strong>. High value repairs to oil tankers, container<br />
vessels, liquefied natural gas (LNG) and liquefied<br />
petroleum gas (LPG) tankers, passenger ships<br />
and upgrading of drillship and floating production<br />
storage and offloading (FPSO) units dominated<br />
the segment.<br />
During the year, we secured a long-term<br />
contract from Teekay Marine Services to provide<br />
repairs, refurbishment and upgrading of their fleet<br />
of 137 vessels.<br />
Ship conversion and offshore<br />
Turnover from ship conversion and offshore<br />
activities in <strong>2011</strong> registered a growth of 31% to<br />
S$1.1 billion from S$820.4 million in 2010. The<br />
sector contributed 27% of the total turnover of the<br />
Marine business. Projects delivered during the year<br />
included the conversion of FPSO PSVM for MODEC,<br />
the upgrading of FPSO Glas Dowr for Bluewater<br />
Energy Services and the pre-FPSO conversion of P-62<br />
for Petrobras Netherlands. In addition, we successfully<br />
completed the engineering and construction of<br />
Flintstone, a new generation of environmentallyfriendly<br />
designed fallpipe rock dumping vessel for<br />
Tideway and the Gajah Baru platforms for Premier<br />
Oil Natuna Sea.<br />
In terms of new contract wins, we secured a<br />
S$20 million contract from Golar LNG Energy to<br />
convert the LNG Khannur, a LNG tanker, to a floating<br />
storage and regasification unit, the FPSO conversion<br />
of the very large crude carrier (VLCC) tanker<br />
MV TAR II valued at S$130 million from MODEC and<br />
a US$300 million floating storage offloading tanker<br />
conversion contract from Mobil Cepu, a subsidiary<br />
of Exxon Mobil.<br />
The business secured two contracts for offshore<br />
vessels comprising a S$123 million contract for the<br />
engineering, procurement, construction and<br />
commissioning of the RV Investigator, a dynamic<br />
positioning (DP) bluewater research vessel for Teekay<br />
Shipping (Australia) as well as a US$140 million contract<br />
from Equinox Offshore Accommodation to convert<br />
a ROPAX vessel into a DP Class 2 Accommodation<br />
and Repair Vessel.<br />
Two offshore platform contracts were also<br />
secured during the year which included a S$600 million<br />
contract from PTTEP International for an Integrated<br />
Processing and Living Quarters platform and a<br />
contract from Bechtel Overseas for the assembly<br />
of process and cryogenic pipe-rack modules for<br />
Australia Pacific LNG’s liquefied natural gas facility.<br />
Valued at US$100 million, the value of this contract<br />
may potentially increase in excess of US$150 million.<br />
Rig building<br />
The rig building segment contributed S$2.2 billion<br />
or 56% of our Marine business’ total turnover,<br />
compared to S$3.0 billion in 2010. During the year,<br />
we completed and delivered three jack-up rigs on<br />
or ahead of schedule: the El Qaher II, a proprietary<br />
Pacific Class 375 design jack-up rig to Egyptian<br />
Offshore Drilling Company; the West Elara, a Gusto<br />
MSC CJ70 150A harsh-environment jack-up rig, the<br />
largest of its kind to be constructed by our Marine<br />
business, to Seadrill; and the Transocean Honor, the<br />
first proprietary Pacific Class 400 design jack-up rig to<br />
Transocean. In addition, we completed and delivered<br />
four semi-submersible rigs: the West Pegasus, a Moss<br />
Maritime CS50 MKII design semi-submersible rig, and<br />
three newbuild Friede & Goldman ExD ultradeepwater<br />
semi-submersible rigs: the West Capricorn<br />
for Seadrill, the Atwood Osprey for Atwood Oceanics<br />
Pacific, and the Songa Eclipse for Songa Offshore.<br />
Seven new rig orders were clinched during<br />
the year including the building of a turnkey Pacific<br />
Class 400 jack-up rig valued at US$182 million<br />
from Atwood Oceanics Pacific; a turnkey Gusto MSC<br />
CJ70 150A harsh-environment high-specification<br />
jack-up rig worth US$450 million from Seadrill;<br />
two sets of two turnkey Friede & Goldman<br />
JU3000N jack-up rigs valued at US$427.6 million<br />
and US$444 million from Noble, the latter with<br />
options for another two similar jack-up rigs; and a<br />
US$291.6 million GVA 3000E design accommodation<br />
semi-submersible rig from Prosafe, with options for<br />
another two units.<br />
Strategic milestones<br />
In December <strong>2011</strong>, our Marine business achieved<br />
an important milestone in its growth and expansion<br />
strategy with the ground breaking of the first<br />
overseas Integrated New Yard Facility, Estaleiro<br />
Jurong Aracruz, in the municipality of Aracruz in the<br />
state of Espirito Santo – Brazil’s second largest oil<br />
producer. Situated on an 82.5-hectare site with<br />
1.6 kilometres of coastline, Estaleiro Jurong Aracruz<br />
is strategically located in close proximity to the rich<br />
oil and gas basin of Espirito Santo, one of Brazil’s<br />
giant pre-salt reservoirs, and is poised to further<br />
strengthen our business’ foothold in the country.<br />
The Integrated New Yard Facility in Brazil will<br />
be developed in stages over a period of three years<br />
with full completion targeted for end 2014. Estaleiro<br />
Jurong Aracruz is well-positioned to serve Brazil’s<br />
vibrant offshore and marine sector with wide-ranging<br />
capabilities in the construction of drilling rigs, FPSO<br />
integration, topside modules fabrication, and the<br />
repair and upgrading of ships and rigs.<br />
In February 2012, Estaleiro Jurong Aracruz<br />
secured a contract worth approximately<br />
US$792.5 million from Guarapari Drilling,<br />
Netherlands, a subsidiary of Sete Brasil Participacões,<br />
for the design and construction of a drillship based<br />
on Jurong Shipyard’s proprietary Jurong Espadon<br />
drillship design. Scheduled for delivery no later<br />
than the second quarter of 2015, the Jurong<br />
Espadon drillship represents the next generation<br />
of high-specification drillships with advanced<br />
50 SEMBCORP INDUSTRIES ANNUAL REPORT <strong>2011</strong> GROWING SUSTAINABLE BUSINESSES 51
MARINE REVIEW<br />
capabilities for operational efficiency and ultradeepwater<br />
operations worldwide. The order win<br />
is expected to be among the first of many orders<br />
in Sete Brasil’s drillship expansion programme to<br />
develop Brazil’s giant pre-salt oil fields.<br />
The business also continues with the growth<br />
and expansion strategy in Singapore with<br />
construction of the Integrated New Yard Facility<br />
at Tuas View Extension progressing on schedule. As<br />
Singapore’s first purpose-built, custom-designed<br />
integrated yard facility, the 206-hectare development<br />
will further reinforce our Marine business’<br />
competitive edge through enhanced work-efficient<br />
processes as well as state-of-the-art facilities<br />
and equipment.<br />
Designed as a centralised and integrated<br />
“one-stop solutions” hub for ship repair and<br />
conversion, shipbuilding, rig building and offshore<br />
engineering and construction, the New Yard<br />
Facility will be well-equipped to serve a wide range<br />
of vessels including VLCCs, new generations<br />
of mega containerships, LNG carriers and passenger<br />
ships, while meeting new regulatory and<br />
environmental standards.<br />
The facility will be built in three phases over<br />
a period of six years. Under the first phase,<br />
73.3 hectares will be developed for ship repair<br />
and ship conversion operations. It will feature four<br />
VLCC drydocks with a total capacity of 1.6 million<br />
deadweight tonnes and quays of more than<br />
three kilometres.<br />
In <strong>2011</strong>, the Marine business exercised the<br />
option to increase its shareholding in Sembmarine<br />
Kakinada (SKL), a joint venture between Sembawang<br />
Shipyard and Kakinada Seaports, from 19.9% to<br />
40%, becoming the largest single shareholder of<br />
the joint venture facility. The Technical Management<br />
and Services Agreement to operate and manage<br />
the joint venture was also extended from the current<br />
five years to 10 years. This increase in shareholding<br />
of SKL, a joint venture established since November<br />
2009, is in line with the business’ strategy to<br />
establish and grow a hub in India to cater to the<br />
growing needs of our customers operating in India<br />
and South Asia. SKL will be developed in three<br />
phases with the construction of the first phase well<br />
underway. When fully completed by end 2012,<br />
SKL will offer ship owners and offshore operators<br />
a one-stop integrated offshore service facility for<br />
the repairs and servicing of offshore vessels and<br />
ships, new builds, oil and gas riser and equipment<br />
repairs as well as platforms and modules fabrication.<br />
Market Review and Outlook<br />
The Marine business has a net orderbook<br />
of S$6.3 billion as at February 2012, with<br />
completions and deliveries until mid-2015. This<br />
includes S$3.7 billion in contracts secured in <strong>2011</strong><br />
and S$1.3 billion worth of orders secured since the<br />
start of 2012, excluding ship repair contracts.<br />
Despite the global macro-economic uncertainty,<br />
fundamentals for the offshore oil and gas<br />
industry remain intact, underpinned by high oil<br />
prices and projected increases in exploration and<br />
production spending.<br />
The offshore market continues to display signs<br />
of cyclical improvement, especially in the deep and<br />
ultra-deepwater segments fuelled by the growing<br />
needs of operators in multiple regions, in particular<br />
the “Golden Triangle” of Brazil, the Gulf of Mexico<br />
and West Africa.<br />
In the Gulf of Mexico, deepwater drilling activities<br />
remain robust as operators continue to move ahead<br />
with drilling programmes. Day rates for both jack-up<br />
and semi-submersible rigs have been strengthening.<br />
With offshore drilling moving towards deeper waters,<br />
coupled with the business’ proven track record in rig<br />
building, our Marine business will be well-positioned<br />
to capture new orders for high-specification<br />
deepwater rigs which meet the industry’s most<br />
stringent operating requirements.<br />
Ship repair continues to see strong demand with<br />
the newly forged long-term partnerships with several<br />
renowned international ship owners and operators,<br />
in particular in the niche segments for the repair,<br />
upgrading and life extension of LNG carriers,<br />
passenger and cruise vessels. These alliances and<br />
long-term customers will continue to provide a stable<br />
and steady baseload for the repair business.<br />
In Brazil, the wholly-owned shipyard Estaleiro<br />
Jurong Aracruz is strategically positioned to support<br />
developments in one of the world’s fastest growing<br />
offshore oil and gas exploration markets. In<br />
Singapore, the Integrated New Yard Facility in Tuas<br />
View Extension will become operational in 2013 and<br />
will nearly double the Marine business’ ship repair<br />
and ship conversion and offshore capacity from the<br />
current 1.9 million deadweight tonnes.<br />
Overall, competition is intense though enquiries<br />
for the various segments of the market remain robust.<br />
52 SEMBCORP INDUSTRIES ANNUAL REPORT <strong>2011</strong> GROWING SUSTAINABLE BUSINESSES 53
INTEGRATED URBAN DEVELOPMENT REVIEW<br />
Performance Scorecard (S$ million) <strong>2011</strong> 2010 Change (%)<br />
Turnover 1 12.8 19.7 (35)<br />
EBITDA 1.2 4.7 (74)<br />
PFO 46.1 40.4 14<br />
– EBIT (0.3) 2.7 N.M.<br />
– Share of results: Associates & JVs, net of tax 46.4 37.7 23<br />
Net profit 38.7 36.9 5<br />
ROE 2 (%) 7.2 7.3 (1)<br />
Notes:<br />
1<br />
Most of our Integrated Urban Development businesses are associates or joint ventures. The turnover is derived from providing services to these associates<br />
or joint ventures<br />
2<br />
Excluding its returns on <strong>Sembcorp</strong>’s corporate office on 30 Hill Street and its investment in Gallant Venture, the Integrated Urban Development business’ ROE<br />
for <strong>2011</strong> was 13.0%<br />
Key Developments<br />
Sold a total of 226 hectares of land in Vietnam<br />
and China, and had 227 hectares of land<br />
commitments at year-end<br />
Signed a memorandum of understanding to<br />
explore the feasibility of a fifth Vietnam<br />
Singapore Industrial Park to be located in<br />
Quang Ngai province, central Vietnam<br />
Sold a 13-hectare land plot for the New<br />
One North project, the first mixed-use<br />
development on the Sino-Singapore Nanjing<br />
Eco Hi-tech Island<br />
Took a 50% stake in the Singapore<br />
consortium involved in the 1,000-hectare<br />
Singapore-Sichuan Hi-tech Innovation Park<br />
in Chengdu, Sichuan province, China<br />
Competitive Edge<br />
Leading Asian developer with over 20 years’<br />
experience undertaking master planning, land<br />
preparation and infrastructure development,<br />
and transforming raw land into large scale<br />
urban developments<br />
Owns, develops, markets and manages<br />
integrated urban developments comprising<br />
industrial parks as well as business,<br />
commercial and residential space in Vietnam,<br />
China and Indonesia<br />
Integrated approach to delivering urban work<br />
and living environments that will attract local<br />
and international investments<br />
Over 600 multinational companies and leading<br />
local enterprises as tenants<br />
Opportunities for selective development of<br />
commercial and residential real estate at<br />
choice sites<br />
An artist’s impression of the VSIP Hai Phong Integrated Township & Industrial Park, Vietnam<br />
GROWING SUSTAINABLE BUSINESSES 55
INTEGRATED URBAN DEVELOPMENT REVIEW<br />
Operations Review<br />
<strong>Sembcorp</strong>’s Integrated Urban Development<br />
business (formerly known as Industrial Parks) turned<br />
in a good performance in <strong>2011</strong>. Net profit grew<br />
5% to S$38.7 million, compared to S$36.9 million<br />
in 2010, while profit from operations (PFO) increased<br />
14% from S$40.4 million to S$46.1 million. The<br />
business benefited from strong land sales in the<br />
Vietnam Singapore Industrial Park (VSIP) projects,<br />
which registered a 30% growth compared to 2010.<br />
Meanwhile, the Wuxi-Singapore Industrial Park (WSIP)<br />
continued to see a steady income stream from factory<br />
rentals as well as contribution from residential sales.<br />
In <strong>2011</strong>, the business sold a total of 226 hectares<br />
of land in Vietnam and China, a 24% increase from<br />
the previous year’s 182 hectares. Industrial land<br />
comprised 77% of land sales while commercial and<br />
residential land accounted for 23%. The growth in<br />
land sales was achieved in spite of a weaker global<br />
economic sentiment in the second half of the year.<br />
First land sales for both VSIP Hai Phong in Vietnam<br />
and the Sino-Singapore Nanjing Eco Hi-tech Island<br />
(SNEI) in China were secured during the year.<br />
In early 2012, the business was renamed<br />
Integrated Urban Development, in line with our focus<br />
on providing integrated urban solutions. Taking an<br />
integrated approach to delivering urban work and<br />
living environments, we have more than 20 years of<br />
track record transforming raw land into large scale<br />
urban developments comprising industrial parks as<br />
well as business, commercial and residential space.<br />
We also have the ability to extract further value by<br />
undertaking selective development of commercial<br />
and residential real estate at choice sites.<br />
Vietnam<br />
<strong>2011</strong> has been a challenging year for Vietnam.<br />
The country’s economy expanded 5.9% for the full<br />
year, down from an average of 7% in the past<br />
decade as the government tightened fiscal and<br />
monetary policies to rein in high inflation. Despite<br />
the challenging business environment, our VSIP<br />
projects performed well, securing high value land<br />
sales from several big multinational corporations.<br />
For the year, VSIP sold a total of 212 hectares, an<br />
increase of 30% from 2010’s 163 hectares. Demand<br />
for industrial land continued to be strong, accounting<br />
for 82% of the sales and growing 73% from the<br />
previous year.<br />
In southern Vietnam, our VSIP projects delivered<br />
a steady performance, surpassing the previous year’s<br />
land sales performance and accounting for 58% of<br />
VSIP’s total land sales. Our first 500-hectare VSIP<br />
project in Thuan An district is almost sold out and<br />
contributes steady recurrent income from factory<br />
rentals and electricity distribution. The second<br />
2,045-hectare VSIP in the New Binh Duong Township<br />
is 38% taken up and continues to see interest from<br />
potential investors. 68 hectares of land have been<br />
committed by customers and another 873 hectares<br />
of saleable land remained available as at end <strong>2011</strong>.<br />
In northern Vietnam, the 700-hectare VSIP Bac<br />
Ninh continued to build on its momentum of<br />
securing well-established, long-term customers.<br />
Nokia is setting up its first manufacturing facility in<br />
Southeast Asia in VSIP Bac Ninh, joining PepsiCo and<br />
Foster Electric. The integrated urban development<br />
also attracted Malaysia’s SP Setia who took up a large<br />
plot of residential land for an eco housing project.<br />
VSIP Bac Ninh sold 64 hectares of land in <strong>2011</strong> and<br />
total land take-up stood at 64% as at end <strong>2011</strong>.<br />
Investor interest remained healthy with 103 hectares<br />
of land committed by potential investors and 142<br />
hectares of saleable land remaining available as at<br />
end <strong>2011</strong>. Meanwhile, land preparation and<br />
infrastructure works continued to progress for our<br />
fourth VSIP project in Hai Phong City. During the<br />
year, it achieved its first land sales to Kyocera Mita<br />
Corporation of Japan. The official inclusion of Hai<br />
Phong City in the Dinh Vu-Cat Hai Economic Zone<br />
is expected to further boost the attractiveness and<br />
marketability of the development.<br />
Following the successful progress of our first four<br />
VSIP projects, a memorandum of understanding was<br />
signed with the People’s Committee of Quang Ngai<br />
province during the year to explore the feasibility<br />
of a 1,020-hectare integrated urban development<br />
in central Vietnam. The proposed development will<br />
comprise a 500-hectare industrial park located within<br />
the Dung Quat Economic Zone, where governmentsupported<br />
special economic zone incentives will be<br />
made available to manufacturers. Separately, 520<br />
hectares of land are expected to be zoned for<br />
commercial and residential purposes near downtown<br />
Quang Ngai city. The signing was witnessed by the<br />
President of Vietnam His Excellency Truong Tan Sang<br />
and Singapore Prime Minister Lee Hsien Loong.<br />
China<br />
In <strong>2011</strong>, WSIP performed well despite being<br />
a mature industrial park that has been operating<br />
for 18 years. Rentals from ready-built factories and<br />
electricity distribution continue to provide a stable<br />
income stream while initiatives to enhance the yield<br />
on this project have progressed well. During the year,<br />
we completed and handed over a 140,000-square<br />
metre custom-built factory to New York Stock<br />
Exchange-listed Suntech Power, which will rent<br />
the premises under a long-term lease agreement.<br />
Five new ready-built factories have also been rented<br />
out, including those in the Solar City photovoltaic<br />
park. In the commercial and residential space,<br />
occupancy rates for the business and technology<br />
park improved from 38% to 50%. Good take-up<br />
was also registered for the International Garden City<br />
apartment project in Wuxi New District, which sold<br />
137 units during the year, 50% more compared<br />
to 2010. Construction of Hongshan Mansion, a<br />
108-unit residential development, progressed well<br />
during the year and is targeted to be launched in<br />
the second quarter of 2012.<br />
Over in Nanjing, the SNEI project has completed<br />
its urban master plan, industry positioning study<br />
and ecology planning system. Of the island’s<br />
1,500-hectare gross land area, 809 hectares will be<br />
preserved for eco-tourism, while 715 hectares will<br />
be developed which includes 324 hectares of office,<br />
commercial and residential land available for sale.<br />
Through our joint venture company, we have secured<br />
a 13-hectare site to develop the first major mixed-use<br />
development on the island named New One North.<br />
Encompassing a research and development park,<br />
an exhibition centre and a waterfront commercialleisure-residential<br />
precinct overlooking Hexi New<br />
City on Nanjing mainland, New One North will yield<br />
about 152,000 square metres in gross floor area.<br />
During the year, we also completed the feasibility<br />
study for a new integrated development, the<br />
Singapore-Sichuan Hi-tech Innovation Park.<br />
Strategically located in Chengdu’s Tianfu New City<br />
central business district, the project adds 500<br />
hectares to our land bank available for sale. The<br />
integrated development will focus on attracting<br />
innovative and knowledge-intensive industries in<br />
eight clusters comprising information technology,<br />
digital media, pharmaceutical research, precision<br />
engineering, environmental services, service<br />
outsourcing, banking and insurance, and will be<br />
developed by a joint venture between the Singapore<br />
consortium, in which <strong>Sembcorp</strong> has a 50% stake,<br />
and its Chinese partners.<br />
Indonesia<br />
Our 23.92%-owned associate company Gallant<br />
Venture continued to deliver positive results although<br />
its profit contribution in <strong>2011</strong> was lower compared<br />
to 2010. Its property development business registered<br />
lower resort land sales while the industrial parks<br />
business continued to face competitive pressure.<br />
Market Review and Outlook<br />
The Integrated Urban Development business<br />
is expected to deliver better performance in 2012<br />
compared to <strong>2011</strong>, in anticipation of contribution<br />
from the SNEI project and underpinned by 227<br />
hectares of land commitments. Our projects in<br />
Vietnam and China remain attractive destinations<br />
for foreign investors. However, the economic<br />
56 SEMBCORP INDUSTRIES ANNUAL REPORT <strong>2011</strong> GROWING SUSTAINABLE BUSINESSES 57
INTEGRATED URBAN DEVELOPMENT REVIEW<br />
downturn in Europe and the USA may slow down<br />
manufacturing exports and delay potential customer<br />
investment decisions that could in turn impact the<br />
pace of our land sales. The Vietnamese and Chinese<br />
governments’ measures to stabilise the housing<br />
market in their countries may also moderate the<br />
demand for commercial and residential space.<br />
In the longer term, industrialisation and<br />
urbanisation remain a core priority for both Vietnam<br />
and China. The Vietnamese government has set<br />
a target to achieve full industrialisation by 2020.<br />
Its urban population is expected to reach 59% in<br />
2050 from 30% in 2009 1 . Similarly, China’s economic<br />
and social priorities are moving towards industry<br />
upgrading, sustaining growth and promoting<br />
domestic consumption. Its urban population is<br />
expected to grow from 46% in 2009 to 73% by<br />
2050 1 , adding a projected 46 million middle class<br />
households from 2010 to 2015 2 .<br />
With 2,711 hectares of land available for sale,<br />
our projects in Vietnam and China provide a robust<br />
development pipeline. Furthermore, with our ability<br />
to extract further value by undertaking selective<br />
development of commercial and residential real<br />
estate at choice sites, we believe that the business<br />
is poised for growth in the coming years.<br />
ENVIRONMENTAL,<br />
SOCIAL &<br />
GOVERNANCE<br />
REVIEW<br />
Board of Directors 60<br />
Key Executives 64<br />
Corporate Governance 68<br />
Risk Management & Mitigation Strategies 80<br />
Investor Relations 85<br />
Sustainability 88<br />
1<br />
United Nations World Urbanisation Prospects, The 2009 Revision<br />
2<br />
Boston Consulting Group: ‘Winning in Emerging-market Cities’, September 2010<br />
58 SEMBCORP INDUSTRIES ANNUAL REPORT <strong>2011</strong> GROWING SUSTAINABLE BUSINESSES 59
BOARD OF DIRECTORS<br />
Ang Kong Hua<br />
Chairman<br />
Non-executive & Independent Director<br />
Appointed February 26, 2010<br />
Tang Kin Fei<br />
Group President & CEO<br />
Appointed May 1, 2005<br />
Goh Geok Ling<br />
Non-executive & Independent Director<br />
Appointed May 3, 2000<br />
Evert Henkes<br />
Non-executive & Independent Director<br />
Appointed April 30, 2004<br />
As Chairman, Mr Ang is responsible for leading<br />
the board, setting its agenda and ensuring its<br />
effectiveness in all aspects of its role. Mr Ang is an<br />
independent director and heads the board’s Executive<br />
Committee, Executive Resource & Compensation<br />
Committee and Nominating Committee.<br />
A well-known corporate figure in Singapore,<br />
Mr Ang brings to <strong>Sembcorp</strong> many years of rich<br />
experience in the manufacturing and services sectors,<br />
including the chemicals, electronics, engineering<br />
and construction sectors. Currently, he is Chairman<br />
of Global Logistic Properties and also serves on the<br />
boards of the Government of Singapore Investment<br />
Corporation and Southern Steel.<br />
Mr Ang holds a BSc (Hons) in Economics from the<br />
University of Hull, UK.<br />
Past directorships in listed companies and major appointments 2009–<strong>2011</strong>:<br />
Yantai Raffles Shipyard<br />
NSL<br />
DBS Bank<br />
DBS Group Holdings<br />
GIC Special Investments<br />
Mr Tang is Group President & CEO of <strong>Sembcorp</strong><br />
<strong>Industries</strong>. With over 20 years at <strong>Sembcorp</strong>, he is<br />
credited with spearheading its growth into a focused<br />
energy, water and marine group with operations<br />
across six continents.<br />
Mr Tang also sits on the board of <strong>Sembcorp</strong><br />
Marine, a subsidiary of <strong>Sembcorp</strong> <strong>Industries</strong>, as a<br />
non-executive and non-independent director.<br />
Mr Tang is President of the Singapore Water<br />
Association, Vice Chairman of the Singapore Business<br />
Federation and a council member of the Singapore<br />
Chinese Chamber of Commerce and Industry. He also<br />
serves on several China-Singapore, Saudi-Singapore<br />
and Abu Dhabi-Singapore business councils. In<br />
addition, he is a council chairman of Ngee Ann<br />
Polytechnic and a member of the Singapore Chinese<br />
Chamber of Commerce Foundation, as well as a<br />
Vice Chairman and trustee of the Kwong Wai Shiu<br />
Hospital, a charitable hospital which provides care<br />
for needy patients.<br />
Mr Tang holds a First Class Honours in Mechanical<br />
Engineering from the University of Singapore and<br />
completed the Advanced Management Programme<br />
at INSEAD.<br />
Mr Goh is an independent director and<br />
serves on the board’s Executive Committee,<br />
Executive Resource & Compensation Committee<br />
and Nominating Committee.<br />
He is Chairman of <strong>Sembcorp</strong> Marine and serves<br />
as a member of the Board of Trustees of Nanyang<br />
Technological University. He is also an advisor of<br />
02Micro International.<br />
Mr Goh holds a BEng from the University<br />
of Sydney, Australia.<br />
Past directorships in listed companies and major appointments 2009–<strong>2011</strong>:<br />
Venture Corporation<br />
Mr Henkes is an independent director. He heads<br />
the board’s Risk Committee and is a member of the<br />
Audit Committee.<br />
He has extensive experience in the petrochemical<br />
industry as the former CEO of Shell’s global chemicals<br />
business. Mr Henkes is a director of Air Products and<br />
Chemicals, Outokumpu and Tate & Lyle.<br />
He holds a BSc from Cornell University, USA.<br />
Past directorships in listed companies and major appointments 2009–<strong>2011</strong>:<br />
GuocoLeisure<br />
60 SEMBCORP INDUSTRIES ANNUAL REPORT <strong>2011</strong> GROWING SUSTAINABLE BUSINESSES 61
BOARD OF DIRECTORS<br />
Bobby Chin Yoke Choong<br />
Non-executive & Independent Director<br />
Appointed December 1, 2008<br />
Margaret Lui<br />
Non-executive & Non-independent Director<br />
Appointed June 1, 2010<br />
Tan Sri Mohd Hassan Marican<br />
Non-executive & Independent Director<br />
Appointed June 16, 2010<br />
Tham Kui Seng<br />
Non-executive & Independent Director<br />
Appointed June 1, <strong>2011</strong><br />
Mr Chin is an independent director. He chairs the<br />
board’s Audit Committee and is a member of the<br />
Risk Committee.<br />
The Managing Partner of KPMG Singapore from<br />
1992 until his retirement in September 2005, Mr Chin<br />
is the Chairman of the Singapore Totalisator Board<br />
and a board member of the Competition Commission<br />
of Singapore and the Singapore Labour Foundation.<br />
He serves as a member of the Council of Presidential<br />
Advisers and a trustee of the Singapore Indian<br />
Development Association. He also sits on the boards<br />
of several listed companies including AV Jennings,<br />
Ho Bee Investment, Neptune Orient Lines, Oversea-<br />
Chinese Banking Corporation and Yeo Hiap Seng.<br />
Mr Chin holds a BAcc from the University of<br />
Singapore. He is a fellow of the Institute of Certified<br />
Public Accountants of Singapore and an associate<br />
member of the Institute of Chartered Accountants<br />
in England and Wales.<br />
Mrs Lui is a non-independent director and also<br />
a member of the board’s Executive Committee,<br />
Executive Resource & Compensation Committee,<br />
as well as its Nominating Committee.<br />
Currently, Mrs Lui is Chief Operating Officer of<br />
Seatown Holdings International. In addition, she serves<br />
on the boards of Brookstone Company, Singapore<br />
Cruise Centre, Singbridge International Singapore<br />
and Seatown Holdings International.<br />
Mrs Lui holds a BAcc from the National University<br />
of Singapore. She attended the Advanced<br />
Management Programme at Wharton School of the<br />
University of Pennsylvania.<br />
Past directorships in listed companies and major appointments 2009–<strong>2011</strong>:<br />
Singapore Food <strong>Industries</strong><br />
CitySpring Infrastructure Management<br />
Tan Sri Mohd Hassan Marican is an independent<br />
director and serves on the board’s Audit and<br />
Risk Committees.<br />
Tan Sri Mohd Hassan Marican was the President<br />
& CEO of Malaysia’s Petroliam Nasional (PETRONAS)<br />
from 1995 until his retirement in February 2010 and<br />
brings to the board over 30 years’ experience in<br />
finance and management. He currently serves as a<br />
director of <strong>Sembcorp</strong> Marine, Regional Economic<br />
Development Authority of Sarawak, Sarawak Energy,<br />
Lambert Energy Advisory, MH Marican Advisory,<br />
Singapore Power and ConocoPhillips. He is also a<br />
Senior International Advisor of Temasek International<br />
Advisors, a subsidiary of Temasek Holdings.<br />
Tan Sri Mohd Hassan Marican holds an honorary<br />
doctorate from the University of Malaya and is a<br />
fellow of the Institute of Chartered Accountants in<br />
England and Wales.<br />
Mr Tham is an independent director.<br />
Formerly the Chief Corporate Officer of CapitaLand,<br />
Mr Tham brings to the board a strong background in<br />
management in various industries, including a decade’s<br />
experience in the real estate business.<br />
Currently, Mr Tham serves on the board of Global<br />
Logistic Properties, Raffles Medical Group, The Straits<br />
Trading Company, CapitaLand China Holdings, SPI<br />
(Australia) Assets and Maxwell Chambers. He is also a<br />
board member of the Housing & Development Board.<br />
Mr Tham holds a BA (First Class Honours) in<br />
Engineering Science from the University of Oxford.<br />
Past directorships in listed companies and major appointments 2009–<strong>2011</strong>:<br />
Alexandra Health<br />
Past directorships in listed companies and major appointments 2009–<strong>2011</strong>:<br />
Malaysia International Shipping Corporation<br />
Engen<br />
Petroliam Nasional (PETRONAS)<br />
Malaysia-Thailand Joint Authority<br />
Bank Negara Malaysia<br />
International Centre for Leadership in Finance<br />
62 SEMBCORP INDUSTRIES ANNUAL REPORT <strong>2011</strong> GROWING SUSTAINABLE BUSINESSES 63
KEY EXECUTIVES<br />
Tang Kin Fei<br />
Group President & CEO<br />
Joined 1987<br />
Mr Tang is Group President & CEO of <strong>Sembcorp</strong><br />
<strong>Industries</strong>. With over 20 years at <strong>Sembcorp</strong>, he is<br />
credited with spearheading its growth into a focused<br />
energy, water and marine group with operations<br />
across six continents.<br />
Mr Tang also sits on the board of <strong>Sembcorp</strong><br />
Marine, a subsidiary of <strong>Sembcorp</strong> <strong>Industries</strong>, as a<br />
non-executive and non-independent director.<br />
Mr Tang is President of the Singapore Water<br />
Association, Vice Chairman of the Singapore Business<br />
Federation and a council member of the Singapore<br />
Chinese Chamber of Commerce and Industry. He also<br />
serves on several China-Singapore, Saudi-Singapore<br />
and Abu Dhabi-Singapore business councils. In<br />
addition, he is a council chairman of Ngee Ann<br />
Polytechnic and a member of the Singapore Chinese<br />
Chamber of Commerce Foundation, as well as a<br />
Vice Chairman and trustee of the Kwong Wai Shiu<br />
Hospital, a charitable hospital which provides care<br />
for needy patients.<br />
Mr Tang holds a First Class Honours in<br />
Mechanical Engineering from the University<br />
of Singapore and completed the Advanced<br />
Management Programme at INSEAD.<br />
Koh Chiap Khiong<br />
Group Chief Financial Officer<br />
Joined 2008<br />
Mr Koh is responsible for the corporate finance<br />
& treasury, reporting, accounts, tax, information<br />
technology and risk management of <strong>Sembcorp</strong><br />
<strong>Industries</strong> and oversees these functions across the<br />
Group. He also handles investor relations matters as<br />
Group Chief Financial Officer (CFO) and is a director<br />
on the boards of various <strong>Sembcorp</strong> companies.<br />
Mr Koh brings with him extensive expertise<br />
in finance, tax, treasury management and audit in<br />
various industries, over 10 years’ experience in<br />
managing infrastructure businesses and a strong<br />
knowledge of the energy and water sectors. He<br />
rejoined <strong>Sembcorp</strong> in 2008 after a three-year stint<br />
with Power Seraya as its CFO. Prior to that, he spent<br />
seven years in <strong>Sembcorp</strong> and served as the Utilities<br />
business’ Head of Finance and Chief Risk Officer.<br />
Mr Koh holds a First Class Honours in Accountancy<br />
from the National University of Singapore.<br />
Wong Weng Sun<br />
President & CEO<br />
<strong>Sembcorp</strong> Marine<br />
Joined 1988<br />
Mr Wong is President & CEO of <strong>Sembcorp</strong><br />
Marine, as well as Managing Director of Jurong<br />
Shipyard. He also sits on the board of a number of<br />
the Group’s subsidiaries including Jurong Shipyard,<br />
Sembawang Shipyard, SMOE and PPL Shipyard.<br />
Prior to his present appointment, Mr Wong<br />
served as President & Chief Operating Officer of<br />
<strong>Sembcorp</strong> Marine. He first joined Jurong Shipyard in<br />
1988 as an engineer before rising to the position of<br />
General Manager in charge of project management.<br />
Mr Wong is the President of the Association<br />
of Singapore Marine <strong>Industries</strong> and sits on the boards<br />
of the Maritime and Port Authority of Singapore and<br />
the Singapore Maritime Foundation. Besides serving<br />
as a member of the Workplace Safety and Health<br />
Council, he is also Chairman of its Work at Height<br />
Safety Taskforce and Deputy Chairman of its Marine<br />
<strong>Industries</strong> Committee. He also chairs the Marine<br />
and Offshore Technology Advisory Committee and<br />
co-chairs the Advisory Committee of the Centre<br />
of Innovation, Marine and Offshore Technology at<br />
Ngee Ann Polytechnic.<br />
Mr Wong holds a Bachelor of Mechanical<br />
Engineering (Marine). He also obtained a Masters<br />
in Business Administration from Oklahoma City<br />
University, USA.<br />
Tan Cheng Guan<br />
Executive Vice President<br />
Group Business & Strategic Development<br />
Joined 2007<br />
Mr Tan is responsible for business and strategic<br />
development at <strong>Sembcorp</strong> and drives business<br />
development for the Group’s energy and water<br />
businesses. He also oversees the Group’s business<br />
in India, the Middle East & Africa, the UK and<br />
the Americas.<br />
He brings with him broad experience in strategy,<br />
business and project development for the utilities<br />
industry. Mr Tan rejoined <strong>Sembcorp</strong> in 2007 after a<br />
three-year stint heading Vopak’s operations in China.<br />
Prior to that, he spent 14 years with <strong>Sembcorp</strong> as<br />
well as over a decade in the oil and gas sector with<br />
Brown & Root Far East. While at <strong>Sembcorp</strong>, Mr Tan<br />
oversaw the early development of the Group’s<br />
Utilities business on Jurong Island and the business’<br />
expansion into China, the UK and the Middle East.<br />
Most recently, he also led <strong>Sembcorp</strong>’s acquisition of<br />
Cascal’s global municipal water business.<br />
Mr Tan holds a Bachelor of Civil Engineering<br />
(Honours) from the University of Liverpool, UK and<br />
completed the Advanced Management Programme<br />
at Harvard Business School, USA.<br />
64 SEMBCORP INDUSTRIES ANNUAL REPORT <strong>2011</strong> GROWING SUSTAINABLE BUSINESSES 65
KEY EXECUTIVES<br />
GROWTH &<br />
PERFORMANCE<br />
Ng Meng Poh<br />
Executive Vice President<br />
Singapore and ASEAN (Utilities)<br />
Joined 2007<br />
Mr Ng is responsible for managing <strong>Sembcorp</strong>’s<br />
Utilities business in Singapore, ASEAN and Australia<br />
and also sits on the boards of various companies<br />
within the Group.<br />
He has over 25 years’ experience in the energy<br />
industry and has held both government and private<br />
sector appointments. Prior to joining <strong>Sembcorp</strong>,<br />
Mr Ng was part of the executive management team<br />
of Senoko Power and also spent over a decade at<br />
Singapore’s Public Utilities Board. In the course of his<br />
career, he was actively involved in the restructuring<br />
and liberalisation of Singapore’s power and gas<br />
markets, as well as in negotiations for the<br />
importation of piped natural gas from Malaysia<br />
and Indonesia into Singapore.<br />
Mr Ng holds a Bachelor of Mechanical<br />
Engineering from the National University<br />
of Singapore and a Masters of Science in Energy<br />
Resources from the University of Pittsburgh, USA.<br />
Low Sin Leng<br />
Executive Chairman<br />
<strong>Sembcorp</strong> Development<br />
Joined 2000<br />
Ms Low spearheads the development of<br />
<strong>Sembcorp</strong>’s Integrated Urban Development business.<br />
Leveraging on her business experience in Asia,<br />
Ms Low is also actively involved in the Group’s<br />
activities in China, Vietnam and Indonesia. She is<br />
a Singapore Representative to the ASEAN Business<br />
Advisory Council and represents <strong>Sembcorp</strong> on several<br />
China-Singapore business councils.<br />
Prior to joining <strong>Sembcorp</strong>, Ms Low was the<br />
Executive Vice President of Singapore Power and<br />
served 20 years in the Singapore Government<br />
Administrative Service holding senior positions in the<br />
Ministries of Finance, Trade & Industry and Education.<br />
A Singapore President’s Scholar, Ms Low holds a<br />
Masters in Business Administration (High Distinction)<br />
from the Catholic University of Leuven, Belgium, as<br />
well as a Bachelor of Electrical Engineering (Honours<br />
with Distinction) from the University of Alberta,<br />
Canada, and completed Harvard Business School’s<br />
Advanced Management Programme in the USA.<br />
Group Business<br />
& Strategic<br />
Development<br />
Tan Cheng Guan<br />
Executive Vice President<br />
Group Project<br />
Development<br />
Venkat Ram<br />
Senior Vice President<br />
Group Asset<br />
Management<br />
Lau Gar Ning<br />
Executive Vice President<br />
Technology<br />
Kwan Yuet Wing<br />
Chief Technology Officer<br />
BUSINESS KEY<br />
MANAGEMENT<br />
Utilities<br />
SINGAPORE & ASEAN<br />
Ng Meng Poh<br />
Executive Vice President<br />
CHINA<br />
Alan Yau<br />
CEO<br />
INDIA<br />
Atul Nargund<br />
Director<br />
<strong>Sembcorp</strong> Utilities India<br />
MIDDLE EAST & AFRICA<br />
Lim Yeow Keong<br />
General Manager<br />
<strong>Sembcorp</strong> Salalah<br />
O&M Services, Oman<br />
William Chang<br />
General Manager<br />
<strong>Sembcorp</strong> Gulf<br />
O&M Company, UAE<br />
Corporate<br />
Headquarters<br />
Koh Chiap Khiong<br />
Group Chief<br />
Financial Officer<br />
Richard Quek<br />
Executive Vice President<br />
Group Mergers<br />
& Acquisitions<br />
Frank Koh<br />
Senior Vice President<br />
Group Corporate Finance<br />
Goh Han Leng<br />
Senior Vice President<br />
Group Tax<br />
Marius Van Aardt<br />
Managing Director<br />
<strong>Sembcorp</strong> Silulumanzi,<br />
South Africa<br />
Shyam P Misra<br />
Managing Director<br />
<strong>Sembcorp</strong> Siza Water,<br />
South Africa<br />
UK<br />
Douglas Annan<br />
Senior Vice President<br />
& Site Director<br />
<strong>Sembcorp</strong> Utilities UK<br />
Roger Harrington<br />
Managing Director<br />
<strong>Sembcorp</strong> Bournemouth<br />
Water<br />
THE AMERICAS<br />
Martin Greenhalgh<br />
Executive President<br />
Chile<br />
Lim Suet Boey<br />
Executive Vice President<br />
& General Counsel<br />
Group Legal<br />
Lau Gar Ning<br />
Chief Health, Safety<br />
& Environment Officer<br />
Kwong Sook May<br />
Company Secretary<br />
Lillian Lee<br />
Senior Vice President<br />
Group Human Resource<br />
Frederic Gautheron<br />
General Manager<br />
Panama and the<br />
Caribbean<br />
Marine<br />
Wong Weng Sun<br />
President & CEO<br />
<strong>Sembcorp</strong> Marine<br />
Managing Director<br />
Jurong Shipyard<br />
Ong Poh Kwee<br />
Deputy President<br />
<strong>Sembcorp</strong> Marine<br />
Managing Director<br />
Sembawang Shipyard<br />
Douglas Tan<br />
Managing Director<br />
PPL Shipyard<br />
Ho Nee Sin<br />
Managing Director<br />
SMOE<br />
Jasmine Teo<br />
Senior Vice President<br />
Group Information<br />
Technology<br />
Lee Swee Chee<br />
Chief Risk Officer<br />
Ng Lay San<br />
Vice President<br />
Group Corporate Relations<br />
Group Internal Audit<br />
David Wong<br />
Vice President<br />
Freddie Woo<br />
Executive Director<br />
Jurong SML<br />
Integrated Urban<br />
Development<br />
Low Sin Leng<br />
Executive Chairman<br />
Kelvin Teo<br />
President & COO<br />
Lim Buey Shyan<br />
Senior Vice President<br />
Design &<br />
Construction<br />
Lim Kah Hing<br />
Senior Vice President<br />
& Managing Director<br />
Mint<br />
Yip Pak Ling<br />
Senior Vice President<br />
& Mint Director<br />
66 SEMBCORP INDUSTRIES ANNUAL REPORT <strong>2011</strong> GROWING SUSTAINABLE BUSINESSES 67
CORPORATE GOVERNANCE<br />
<strong>Sembcorp</strong>’s corporate governance principles are built on our<br />
core value of integrity and reflect our commitment to protect<br />
and enhance shareholder value.<br />
<strong>Sembcorp</strong> aspires to attain the highest standards<br />
Hassan Marican and Tham Kui Seng, who joined the<br />
of corporate governance. The board and management<br />
board on June 1, <strong>2011</strong>. Richard Hale, OBE and Lee<br />
recognise that well-defined corporate governance<br />
Suet Fern were also directors of the company until<br />
processes are essential in enhancing corporate<br />
their retirement from the board at the last <strong>Annual</strong><br />
accountability and long-term sustainability and remain<br />
General Meeting (AGM) held on April 21, <strong>2011</strong>.<br />
committed to ensuring high standards of corporate<br />
The fundamental responsibility of the directors<br />
governance to preserve and maximise shareholder value.<br />
is to exercise their independent judgement to act<br />
In recognition of the company’s continuous<br />
in good faith in what they reasonably believe to be<br />
efforts towards excellent financial reporting and<br />
the best interest of the company, for the creation<br />
extensive disclosures beyond the minimum regulatory<br />
of long-term value for shareholders. The board also<br />
requirements, we were awarded Gold for Best <strong>Annual</strong><br />
relies on the integrity and due diligence of senior<br />
<strong>Report</strong> (for companies with market capitalisation of<br />
management, external auditors and advisors to<br />
S$1 billion and above) at the Singapore Corporate<br />
oversee the Group’s overall performance objectives,<br />
Awards <strong>2011</strong>. We were also named the Most<br />
key operational initiatives, financial plans and annual<br />
Transparent Company (Multi-industry /<br />
budget, major investments, divestment and funding<br />
Conglomerates) at the Securities Investors Association<br />
proposals, financial performance reviews, risk<br />
(Singapore) Investors’ Choice Awards <strong>2011</strong>.<br />
management and corporate governance practices.<br />
This report sets out the company’s corporate<br />
To assist the board in in the the efficient discharge of its of<br />
governance processes and activities for the financial<br />
its responsibilities and and provide provide independent oversight of<br />
year with reference to the principles set out in the<br />
of management, several several board board committees, including<br />
Singapore Code of Corporate Governance 2005<br />
the Executive Committee, Audit Committee,<br />
(Code). The board is pleased to report that the<br />
Executive Resource & Compensation Committee,<br />
company has substantially complied with the principles<br />
Nominating Committee and Risk Committee, have<br />
and guidelines set out in the Code. Deviations from<br />
been established with written Terms of Reference<br />
the Code, if any, are explained under the respective<br />
(TOR). Primarily made up of independent non-<br />
sections. The company continually reviews and refines<br />
executive directors, each committee makes decisions<br />
its processes in light of the best practice, consistent<br />
on matters within its TOR and applicable limits<br />
with the needs and the circumstances of the Group.<br />
of authority, and recommends the course of action<br />
for the board’s consideration on such matters. The<br />
Board of Directors<br />
committees’ respective composition, roles and<br />
Effective board to lead and effect controls<br />
responsibilities are further explained in this report.<br />
(Principle 1)<br />
Minutes of board committee meetings are circulated<br />
<strong>Sembcorp</strong> is led by an effective board comprising<br />
to the board to keep directors updated on the<br />
mainly independent non-executive directors. The<br />
activities of each committee. Special purpose<br />
board is headed by Ang Kong Hua. He is joined on the<br />
committees are also established as dictated by<br />
board by Tang Kin Fei, Goh Geok Ling, Evert Henkes,<br />
business imperatives. For instance, the Technology<br />
Bobby Chin Yoke Choong, Margaret Lui, Tan Sri Mohd<br />
Committee, which is not a board committee,<br />
is chaired by Mr Ang to lead the Group in setting<br />
up a framework to better manage existing and new<br />
technologies and research and development activities<br />
relating to the businesses of the Group. More details<br />
about the Technology Committee are explained in<br />
the Sustainability section of this annual report.<br />
The composition of the board committees is<br />
structured to ensure an equitable distribution of<br />
responsibilities among board members, maximise the<br />
effectiveness of the board and foster active participation<br />
and contribution. Diversity of experience and appropriate<br />
skills are considered along with the need to maintain<br />
appropriate checks and balances between the different<br />
committees. Hence, membership of the Executive<br />
Committee (ExCo), with its greater involvement in key<br />
business and executive decisions, and membership of<br />
the Audit and Risk Committees, with their respective<br />
oversight roles, are mutually exclusive.<br />
Board meetings are scheduled on a quarterly<br />
basis to review and approve the release of the<br />
quarterly results and discuss reports by management<br />
on the Group’s financial performance, business<br />
development plans and prospects. A board meeting<br />
is also held at the end of each financial year to<br />
review the Group’s strategy going forward and to<br />
consider and approve the Group’s budget for the<br />
following year. Twice a year, the board also sets aside<br />
time during its scheduled meetings without the<br />
presence of management to discuss management’s<br />
performance. Further board meetings may also be<br />
held to specifically consider other issues arising.<br />
Decisions of the board and board committees may<br />
also be obtained via circular resolutions. A two-day<br />
offsite board and management strategy meeting was<br />
organised in July <strong>2011</strong> to discuss in depth the<br />
strategic issues and direction of the Group. This also<br />
gave non-executive directors a better understanding<br />
of the Group and its businesses, and provided an<br />
opportunity for the non-executive directors to<br />
familiarise themselves with the management team.<br />
To assist directors in planning for their attendance,<br />
board and board committee meetings as well as<br />
the AGM are scheduled one year in advance,<br />
and telephonic attendance and conference via<br />
audio-visual communication are allowed under the<br />
company’s Articles of Association. The company<br />
recognises that to focus on a director’s attendance<br />
at formal meetings alone may lead to a narrow view<br />
of his contribution. Directors’ contributions may be<br />
made in many other forms, such as bringing strategic<br />
relationships to the Group, providing guidance to<br />
management or offering an exchange of views<br />
outside the formal environment of the board or board<br />
committee meetings. Notwithstanding this, the<br />
company encourages active participation at formal<br />
meetings of the board.<br />
The Group has adopted a set of internal controls<br />
and guidelines that set out financial authorisation<br />
and approval limits for borrowings, including offbalance<br />
sheet commitments, investments,<br />
acquisitions, disposals, capital and operating<br />
expenditures, requisitions and expenses. The board<br />
or ExCo approves transactions exceeding certain<br />
threshold limits, while delegating authority for<br />
transactions below those limits to management so<br />
as to facilitate operational efficiency.<br />
The ExCo is chaired by Mr Ang and its members<br />
include Mr Goh, Mr Tang and Mrs Lui, who joined<br />
the ExCo in January <strong>2011</strong>.<br />
Within the limits of authority delegated by<br />
the board, the ExCo reviews and approves business<br />
opportunities, strategic investments, divestments,<br />
and major capital and operating expenditures. The<br />
ExCo also evaluates and recommends larger<br />
investments, capital and operating expenditures,<br />
as well as divestments to the board for approval.<br />
Directors are briefed on changes to regulations,<br />
guidelines and accounting standards from time to<br />
time either during board meetings or at specially<br />
convened sessions, including sponsored training<br />
sessions and seminars conducted by external<br />
professionals. Articles and reports relevant to the<br />
Group’s businesses are also circulated to the directors<br />
for information. The company conducts orientation<br />
programmes for newly-appointed directors where<br />
comprehensive presentations on <strong>Sembcorp</strong>’s strategic<br />
68 SEMBCORP INDUSTRIES ANNUAL REPORT <strong>2011</strong> GROWING SUSTAINABLE BUSINESSES 69
CORPORATE GOVERNANCE<br />
plans and direction, financial performance as well as<br />
business activities in the various geographical markets<br />
are given by senior management. In addition, the<br />
Group President & CEO briefs the board at each<br />
meeting on the business and project developments.<br />
A formal letter is also sent to newly-appointed<br />
directors upon their appointment explaining the<br />
Group’s governance policies and practices, as well as<br />
their duties and obligations as directors. The newlyappointed<br />
director also receives an information pack<br />
which contains the Group’s organisation structure,<br />
senior management’s contact details, the company’s<br />
Memorandum & Articles of Association, respective<br />
committees’ TORs, Group Policy relating to disclosure<br />
of interests in securities and prohibition on dealings in<br />
<strong>Sembcorp</strong> securities, and guidelines on directors’ fees.<br />
Further, facility visits to our subsidiaries’ operation sites<br />
are arranged to provide newly-appointed directors an<br />
understanding of the Group’s business operations.<br />
Existing directors are also invited to participate in such<br />
facility visits and orientation programmes.<br />
Strong and independent board exercising<br />
objective judgement (Principle 2)<br />
The current board comprises eight directors,<br />
of whom six are independent directors. Excluding<br />
the Group President & CEO, all the directors are<br />
non-executive, including the Chairman.<br />
The board members comprise business leaders<br />
and professionals with strong relevant experience in<br />
the Group’s businesses. Best efforts have been made<br />
to ensure that, in addition to contributing their<br />
valuable expertise and insight to board deliberations,<br />
each director brings to the board an independent<br />
and objective perspective to enable balanced and<br />
well-considered decisions to be made. Given that the<br />
majority of the board comprises non-executive<br />
directors who are independent of management and<br />
independent in terms of character and judgement,<br />
objectivity on issues deliberated is assured. Profiles<br />
of the directors may be found on pages 60 to 63.<br />
The Nominating Committee (NC) ensures that the<br />
board maintains at an appropriate size and comprises<br />
members with a balance of skill, attributes, knowledge<br />
and experience. While reviewing the re-appointment<br />
and re-election of directors, the NC also considers the<br />
directors’ other board directorship representations and<br />
ensures that directors have sufficient time to devote to<br />
their duties. Through the delegation of its authority to<br />
the NC, the board has applied its best efforts to ensure<br />
that the directors appointed possess the background,<br />
experience and knowledge in business, finance and<br />
related industries, as well as management skills critical<br />
to the company’s businesses.<br />
The NC is chaired by Mr Ang, who is joined on<br />
the committee by Mr Goh and Mrs Lui. In line with the<br />
Code, Mr Ang is not a substantial shareholder of the<br />
company, nor is he directly associated with Temasek<br />
Holdings, a substantial shareholder of the company.<br />
Every year, the NC reviews the independence<br />
of directors. To this end, each director is required<br />
to complete a Director’s Independence Checklist<br />
on an annual basis to confirm his independence.<br />
The checklist is drawn up based on the assessment<br />
guidelines provided in the Code and further requires<br />
each director to assess whether he considers himself<br />
independent despite not being involved in any of<br />
the relationships identified in the Code. The NC will<br />
then review the checklist completed by each director<br />
to determine whether that director is independent.<br />
For the year under review, with the exception of<br />
Mr Tang, who is Group President & CEO and an<br />
executive director, and Mrs Lui who is the Chief<br />
Operating Officer of Seatown Holdings International,<br />
a related company of Temasek Holdings, the NC has<br />
ascertained that all the other non-executive directors,<br />
including Tan Sri Mohd Hassan Marican who is<br />
appointed a Senior International Advisor of Temasek<br />
International Advisors, a subsidiary of Temasek<br />
Holdings, are independent. The NC believes that<br />
Tan Sri Mohd Hassan Marican is able to exercise<br />
strong independent judgement in his deliberations<br />
and act in the best interest of the company as his<br />
appointment is non-executive in nature and does not<br />
entail involvement in the day-to-day conduct of<br />
Temasek Holdings’ businesses.<br />
Chairman and Chief Executive Officer (Principle 3)<br />
The Chairman and the Group President & CEO<br />
are not related to each other. The roles of Chairman<br />
and the Group President & CEO are kept separate to<br />
ensure an appropriate balance of power, increased<br />
accountability and greater capacity of the board for<br />
independent decision making.<br />
The Chairman, who is non-executive, leads and<br />
ensures effective and comprehensive board discussion<br />
on matters brought to the board including strategic<br />
issues as well as business planning. The Chairman<br />
monitors that the board’s decisions are translated into<br />
executive action. The Group President & CEO’s primary<br />
role is to effectively manage the operations of the<br />
Group in accordance with the Group’s strategies and<br />
policies and provide close oversight, guidance, advice<br />
and leadership to senior management.<br />
Formal appointment and re-election of directors<br />
(Principle 4)<br />
<strong>Sembcorp</strong>’s board is periodically reviewed to<br />
ensure strong, independent and sound leadership<br />
for the continuous success of the company and its<br />
businesses. The board also recognises the<br />
Board Members for <strong>2011</strong><br />
contribution of directors who, over time, have<br />
developed deep insights into the Group’s businesses<br />
and exercises its discretion to retain the services<br />
of such directors where appropriate.<br />
The NC supports and advises the company by<br />
nominating suitable board candidates to maintain the<br />
board’s balance of skills, attributes, knowledge and<br />
experience. Appointments to the board are made on<br />
merit and against objective criteria. Candidates must<br />
be able to discharge their responsibilities as directors<br />
while upholding the highest standards of governance<br />
practised by the Group. While the directors may have<br />
several directorships in other companies, the NC<br />
takes care to ensure and is satisfied that appointees<br />
have contributed adequate time to meet the<br />
expectations of their role as directors.<br />
The company subscribes to the principle that all<br />
directors including the Group President & CEO should<br />
retire and submit themselves for re-election at regular<br />
intervals, subject to their continued satisfactory<br />
performance. The company’s Articles of Association<br />
requires a third of its directors to retire and subject<br />
themselves to re-election by shareholders at every<br />
AGM (one-third rotation rule).<br />
Date of first Date of last re-election /<br />
Position held appointment re-appointment<br />
Director on the board to the board as director Nature of appointment<br />
Ang Kong Hua Chairman Feb 26, 2010 Apr 22, 2010 Non-executive & Independent<br />
Tang Kin Fei Director May 1, 2005 Apr 21, <strong>2011</strong> Executive & Non-independent<br />
Goh Geok Ling Director May 3, 2000 Apr 22, 2010 * Non-executive & Independent<br />
Evert Henkes Director Apr 30, 2004 Apr 22, 2010 * Non-executive & Independent<br />
Bobby Chin Yoke Choong Director Dec 1, 2008 Apr 20, 2009 * Non-executive & Independent<br />
Margaret Lui Director Jun 1, 2010 Apr 21, <strong>2011</strong> Non-executive & Non-independent<br />
Tan Sri Mohd Hassan Marican Director Jun 16, 2010 Apr 21, <strong>2011</strong> Non-executive & Independent<br />
Tham Kui Seng Director Jun 1, <strong>2011</strong> N.A. * Non-executive & Independent<br />
Richard Hale, OBE Director Sep 1, 2000 Apr 22, 2010 Non-executive & Independent<br />
(Retired on<br />
Apr 21, <strong>2011</strong>)<br />
Lee Suet Fern Director Jul 1, 2005 Apr 20, 2009 Non-executive & Independent<br />
(Retired on<br />
Apr 21, <strong>2011</strong>)<br />
*<br />
Up for retirement at the upcoming AGM<br />
70 SEMBCORP INDUSTRIES ANNUAL REPORT <strong>2011</strong> GROWING SUSTAINABLE BUSINESSES 71
CORPORATE GOVERNANCE<br />
Composition of Board and Board Committees for <strong>2011</strong><br />
Executive<br />
Resource<br />
&<br />
Executive Audit Risk Compensation Nominating<br />
Committee Committee Committee Committee Committee<br />
Board Member (ExCo) (AC) (RC) (ERCC) (NC)<br />
Ang Kong Hua Chairman Chairman Chairman<br />
Tang Kin Fei<br />
Member<br />
Goh Geok Ling Member Member Member<br />
Evert Henkes 1 Member Chairman<br />
Bobby Chin Yoke Choong 2 Chairman Member<br />
Margaret Lui 3 Member Member Member<br />
Tan Sri Mohd Hassan Marican 4 Member Member<br />
Tham Kui Seng 5<br />
Richard Hale, OBE 6 Chairman Chairman<br />
(Retired on Apr 21, <strong>2011</strong>)<br />
Lee Suet Fern 7 Member Member<br />
(Retired on Apr 21, <strong>2011</strong>)<br />
Directors’ Attendance at Board and Board Committee Meetings in <strong>2011</strong><br />
Executive<br />
Resource &<br />
Executive Compensation Nominating<br />
Board Meeting<br />
Committee Audit Risk Committee Committee<br />
(ExCo) Committee Committee (ERCC) (NC)<br />
Board Member Scheduled Ad-hoc Meeting (AC) Meeting (RC) Meeting Meeting Meeting *<br />
Total No. of Meetings 5 3 6 4 4 3 –<br />
Held in <strong>2011</strong><br />
Ang Kong Hua 5/5 3/3 6/6 – – 3/3<br />
*<br />
Tang Kin Fei 5/5 3/3 6/6 – – – –<br />
Goh Geok Ling 5/5 3/3 6/6 – – 2/3<br />
*<br />
Evert Henkes 1 5/5 2/3 – 3/3 4/4 – –<br />
Bobby Chin Yoke Choong 2 5/5 3/3 – 4/4 4/4 – –<br />
Margaret Lui 3 5/5 3/3 5/6 – – 3/3<br />
*<br />
Tan Sri Mohd Hassan Marican 4 5/5 3/3 – 4/4 3/3 – –<br />
Tham Kui Seng 5 3/3 1/1 – – – – –<br />
Richard Hale, OBE 6 0/1 0/1 – 0/1 0/1 – –<br />
(Retired on Apr 21, <strong>2011</strong>)<br />
Lee Suet Fern 7 1/1 1/1 – 1/1 1/1 – –<br />
(Retired on Apr 21, <strong>2011</strong>)<br />
1<br />
Evert Henkes was appointed Chairman of RC and a member of AC on Apr 21, <strong>2011</strong> and May 1, <strong>2011</strong> respectively.<br />
2<br />
Bobby Chin was appointed Chairman of AC on Apr 21, <strong>2011</strong>.<br />
3<br />
Margaret Lui was appointed a member of ExCo on Jan 1, <strong>2011</strong>.<br />
4<br />
Tan Sri Mohd Hassan Marican was appointed a member of AC and RC on Jan 1, <strong>2011</strong> and May 1, <strong>2011</strong> respectively.<br />
5<br />
Tham Kui Seng was appointed an independent non-executive director on Jun 1, <strong>2011</strong>.<br />
6<br />
Richard Hale, OBE retired as an independent non-executive director and Chairman of AC and RC on Apr 21, <strong>2011</strong>.<br />
7<br />
Lee Suet Fern retired as an independent non-executive director and member of AC and RC on Apr 21, <strong>2011</strong>.<br />
*<br />
Decisions by NC were made via circular resolution.<br />
Prior to seeking shareholders’ approval at the<br />
AGM, the NC reviews and considers the retirement<br />
and re-election of directors. In addition, a newlyappointed<br />
director submits himself for retirement<br />
and re-election at the AGM immediately following<br />
his appointment. Thereafter, he is subject to the<br />
one-third rotation rule. Directors who are above the<br />
age of 70 are also statutorily required to seek<br />
re-appointment at each AGM.<br />
Pursuant to the one-third rotation rule, Mr Henkes<br />
and Mr Chin will retire and submit themselves for<br />
re-election at the forthcoming AGM. Mr Tham, who<br />
was newly appointed to the board on June 1, <strong>2011</strong>,<br />
will also submit himself for retirement and re-election<br />
by shareholders at the forthcoming AGM.<br />
In addition, Mr Goh, who has turned 70 years old<br />
in September <strong>2011</strong>, will also submit his retirement<br />
and offer himself for re-appointment pursuant to the<br />
Companies Act. Although Mr Goh has served on the<br />
board since 2000, the board considers his contribution<br />
significant and valuable as he possesses in-depth<br />
knowledge of the businesses of the Group. The board<br />
believes that Mr Goh’s tenure would not materially<br />
interfere with his ability to exercise independent<br />
judgement in his deliberations and act in the best<br />
interests of the Group and its shareholders.<br />
Board Performance and Conduct of Its Affairs<br />
Active participation and valuable contributions<br />
are key to overall effectiveness of the board<br />
(Principle 5)<br />
Each year, the board undertakes an informal<br />
assessment of its performance to identify key areas<br />
for improvement and requisite follow-up actions. To<br />
provide feedback to aid in this assessment, each<br />
director is required to complete a questionnaire on<br />
the effectiveness of the board as a whole. This<br />
questionnaire considers factors such as the size and<br />
composition of the board, directors’ access to<br />
information, board processes and accountability,<br />
committee effectiveness as well as board performance<br />
in relation to its principal functions and<br />
communication with senior management. The<br />
collective evaluation and feedback is then<br />
consolidated and presented to the board for<br />
discussion to highlight areas of strength and<br />
weakness for continuous improvement of the<br />
board and its committees.<br />
The NC feels that the financial indicators set out in<br />
the Code as guidelines for the evaluation of the board<br />
are more a measure of management’s performance<br />
and therefore less applicable to directors. The NC<br />
believes that board performance is ultimately reflected<br />
in the long-term performance of the Group.<br />
Full Access to Information and Resources<br />
Directors have complete, adequate and timely<br />
information and resources (Principle 6)<br />
To assist the board in discharging its duties and to<br />
keep abreast of the Group’s operational and financial<br />
performance, key issues, challenges and<br />
opportunities, <strong>Sembcorp</strong>’s management furnishes<br />
adequate management and operation reports as well<br />
as financial statements to the board on a regular<br />
basis. As a general rule, board and board committee<br />
papers are submitted to directors at least three<br />
working days before each meeting so that they may<br />
better understand the matters prior to the meeting<br />
and discussions may be focused on questions that<br />
the directors have on these matters. Members of<br />
senior management who may provide insight into<br />
the matters to be discussed are also called on to be<br />
present during the relevant discussions.<br />
Financial highlights of the Group’s performance<br />
and key developments are presented on a quarterly<br />
basis at board meetings. The Group President & CEO,<br />
Group Chief Financial Officer and members of senior<br />
management are present at these presentations to<br />
address any queries which the board may have.<br />
The Company Secretary facilitates good<br />
information flow between the board and its<br />
committees and senior management, in addition to<br />
attending to corporate secretarial matters such as<br />
arranging orientation for newly-appointed directors.<br />
72 SEMBCORP INDUSTRIES ANNUAL REPORT <strong>2011</strong> GROWING SUSTAINABLE BUSINESSES 73
CORPORATE GOVERNANCE<br />
In consultation with the Chairman and the Group<br />
President & CEO, the Company Secretary assists the<br />
board with the preparation of meeting agendas,<br />
and administers, attends and prepares minutes of<br />
board proceedings. She also assists the board on<br />
the compliance of the Group with the Memorandum<br />
and Articles of Association and regulations, including<br />
requirements of the Companies Act, Securities &<br />
Futures Act and the SGX-ST. She liaises with the<br />
SGX-ST, the Accounting and Corporate Regulatory<br />
Authority and, when necessary, shareholders.<br />
The board has ready and independent access<br />
to the Group President & CEO, senior management,<br />
the Company Secretary and internal and external<br />
auditors at all times. The board exercises its discretion<br />
to seek independent professional advice at the<br />
company’s expense, if deemed necessary, to ensure<br />
that full information is available before important<br />
decisions are made.<br />
Competitive Remuneration System<br />
Remuneration of directors adequate and not<br />
excessive (Principle 7)<br />
The Executive Resource & Compensation<br />
Committee (ERCC) is chaired by Mr Ang and its<br />
members include Mr Goh and Mrs Lui.<br />
The ERCC is responsible for ensuring a formal<br />
procedure for developing and reviewing policies<br />
on compensation and development of the Group’s<br />
senior management. It assists the board to ensure<br />
that competitive remuneration policies and practices<br />
are in place to attract, motivate and retain talented<br />
executives. The ERCC also reviews the remuneration<br />
of the board members.<br />
The ERCC reviews succession planning for key<br />
positions in the Group and the leadership pipeline for<br />
the organisation. It reviews the development of senior<br />
staff and assesses their strengths and development<br />
needs based on the Group’s leadership competencies<br />
framework, with the aim of building talent and<br />
maintaining strong and sound leadership for the<br />
Group. The ERCC conducts a succession planning<br />
review of the Group President & CEO, officers<br />
reporting directly to him, as well as selected key<br />
positions in the company on an annual basis. Potential<br />
internal and external candidates for succession are<br />
reviewed for different time horizons according to<br />
immediate, medium-term and long-term needs.<br />
The ERCC also establishes guidelines on sharebased<br />
incentives and other long-term incentive plans<br />
and approves the grant of such incentives to key<br />
executives. These incentives aim to motivate<br />
executives to maximise operating and financial<br />
performance and shareholder value, and are aimed<br />
at aligning the interests of the executives with those<br />
of shareholders.<br />
The ERCC has access to expert professional advice<br />
on human resource matters whenever there is a need<br />
for such external consultations. In its deliberations,<br />
the ERCC takes into consideration industry practices<br />
and norms of compensation. The Group President &<br />
CEO does not attend discussions relating to his own<br />
compensation, terms and conditions of service, or the<br />
review of his performance. No ERCC member or any<br />
director is involved in deliberations in respect of any<br />
remuneration, compensation, share-based incentives<br />
or any form of benefits to be granted to himself.<br />
Competitive reward system to ensure highest<br />
performance and retention of best talents and<br />
key executives (Principle 8)<br />
<strong>Sembcorp</strong> believes that a competitive remuneration<br />
and reward system based on individual performance<br />
is important in order to retain and incentivise the best<br />
talents. <strong>Sembcorp</strong>’s remuneration and reward system<br />
is also responsive to the economic climate as well as<br />
the performance of the Group and its business units.<br />
The Group President & CEO, as an executive<br />
director, does not receive director’s fees. As a lead<br />
member of management, his compensation consists<br />
of his salary, allowances, bonuses and share-based<br />
incentives conditional upon meeting certain<br />
performance targets. Details on the share-based<br />
incentives and the performance targets are available<br />
in the Directors’ <strong>Report</strong> and Note 4 in the Notes<br />
to the Financial Statements.<br />
In its yearly review, the ERCC, with the advice and<br />
assistance from compensation consultant, updated<br />
the compensation framework of non-executive<br />
directors. To align the interests of the non-executive<br />
directors with the interests of shareholders, up to<br />
30% of the aggregate directors’ fees approved by<br />
shareholders for a particular financial year may be<br />
paid out in the form of restricted share awards under<br />
the <strong>Sembcorp</strong> <strong>Industries</strong> Restricted Share Plan 2010.<br />
The following Directors’ Compensation<br />
Framework is based on a scale of fees divided into<br />
basic retainer fees, attendance fees, fees for service<br />
on board committees and travel allowance:<br />
Directors’ Compensation by Type<br />
of Appointment<br />
S$<br />
Board of Directors<br />
Basic fee 65,000<br />
Chairman’s allowance 80,000<br />
Executive Committee<br />
Chairman’s allowance 40,000<br />
Member’s allowance 25,000<br />
Audit Committee<br />
Chairman’s allowance 40,000<br />
Member’s allowance 25,000<br />
Executive Resource & Compensation<br />
Committee / Nominating Committee<br />
Chairman’s allowance 25,000<br />
Member’s allowance 15,000<br />
Risk Committee<br />
Chairman’s allowance 25,000<br />
Member’s allowance 15,000<br />
Notes:<br />
1 Tang Kin Fei, as an executive director, does not receive director’s fees.<br />
2 The Executive Resource & Compensation Committee and the Nominating<br />
Committee have the same members, who each receives one payment for<br />
service on both committees.<br />
3 The directors also receive attendance fees of S$4,500 for each board<br />
meeting; and S$2,200 for each committee meeting.<br />
4 The directors receive additional travel allowance for travelling out-country<br />
to attend board and / or committee meetings:<br />
Duration of travel (to and fro) ≤4 hrs: S$2,000; >4 to 15 hrs: S$5,000;<br />
>15 hrs: S$10,000<br />
The directors’ cash fees and share awards will only<br />
be paid and granted upon approval by shareholders<br />
at the forthcoming AGM of the company.<br />
For the year <strong>2011</strong>, the awards granted under the<br />
<strong>Sembcorp</strong> <strong>Industries</strong> Restricted Share Plan 2010 to<br />
all directors as part of their directors’ fees (except for<br />
Mr Tang, who is the Group President & CEO and<br />
does not receive any directors’ fees) will consist of<br />
the grant of fully paid shares outright with no<br />
performance and vesting conditions attached, but<br />
with a selling moratorium. Non-executive directors<br />
are required to hold shares (including shares obtained<br />
by other means) worth at least one-time the annual<br />
base retainer (currently S$65,000); any excess may be<br />
sold as desired. A non-executive director can dispose<br />
of all of his shares one year after leaving the board.<br />
The actual number of shares to be awarded to<br />
each non-executive director will be determined by<br />
reference to the volume-weighted average price<br />
of a share on the SGX-ST over the 14 trading days<br />
immediately following the date of the AGM. The<br />
number of shares to be awarded will be rounded<br />
down to the nearest hundred and any residual<br />
balance will be settled in cash.<br />
The company does not have a retirement<br />
remuneration plan for non-executive directors.<br />
Key executives are rewarded based on actual<br />
performance relative to pre-agreed performance<br />
targets, which include financial and non-financial<br />
performance indicators such as economic value<br />
added (EVA), total shareholder return and promoting<br />
and maintaining health, safety and environmental<br />
standards. The Group believes that the current<br />
reward systems are in line with market norms and<br />
formulated to motivate executives to give their best<br />
to the Group. Rewards include long-term sharebased<br />
incentives, which would further ensure the<br />
retention of the most talented and high-performing<br />
executives in the Group. For further details on the<br />
share-based incentives and performance targets,<br />
please refer to the Directors’ <strong>Report</strong> and Note 4<br />
in the Notes to the Financial Statements.<br />
74 SEMBCORP INDUSTRIES ANNUAL REPORT <strong>2011</strong> GROWING SUSTAINABLE BUSINESSES 75
CORPORATE GOVERNANCE<br />
The Group has an incentive compensation plan<br />
for key executives that is tied to the creation of EVA,<br />
as well as to the achievement of individual and<br />
Group performance goals. A ‘bonus bank’ is used<br />
to hold incentive compensation credited in any year.<br />
Typically, one-third of the available balance is paid<br />
out in cash each year and the balance carried<br />
forward to the following year. Such carried-forward<br />
balances of the bonus bank may either be reduced<br />
or increased in future, based on the yearly EVA<br />
performance of the Group and its subsidiaries.<br />
Disclosure on remuneration (Principle 9)<br />
The directors’ fees totalled S$1,280,613 in <strong>2011</strong>,<br />
comprising S$896,429 in cash (2010: S$937,626)<br />
derived using the compensation structure above and<br />
S$384,184 to be paid in the form of restricted share<br />
awards under <strong>Sembcorp</strong> <strong>Industries</strong> Restricted Stock Share<br />
Plan 2010.<br />
More information on directors and key<br />
executives’ remuneration may be found under the<br />
related item in the Supplementary Information<br />
section of the Financial Statements.<br />
The board is accountable to the shareholders<br />
(Principle 10)<br />
<strong>Sembcorp</strong> is committed to open and honest<br />
communication with shareholders at all times. The<br />
company presents a balanced, clear and coherent<br />
assessment of the Group’s performance, position and<br />
prospects to shareholders through the timely release<br />
of its quarterly and annual financial reports.<br />
The company believes that prompt compliance<br />
with statutory reporting requirements is imperative<br />
to maintaining shareholders’ confidence and trust in<br />
the company. In line with stock exchange<br />
requirements, negative assurance statements were<br />
issued by the board to accompany the company’s<br />
quarterly financial results announcements, confirming<br />
that to the best of its knowledge, nothing had come<br />
to its attention which would render the company’s<br />
quarterly results false or misleading.<br />
Audit Committee (Principle 11)<br />
The Audit Committee (AC) comprises directors<br />
who are both independent and non-executive. The<br />
AC was chaired by Mr Hale until his retirement from<br />
the board at the AGM on April 21, <strong>2011</strong>. Mr Chin,<br />
an existing member of the AC, took over as<br />
Chairman with effect from April 21, <strong>2011</strong>. The other<br />
members are Tan Sri Mohd Hassan Marican and<br />
Mr Henkes, who joined the AC in January and May<br />
<strong>2011</strong> respectively. Mrs Lee was also a member of the<br />
AC until her retirement from the board in April <strong>2011</strong>.<br />
The AC assists the board in fulfilling its fiduciary<br />
responsibilities relating to the internal controls, audit<br />
and accounting and reporting practices of the Group.<br />
Its main responsibilities are to review the company’s<br />
policies and control procedures with the external<br />
auditors, internal auditors and management and act<br />
in the interest of the shareholders in respect of<br />
interested person transactions as well as any matters<br />
or issues that affect the financial performance of the<br />
Group. The AC reviews the quarterly, half-yearly and<br />
full-year results announcements, accompanying press<br />
releases and presentation slides as well as the<br />
financial statements of the Group and company<br />
before they are submitted to the board for approval.<br />
Each year, the AC also reviews the independence<br />
of the company’s external auditors and makes<br />
recommendations to the board on the re-appointment<br />
of the company’s external auditors. The AC meets<br />
the external and internal auditors at least once a year<br />
without the presence of management.<br />
The AC has explicit authority to investigate any<br />
matter within its TOR and enjoys full access to and<br />
co-operation from management to enable it to<br />
discharge its function properly.<br />
Where relevant, the AC is guided by the<br />
recommended best practices for audit committees<br />
as set out in the Guidebook for Audit Committees<br />
issued by Singapore’s Audit Committee Guidance<br />
Committee in October 2008.<br />
The AC has reviewed the nature and extent of<br />
non-audit services provided by the external auditors<br />
to the Group for the year, excluding services provided<br />
to <strong>Sembcorp</strong> Marine, a listed subsidiary that has its<br />
own audit committee. The AC is satisfied that the<br />
independence of the external auditors has not been<br />
impaired by their provision of non-audit services.<br />
Details of non-audit fees payable to the external<br />
auditors are found in Note 35(b) in the Notes to<br />
the Financial Statements.<br />
The AC also oversees the Group’s whistle-blowing<br />
policy.<br />
Internal control and risk management (Principle 12)<br />
The board and management of the company are<br />
fully committed to a robust system of internal<br />
controls, procedures and risk management to<br />
safeguard shareholders’ interests and the Group’s<br />
assets, and to manage risks. The company seeks to<br />
improve internal control and risk management on an<br />
ongoing basis to ensure that they remain sound and<br />
relevant. The board, with the concurrence of the AC<br />
and Risk Committee (RC), is of the opinion that the<br />
operational, financial and compliance controls are<br />
adequate to meet the needs of the Group in the<br />
current business environment. This assessment is<br />
based on risk mitigating measures taken by<br />
management, work done by the company’s Group<br />
Internal Audit and Group Risk Management<br />
departments, as well as the statutory audit(s)<br />
conducted by external auditors. Internal controls,<br />
because of their inherent limitations, can provide<br />
reasonable but not absolute assurance regarding<br />
the achievement of their intended control objectives.<br />
In this regard, the board will ensure that if any<br />
significant internal control failings or weaknesses<br />
were to arise, necessary remedial actions would<br />
be swiftly taken.<br />
During the year under review, the RC was<br />
chaired by Mr Hale until his retirement in April <strong>2011</strong>.<br />
Mr Henkes took over as Chairman of the RC with<br />
effect from April 21, <strong>2011</strong>. The other members<br />
include Mr Chin and Tan Sri Mohd Hassan Marican,<br />
who joined the RC in May <strong>2011</strong>. Mrs Lee was a<br />
member of the RC until she retired from the board<br />
in April <strong>2011</strong>. The RC’s main role and function is<br />
to assist the board in overseeing risk management<br />
for the Group. It appraises the adequacy and<br />
effectiveness of the Group’s risk management plans,<br />
systems, processes and procedures, Group-wide risk<br />
policies, guidelines and limits, as well as its risk<br />
portfolio, risk levels, and risk mitigation strategies.<br />
For more information on the company’s enterprise<br />
risk management system, please refer to page 80.<br />
Internal Audit<br />
Independent internal audit function (Principle 13)<br />
The internal audit function of the Group is<br />
performed by the Group Internal Audit department<br />
(GIA), which reports directly to the AC on audit<br />
matters and to the Group President & CEO on<br />
administrative matters.<br />
GIA adopts a risk-based methodology in defining<br />
its annual internal audit plan, which is reviewed<br />
and approved by the AC. The internal audits<br />
performed are aimed at ensuring that the Group<br />
maintains a sound system of internal controls and<br />
that the operations comply with the internal controls<br />
framework. GIA also assists the board and<br />
management in the discharge of their corporate<br />
governance responsibilities as well as in improving<br />
and promoting effective and efficient business<br />
processes within the Group. To ensure that the<br />
internal audits are performed by competent<br />
professionals, GIA employs qualified staff and<br />
identifies and provides training and development<br />
opportunities for them so that their technical<br />
knowledge remains current and relevant. GIA is<br />
guided by and has met the standards for the<br />
professional practice of internal audit promulgated<br />
by the Institute of Internal Auditors.<br />
The board has been kept informed of the AC’s<br />
review of GIA’s reports and the management controls<br />
in place, and is satisfied that GIA is adequately<br />
resourced and given appropriate authority and<br />
support within the company to carry out its audits.<br />
76 SEMBCORP INDUSTRIES ANNUAL REPORT <strong>2011</strong> GROWING SUSTAINABLE BUSINESSES 77
CORPORATE GOVERNANCE<br />
Whistle-blowing Policy<br />
To strengthen corporate governance and ethical<br />
business practices across the Group, the company<br />
has implemented a whistle-blowing policy and<br />
procedures which provide employees with accessible<br />
channels to GIA to report suspected fraud, corruption,<br />
dishonest practices or other misdemeanors. The aim<br />
of this policy is to encourage the reporting of such<br />
matters in good faith, with the confidence that<br />
employees making such reports will, to the extent<br />
possible, be protected from reprisal.<br />
For more information on the whistle-blowing<br />
policy, please refer to page 81.<br />
Communication with Shareholders<br />
Regular, effective and equal treatment of<br />
shareholders (Principle 14)<br />
<strong>Sembcorp</strong> remains committed to upholding high<br />
standards of corporate transparency and disclosure.<br />
The company disseminates all price-sensitive and<br />
material information to its shareholders via SGXNET<br />
on a non-selective basis and keeps all stakeholders<br />
informed of its corporate activities in a timely and<br />
consistent manner. Financial and other performance<br />
data is given for the Group as well as business units<br />
where appropriate, to provide shareholders with a<br />
better insight into the Group’s performance. The date<br />
of the release of quarterly results is disclosed at least<br />
two weeks prior to the date of announcement via<br />
SGXNET. On the day of announcement, the financial<br />
statements as well as the accompanying press release<br />
and presentation slides are released via SGXNET as well<br />
as on the company website at www.sembcorp.com.<br />
Thereafter, a briefing or teleconference by<br />
management is jointly held for the media and<br />
analysts. For first half and full year results<br />
announcements, results briefings are concurrently<br />
broadcast live via webcast.<br />
Following the release of financial statements<br />
or price-sensitive developments, investor relations<br />
officers are available by e-mail or telephone to<br />
answer questions from shareholders, analysts and the<br />
media as long as the information requested does not<br />
conflict with the SGX-ST’s rules of fair disclosure.<br />
Greater shareholder participation at general<br />
meetings (Principle 15)<br />
The company encourages shareholder participation<br />
at general meetings of shareholders. Information on<br />
general meetings is disseminated through notices in<br />
the annual reports or circulars sent to all shareholders.<br />
The notices are also released via SGXNET and published<br />
in local newspapers, as well as posted on the company<br />
website. All registered shareholders are invited to<br />
participate in the company’s general meetings.<br />
The company’s Articles of Association allow all<br />
shareholders the right to appoint up to two proxies<br />
to attend general meetings and vote on their behalf.<br />
The company also allows Central Provident Fund<br />
investors to attend general meetings as observers.<br />
To ensure greater transparency of the voting<br />
process, the company is considering electronic poll<br />
voting at the upcoming general meetings to allow<br />
shareholders present or represented at the meetings<br />
to vote on a one share, one vote basis. Voting in<br />
absentia by mail, facsimile or e-mail is currently not<br />
permitted as such voting methods would need to be<br />
cautiously evaluated for feasibility to ensure that there<br />
is no compromise to the integrity of the information<br />
and the authenticity of the shareholders’ identity.<br />
At general meetings, every matter requiring<br />
approval is proposed as a separate resolution.<br />
Shareholders present are given an opportunity to<br />
clarify or direct questions on issues pertaining to the<br />
proposed resolutions before the resolutions are voted<br />
on. The board and management are present to<br />
address these questions and obtain feedback from<br />
shareholders. The external auditors and legal advisors<br />
(if necessary) are also present to assist the board.<br />
Minutes of shareholder meetings are available upon<br />
request by registered shareholders.<br />
At each AGM, the Group President & CEO delivers<br />
a short presentation to shareholders to update them<br />
on the performance of <strong>Sembcorp</strong>’s businesses.<br />
For further details on <strong>Sembcorp</strong>’s communications<br />
with its shareholders, please see the Investor Relations<br />
chapter of this annual report.<br />
Dealings in Securities<br />
The company has adopted a Code of<br />
Compliance on Dealing in Securities, which prohibits<br />
dealings in the company’s securities by its directors<br />
and senior management within two weeks prior to<br />
the announcement of the company’s financial<br />
statements for each of the first three quarters of its<br />
financial year and within one month prior to the<br />
announcement of the company’s full-year financial<br />
statements. Directors and employees are also<br />
expected to observe insider trading laws at all times,<br />
even when dealing in the company’s securities<br />
outside the prohibited trading period.<br />
Interested Person Transactions<br />
Shareholders have adopted an Interested Person<br />
Transaction (IPT) Mandate in respect of interested<br />
person transactions of the company. The IPT<br />
Mandate defines the levels and procedures to obtain<br />
approval for such transactions. Information<br />
regarding the IPT Mandate is available on the<br />
company website, www.sembcorp.com. All business<br />
units are required to be familiar with the IPT<br />
Mandate and report any interested person<br />
transactions to the company. The Group maintains<br />
a register of the company’s interested person<br />
transactions in accordance with the reporting<br />
requirements stipulated by Chapter 9 of the SGX-ST<br />
Listing Manual. Information on interested person<br />
transactions for <strong>2011</strong> may be found in the related<br />
item under the Supplementary Information section<br />
of the Financial Statements in this report.<br />
78 SEMBCORP INDUSTRIES ANNUAL REPORT <strong>2011</strong> GROWING SUSTAINABLE BUSINESSES 79
RISK MANAGEMENT & MITIGATION STRATEGIES<br />
<strong>Sembcorp</strong> is fully committed to a robust system of internal<br />
controls and risk management.<br />
The Group manages risk under an overall<br />
strategy determined by the board of directors,<br />
supported by the board-level Risk Committee and<br />
Audit Committee. Formed in August 2003 to assist<br />
the board of directors, the Risk Committee, which<br />
now comprises three directors, reviews and enhances<br />
the effectiveness of the Group’s risk management<br />
plans, systems, processes and procedures. The Risk<br />
Committee also reviews Group-wide risk policies,<br />
guidelines and limits as well as significant risk<br />
exposure and their risk treatment plans. Since April<br />
2005, the <strong>Sembcorp</strong> Marine Risk Committee has<br />
assumed responsibility for oversight of the Marine<br />
business’ risk management activities and practices.<br />
Enterprise Risk Management<br />
The Group has established the <strong>Sembcorp</strong><br />
<strong>Industries</strong> Enterprise Risk Management Framework<br />
to standardise the risk management methodologies<br />
within the Group. In line with <strong>Sembcorp</strong>’s<br />
commitment to deliver sustainable value to its<br />
shareholders, the objective of the Enterprise Risk<br />
Management Framework is to provide guidance to<br />
the operating units in implementing a comprehensive<br />
and consistent approach to identifying and managing<br />
the risks that they face. The Enterprise Risk<br />
Management Framework applies to the actions of<br />
all employees of the Group and is implemented in<br />
each operating unit. Within this framework, critical<br />
and major risks of the Group and the operating units<br />
are identified and assessed to determine the<br />
appropriate type of risk management plans to be<br />
implemented and which are to be monitored at the<br />
Group level as well as by each operating unit.<br />
The Enterprise Risk Management Framework sets<br />
out a systematic and ongoing process for identifying,<br />
evaluating, controlling and reporting risk, comprising<br />
the following key elements:<br />
Identification and assessment of all risks<br />
Formulation of risk management strategies<br />
Design and implementation of risk management<br />
and mitigation action plans<br />
Monitoring and reporting of risk management<br />
performance and risk exposure levels; and<br />
Continuous improvement of risk management<br />
and mitigation action plans and capabilities<br />
These processes are put in place to manage and<br />
monitor the Group’s risk management activities on<br />
a regular and timely basis.<br />
System of Financial Discipline<br />
To ensure financial discipline across the Group,<br />
we have implemented a self-check, review and<br />
certification process since 2003 called the System of<br />
Financial Discipline for all subsidiaries, joint ventures<br />
and associates, to confirm their commitment to and<br />
compliance with a prudent financial discipline<br />
framework. The Group conducts periodic review of<br />
the System of Financial Discipline to ensure its<br />
relevance, effectiveness and compliance.<br />
At the business unit level, the process involves a<br />
comprehensive self-review exercise by management<br />
at various levels to ensure that transactions are in<br />
compliance with the accounting standards and<br />
acceptable accounting policies and that the internal<br />
controls in place are adequate. The System of<br />
Financial Discipline also sets out a structured<br />
approach to identifying and facilitating the continued<br />
assessment of key risk areas with financial<br />
implications, such as provisioning for project losses,<br />
asset impairment, significant long outstanding debts,<br />
fraud incidents and any transactions and events with<br />
material impact or potential material impact on the<br />
business unit’s financial results.<br />
On a quarterly basis, business units’ operating<br />
and finance heads are required to certify and report<br />
the results of their self-review exercise to the Group.<br />
This process serves to facilitate and ensure<br />
consistency of accounting treatments adopted by<br />
business units and allows early identification of areas<br />
of potential exposure that can be addressed to<br />
minimise adverse impact to the Group. The reporting<br />
also serves as a periodic platform for all business<br />
units’ operating and finance heads to highlight any<br />
transactions and / or events with material or potential<br />
material financial impact to the Group.<br />
Whistle-blowing<br />
Since 2005, <strong>Sembcorp</strong> has had a whistle-blowing<br />
policy and procedure which provides employees with<br />
well-defined and accessible channels within the<br />
Group through which they may, in confidence, raise<br />
concerns about possible improprieties in matters of<br />
business activities, financial reporting or other<br />
matters to the Audit Committee. This arrangement<br />
facilitates independent investigation of such matters<br />
for appropriate resolution. The policy is subject to<br />
review on a regular basis.<br />
Internal Audit<br />
The Group also has a Group Internal Audit<br />
department, which assists the Audit Committee<br />
to ensure the maintenance of a sound system of<br />
internal controls for the company. Our internal<br />
auditors perform this function by monitoring key<br />
controls and procedures and ensuring their<br />
effectiveness, undertaking investigations as directed<br />
by the Audit Committee and conducting a<br />
programme of internal audits. For more information<br />
on the company’s independent internal audit<br />
function, please refer to the relevant section on<br />
page 77 in the Corporate Governance chapter of<br />
this annual report.<br />
Mitigation Strategies<br />
Our risk management efforts are focused on the<br />
following risks:<br />
a. Financial and counterparty / credit risk<br />
b. Operational risk<br />
c. Investment risk<br />
d. Compliance and legal risk<br />
e. Interested person transaction risk<br />
f. Human resource risk<br />
g. Fraud risk<br />
a. Financial and counterparty / credit risk<br />
The Group’s activities expose it to a variety<br />
of financial risks, including liquidity risk, interest rate<br />
risk, foreign exchange risk, commodity risk and<br />
counterparty / credit risk.<br />
To manage these risks, the Group’s Treasury<br />
Policies and Financial Authority Limits are reviewed<br />
periodically and communicated to the Group’s entities.<br />
The policies set out the parameters for management<br />
of the Group’s liquidity, counterparty, foreign<br />
exchange and other transactions risk exposures.<br />
The Group utilises approved financial instruments<br />
to manage exposure to interest rate, foreign<br />
exchange and commodity price risks arising from<br />
operational, financing and investment activities. The<br />
commodities involved basically include fuel oil, coal<br />
and natural gas. Transactions such as foreign<br />
exchange forwards, interest rate swaps, commodities<br />
swaps, purchase of options and contracts for<br />
differences are used, as appropriate, to manage<br />
these risks. Under the Group’s overall Treasury<br />
Policies, transactions for speculative purposes are<br />
strictly not allowed. Transactions are allowed only for<br />
hedging purposes based on the underlying business<br />
and operating requirements. Exposure to foreign<br />
currency risks is also hedged naturally where possible.<br />
The Financial Authority Limits seek to limit and<br />
mitigate operational risk by setting out the threshold<br />
of approvals required for entering into contractual<br />
obligations and investments.<br />
Liquidity risk<br />
The Group manages its working capital<br />
requirements with a view to balancing the risk of<br />
non-availability of funding, the cost of funding and an<br />
80 SEMBCORP INDUSTRIES ANNUAL REPORT <strong>2011</strong> GROWING SUSTAINABLE BUSINESSES 81
RISK MANAGEMENT & MITIGATION STRATEGIES<br />
optimal level of liquidity appropriate for the operating<br />
environment and expected cash flow of the Group.<br />
Working capital requirements, which are maintained<br />
within the credit facilities established, are adequate<br />
and available to the Group to meet its obligations.<br />
Interest rate risk<br />
The Group’s policy is to maintain an efficient and<br />
optimal interest cost structure using a mix of fixed<br />
and variable rate debts and long-term and short-term<br />
borrowings. The Group enters into interest rate<br />
swaps to minimise its interest rate risk, and targets<br />
to have a minimum of 50% of its loan portfolio in<br />
fixed rate debts.<br />
Foreign exchange risk<br />
The Group operates globally and is exposed to<br />
foreign currency exchange rate movements, primarily<br />
for the US dollar, pound sterling, euro, Australian<br />
dollar and renminbi. Such risks are either hedged by<br />
foreign exchange forward contracts in respect of<br />
actual or forecasted net currency exposure or hedged<br />
naturally by a sale or purchase of a matching asset or<br />
liability of the same currency and amount. The Group<br />
does not engage in any form of proprietary trading.<br />
Commodity risk<br />
The Group hedges against fluctuations in<br />
commodity prices that affect revenue and cost.<br />
Exposure is managed via swaps, purchase of options,<br />
contracts for differences and forward contracts.<br />
Contracts for differences are entered into with<br />
appropriate counterparties to hedge against adverse<br />
price movements on the sale of electricity. Exposure to<br />
price fluctuations arising from the purchase of fuel is<br />
managed via fuel oil swaps, where the price of fuel is<br />
indexed to a benchmark fuel price index, for example<br />
the Singapore High Sulphur Fuel Oil 180-CST.<br />
For precious metal commodities, such as gold,<br />
exposures to fluctuations in price are hedged<br />
through the use of forward contracts or purchase<br />
of options that fix the purchases at an agreed price.<br />
The quantum of commitment is based on actual<br />
or forecasted requirements.<br />
Counterparty / credit risk<br />
The Group monitors its exposure to credit risk<br />
arising from sales to trade customers and default<br />
risks from suppliers and contractors on an ongoing<br />
basis. Credit evaluations are done on these<br />
counterparties from time to time. The Group<br />
generally deals with pre-approved customers,<br />
suppliers, contractors and financial institutions with<br />
good credit rating. On a case by case basis, the<br />
Group will require additional securities when dealing<br />
with counterparties of lower credit standing.<br />
b. Operational risk<br />
Operational risk, which is inherent in all business<br />
activities, is the risk of potential financial loss and /<br />
or business instability arising from failures in internal<br />
controls, operational processes or the systems that<br />
support them.<br />
It is recognised that operational risk can never be<br />
entirely eliminated and that the cost of minimising it<br />
may outweigh the potential benefits. Accordingly, the<br />
Group manages operational risk by focusing on risk<br />
management and incident management. The Group<br />
has also put in place operating manuals, standard<br />
operating procedures, delegation of authority<br />
guidelines and a regular reporting framework, which<br />
encompasses operational and financial reporting.<br />
This allows for early identification of areas of potential<br />
exposure which can be addressed to minimise adverse<br />
impact to the Group. Independent checks on<br />
the operating units’ internal controls and risk<br />
management process are undertaken by the Group<br />
Internal Audit department to ensure their effectiveness<br />
and adequacy. Where appropriate, this is supported<br />
by risk transfer mechanisms such as insurance.<br />
Insurance<br />
It is not practicable to insure every insurable risk<br />
event to the fullest extent as the insurance market<br />
may lack the capacity, both in terms of the breadth<br />
and extent of coverage, and in some cases external<br />
insurance is simply unavailable or not available at an<br />
economical price. The Group regularly reviews both<br />
the type and amount of insurance coverage that it<br />
buys, bearing in mind the availability of such cover,<br />
its price and the likelihood and magnitude of the<br />
risks involved.<br />
During the year, the Group renewed its global<br />
insurance programme for property damage, business<br />
interruption and public liability for its Utilities<br />
operations in Singapore and the UK, under the<br />
advice of established global insurance broker and risk<br />
adviser Marsh (Singapore), and maintained insurance<br />
levels deemed appropriate in view of the cost of<br />
cover and risk profiles of the businesses.<br />
The Group’s wholly-owned captive insurance<br />
subsidiary, <strong>Sembcorp</strong> Captive Insurance, which is<br />
advised and managed by Marsh Management<br />
Services, also participates as a reinsurer in the<br />
property damage and business interruption portion<br />
of the Group’s global insurance programme.<br />
<strong>Sembcorp</strong> Captive Insurance retains a maximum<br />
exposure of S$2.5 million for each and every loss<br />
with an annual maximum of S$5 million in aggregate<br />
in excess of the existing retentions of the business<br />
entities within the Group.<br />
c. Investment risk<br />
The Group’s capital investment decision process<br />
is guided by investment parameters instituted on a<br />
Group-wide basis. All investments are subject to<br />
rigorous scrutiny to ensure that they are in line with<br />
the Group’s strategic business focus, meet the<br />
relevant hurdle rates of return and take into account<br />
all other relevant risk factors, such as market risks,<br />
operating risks, environmental risks and foreign<br />
exchange risks. In addition, the board requires<br />
that each major investment proposal submitted<br />
to the board for decision is accompanied by a<br />
comprehensive risk assessment and management’s<br />
proposed mitigation strategies.<br />
d. Compliance and legal risk<br />
The Group’s operations are subject to regulation<br />
and future changes in regulation that may adversely<br />
affect results, particularly in the areas of corporate<br />
law, competition law, consumer protection and<br />
environmental law. The responsibility of compliance<br />
with applicable laws and regulations lies with the<br />
respective operating business heads, and oversight<br />
of the discharge of their responsibilities is provided<br />
by the Group’s legal department.<br />
Legal risk is the risk that the business activities of<br />
the Group may have unintended or unexpected legal<br />
consequences. This includes risks arising from:<br />
Actual or potential violation of laws or<br />
regulations (which may attract a civil or criminal<br />
fine or penalty)<br />
Inadequate documentation, legal or regulatory<br />
incapacity, insufficient authority of a counterparty<br />
and uncertainty about the validity or enforceability<br />
of a contract in a counterparty insolvency<br />
Failure to protect the Group’s property (including<br />
its interests in its premises and its intellectual<br />
property, such as <strong>Sembcorp</strong>’s logo and other<br />
related logos, brand names and products); and<br />
The possibility of civil claims (including acts<br />
or other events that may lead to litigation or<br />
other disputes)<br />
The Group identifies and manages legal risk<br />
through effective use of its internal and external legal<br />
advisers. <strong>Sembcorp</strong>’s internal legal department assists<br />
in identifying, monitoring and providing the support<br />
necessary to identify and manage legal risks across<br />
the Group.<br />
e. Interested person transaction risk<br />
In respect of transactions entered into by the<br />
Group, its subsidiaries and associated companies that<br />
are “entities at risk” with interested persons (namely<br />
its controlling shareholders, Group President & CEO,<br />
directors and their respective associates), the Group<br />
is guided by and complies with the provisions of<br />
Chapter 9 of the SGX-ST Listing Manual. This is to<br />
82 SEMBCORP INDUSTRIES ANNUAL REPORT <strong>2011</strong> GROWING SUSTAINABLE BUSINESSES 83
RISK MANAGEMENT & MITIGATION STRATEGIES<br />
INVESTOR RELATIONS<br />
ensure that such interested person transactions (IPTs)<br />
are entered into on an arm’s length basis and on<br />
normal commercial terms, which are generally not<br />
any more favourable than those extended to<br />
unrelated third parties.<br />
The Group has internal control procedures to<br />
ensure that transactions carried out with interested<br />
persons comply with the provisions of Chapter 9<br />
and <strong>Sembcorp</strong> <strong>Industries</strong>’ Shareholders’ Mandate.<br />
This mandate is renewed on an annual basis and<br />
will be updated at the extraordinary general meeting<br />
to be convened on April 24, 2012. These internal<br />
control procedures are intended to ensure that IPTs<br />
are conducted at arm’s length and on normal<br />
commercial terms that are not prejudicial to the<br />
interests of minority shareholders.<br />
The Group maintains a register of all IPTs,<br />
recording the basis on which they are entered into,<br />
including quotations obtained to support such basis.<br />
The Group’s annual internal audit plan incorporates<br />
a review of all IPTs for the relevant financial year.<br />
The Audit Committee periodically reviews Group<br />
Internal Audit’s IPT <strong>Report</strong>s to ascertain that the<br />
guidelines and procedures on IPTs have been<br />
complied with. The review includes the examination<br />
of the nature of the IPTs and relevant supporting<br />
documents or other such information deemed<br />
necessary by the Audit Committee. If a member<br />
of the Audit Committee has an interest in an IPT,<br />
he or she abstains from participating in the review<br />
and approval process of that IPT.<br />
f. Human resource risk<br />
In order to develop, support and market the<br />
products and services offered by the Group and to<br />
grow our businesses internationally, it is necessary to<br />
hire and retain skilled and professional employees with<br />
the relevant expertise. The implementation of the<br />
Group’s strategic business plans could be undermined<br />
by failure to recruit or retain competent key personnel,<br />
the unexpected loss of such key senior employees or<br />
failure in the company’s succession planning.<br />
In this respect, the Group places great emphasis<br />
on establishing comprehensive human resource<br />
policies for the recruitment, compensation and<br />
development of staff. This ensures that the Group’s<br />
human assets – its skilled workforce and competent<br />
senior management – are nurtured and retained,<br />
so that the Group’s competitive edge is preserved.<br />
The board’s Executive Resource & Compensation<br />
Committee has oversight of the Group’s remuneration<br />
policies and oversees management, development<br />
and succession plans for key management positions.<br />
Further details on the Executive Resource &<br />
Compensation Committee as well as on <strong>Sembcorp</strong>’s<br />
human resource management may be found at pages<br />
74 to 75 and 103 to 108 of this annual report.<br />
g. Fraud risk<br />
In <strong>2011</strong>, the Group established the Group Fraud<br />
Risk Management Framework to formulate the<br />
Group’s strategies and improve its existing antifraud<br />
measures to manage the risks of fraud and<br />
misconduct effectively. The framework was approved<br />
by the Risk Committee and is in various stages of<br />
implementation within the Group.<br />
At <strong>Sembcorp</strong>, we are committed to ensuring that all capital<br />
market players have easy access to clear, reliable and meaningful<br />
information on our company in order to make informed<br />
investment decisions.<br />
In the context of constantly evolving requirements<br />
of disclosure, transparency and corporate governance,<br />
we aim to provide investors with an accurate,<br />
coherent and balanced account of the Group’s<br />
performance. To do this, multiple communication<br />
platforms are utilised including group briefings to<br />
analysts, investors and the media, one-on-one<br />
meetings with shareholders and potential investors,<br />
investor roadshows and the investor relations section<br />
of our corporate website. In addition, company visits<br />
and facility tours are also organised to help investors<br />
gain better insight into the Group’s operations.<br />
Proactive Communication with the<br />
Financial Community<br />
During the year, senior management and the<br />
investor relations team continued to actively maintain<br />
open communication channels with the financial<br />
community. We held over 130 one-on-one and group<br />
meetings with shareholders, analysts and potential<br />
investors. These included non-deal roadshows in major<br />
international financial centres. In Asia, we covered<br />
Singapore and Hong Kong; in Europe, Frankfurt<br />
and London; and in North America, New York,<br />
Boston and Toronto. We also participated in six<br />
investor conferences during the year. In Singapore,<br />
we participated in the DBS Vickers Pulse of Asia<br />
Conference and OSK-DMG Corporate Day in January,<br />
the Deutsche Bank Access Asia Conference and the<br />
CLSA Corporate Access Forum in May, the Nomura<br />
Asia Equity Forum in June, and the Morgan Stanley<br />
Asia Pacific Summit in November. We also organised<br />
site visits to our Utilities operations on Jurong Island to<br />
help give analysts and investors a better understanding<br />
of our capabilities in energy and water.<br />
During the year, <strong>Sembcorp</strong> <strong>Industries</strong> was<br />
awarded, for the third year running, the Most<br />
Transparent Company under the multi-industry /<br />
conglomerates category at the Securities Investors<br />
Association (Singapore) Investors’ Choice Awards,<br />
in recognition of our commitment to corporate<br />
governance and transparency.<br />
In July, the company ranked eleventh in<br />
Singapore’s Governance and Transparency Index<br />
out of 660 companies listed locally. Jointly launched<br />
by The Business Times and the NUS Business School’s<br />
Centre for Governance, Institutions and Organisations,<br />
the index assesses the transparency of companies’<br />
financial disclosures as well as governance, ethics and<br />
rigour in financial reporting.<br />
<strong>2011</strong> also marked the first year in which<br />
<strong>Sembcorp</strong> was selected as an index component<br />
of the Dow Jones Sustainability Asia Pacific Index.<br />
The index represents the top 20% of the largest 600<br />
companies in the developed Asia Pacific region based<br />
on long-term economic, environmental and social<br />
criteria. <strong>Sembcorp</strong> is one of only four Singaporean<br />
companies in this index.<br />
Total Shareholder Return<br />
<strong>Sembcorp</strong> <strong>Industries</strong>’ share price closed the<br />
year at S$4.05 with a market capitalisation of<br />
S$7.2 billion. The company’s share price averaged<br />
S$4.66 during the year, registering a low of<br />
S$3.32 on October 3, <strong>2011</strong> and a high of S$5.52<br />
on April 25, <strong>2011</strong>. Daily turnover in <strong>2011</strong> averaged<br />
3.6 million shares. In May, we paid out a final tax<br />
exempt one-tier dividend of 17 cents per ordinary<br />
share comprising an ordinary dividend of 15 cents<br />
and a bonus dividend of 2 cents.<br />
84 SEMBCORP INDUSTRIES ANNUAL REPORT <strong>2011</strong> GROWING SUSTAINABLE BUSINESSES 85
INVESTOR RELATIONS<br />
In a market affected by the Eurozone crisis<br />
and weaker than expected growth from both<br />
developing and high-income countries, <strong>Sembcorp</strong><br />
<strong>Industries</strong>’ total shareholder return recorded a<br />
negative 18%, slightly below the Straits Times<br />
Index’s negative 15%.<br />
Shareholder Information<br />
In <strong>2011</strong>, other than our major shareholder<br />
Temasek Holdings, which held 49.6% of our shares<br />
as at the end of <strong>2011</strong>, institutional shareholders<br />
as a group continued to dominate <strong>Sembcorp</strong>’s<br />
shareholder base. Institutional shareholders<br />
Share Ownership by Investor Category<br />
Strategic *<br />
Institutional<br />
Shareholders holding less than 100,000 shares<br />
Retail<br />
Others<br />
7.3%<br />
5.7%<br />
2.1%<br />
accounted for 35.3% of our issued share capital<br />
or 69.8% of free float. Retail shareholders,<br />
shareholders holding less than 100,000 shares,<br />
and others held the remaining 15.1% of issued<br />
share capital or 30.2% of free float. In terms of<br />
geographical breakdown, excluding the stake held<br />
by Temasek Holdings, Singapore shareholders<br />
accounted for 10% of issued share capital. Our<br />
largest geographical shareholding base was North<br />
America with 13% of issued share capital.<br />
Shareholders from Europe and Asia excluding<br />
Singapore accounted for 11% and 5% of issued<br />
share capital respectively.<br />
Share Ownership by Geographical Distribution<br />
Singapore<br />
Asia<br />
North America<br />
Europe<br />
Rest of the world *<br />
11%<br />
11%<br />
Average Monthly <strong>Sembcorp</strong> <strong>Industries</strong> Share Price and Straits Times Index in <strong>2011</strong> (Rebased)<br />
<strong>Sembcorp</strong> <strong>Industries</strong><br />
Straits Times Index<br />
<strong>Sembcorp</strong><br />
<strong>Industries</strong> Straits<br />
Share Price Times<br />
Month (S$) Index<br />
January 5.15 3,230.29<br />
February 4.97 3,091.92<br />
March 5.01 3,036.54<br />
April 5.37 3,162.86<br />
May 5.15 3,138.10<br />
June 4.93 3,077.51<br />
July 5.06 3,134.47<br />
August 4.37 2,879.93<br />
September 3.75 2,761.50<br />
October 3.89 2,713.60<br />
November 4.15 2,763.86<br />
December 4.14 2,691.27<br />
Jan Feb Mar Apr May Jun Jul Aug Sep Oct Nov Dec<br />
Average Monthly Trade Volume of <strong>Sembcorp</strong> <strong>Industries</strong> Shares in <strong>2011</strong> (in thousands)<br />
120<br />
100<br />
80<br />
60<br />
40<br />
20<br />
0<br />
6,000<br />
5,000<br />
35.3%<br />
* Includes indirect interest<br />
As at December 31, <strong>2011</strong><br />
49.6%<br />
13%<br />
5%<br />
* ‘Rest of the world’ also includes shareholders from all geographies who<br />
hold less than 100,000 shares. These shareholders collectively hold 7%<br />
of total shares<br />
As at December 31, <strong>2011</strong><br />
60%<br />
Month Average Volume (‘000)<br />
January 3,097<br />
February 4,032<br />
March 3,725<br />
April 3,778<br />
May 2,454<br />
June 2,123<br />
July 2,824<br />
August 5,452<br />
September 5,829<br />
October 5,023<br />
November 2,978<br />
December 2,353<br />
4,000<br />
3,000<br />
2,000<br />
1,000<br />
0<br />
Jan Feb Mar Apr May Jun Jul Aug Sep Oct Nov Dec<br />
86 SEMBCORP INDUSTRIES ANNUAL REPORT <strong>2011</strong> GROWING SUSTAINABLE BUSINESSES 87
SUSTAINABILITY<br />
Sustainability at <strong>Sembcorp</strong> is about striving for excellence and<br />
continuous improvement in identifying, understanding and<br />
responding to evolving environmental, social and governance<br />
challenges facing our businesses today.<br />
Managing Sustainability<br />
<strong>Sembcorp</strong>’s priority is to deliver long-term value<br />
and sustainable returns to its shareholders. As a<br />
multinational enterprise and a public listed company,<br />
we understand that there is a complex value chain<br />
to which <strong>Sembcorp</strong> belongs and that our wider<br />
responsibility incorporates sustainability issues. We<br />
recognise that these issues may be outside the<br />
traditional view of corporate activity, but as the global<br />
business landscape evolves, managing these issues is<br />
increasingly viewed as vital in maintaining a company’s<br />
‘licence to operate’ by society and our stakeholders.<br />
This widening role of business is taken seriously<br />
and is reflected in <strong>Sembcorp</strong>’s commitment to<br />
excellence and continuous improvement. In late <strong>2011</strong>,<br />
we established a Sustainability Steering Committee<br />
to drive <strong>Sembcorp</strong>’s sustainability performance and<br />
to develop our priorities across the Group. The<br />
Committee will also review our sustainability roadmap<br />
and make strategic recommendations to improve<br />
sustainability performance across the organisation.<br />
The Committee is chaired by the Chief Health, Safety<br />
and Environment Officer and Executive Vice President<br />
of Group Asset Management.<br />
Material risks and opportunities<br />
<strong>Sembcorp</strong>’s management and monitoring of<br />
sustainability issues is based on a risk management<br />
approach. Issues that are material to <strong>Sembcorp</strong> and<br />
our stakeholders are reviewed on an ongoing basis as<br />
the company continues to expand. In late <strong>2011</strong>, a<br />
materiality review was conducted by an independent<br />
consultant to identify the company’s key sustainability<br />
issues. This involved identifying potential issues<br />
and prioritising them based on a Materiality Matrix<br />
approach, which charts their level of importance<br />
to <strong>Sembcorp</strong> and our stakeholders, using clearly<br />
defined materiality criteria. The initial findings of the<br />
review identified key sustainability issues such as<br />
environmental protection and safety. We will be<br />
taking steps to engage our key stakeholders on the<br />
findings of this initial review.<br />
Scope of report<br />
<strong>Sembcorp</strong> is an international company with<br />
customers and operations around the world. In <strong>2011</strong>,<br />
we focused on enhancing our sustainability data<br />
management systems and as a result, we have been<br />
able to broaden the scope of our sustainability<br />
reporting this year. The data in this year’s report<br />
covers all our Utilities business units where <strong>Sembcorp</strong><br />
has either operational control or majority ownership<br />
in Singapore, China, the UAE, UK and Vietnam. We<br />
have also been able to include data from our China<br />
and UK municipal water operations which we<br />
acquired in 2010.<br />
Our Marine business is excluded from this report,<br />
as it is separately listed in Singapore and reports its<br />
activities separately. Our target for our ongoing<br />
reporting is to incorporate data from all businesses<br />
in which <strong>Sembcorp</strong> has a majority stake or<br />
operational control.<br />
Data and activities for key performance indicators<br />
for the included operations have been tracked and<br />
reported in the areas of:<br />
Health, safety and environment<br />
Human resource and employee welfare<br />
Wider community<br />
Where data is unavailable or has been excluded,<br />
this has been clearly stated. All data measurement<br />
is in line with Global <strong>Report</strong>ing Initiative (GRI) G3.1<br />
recommendations for our chosen indicators.<br />
Further information on the company’s corporate<br />
governance, risk management & mitigation strategies<br />
and investor relations, all of which are part of our<br />
wider remit of sustainability, can be found in the<br />
relevant chapters under the Environmental, Social &<br />
Governance Review section of this annual report.<br />
<strong>Sembcorp</strong> has included aspects of sustainability<br />
in our annual report since 2001 and was one of<br />
the first companies listed on the Singapore<br />
Stock Exchange to publish a voluntary sustainability<br />
report using the GRI G3 guidelines. We continue<br />
to use the reporting principles and framework<br />
of GRI and have considered its principles in<br />
terms of materiality, stakeholder inclusiveness,<br />
sustainability context, completeness, accuracy<br />
and comparability. This report is checked against<br />
the GRI G3.1 Framework as Application Level B<br />
and addresses activities and data that fall within<br />
the company’s financial year for the period from<br />
January 1 to December 31, <strong>2011</strong>.<br />
<strong>Sembcorp</strong>’s Sustainability Policy<br />
<strong>Sembcorp</strong>, as a member of the international business community, recognises that our business activities<br />
have varying direct and indirect impacts on the societies in which we operate. We commit to manage these<br />
in a responsible manner, believing that sound and appropriate performance in this area is important for<br />
business success.<br />
For <strong>Sembcorp</strong>, being a responsible corporate citizen is reflected in the following principles:<br />
Standards of business conduct<br />
We ensure that our business is conducted according to rigorous ethical, professional and legal standards,<br />
through maintaining robust corporate governance and an Employee Code of Conduct.<br />
Health, safety and the environment<br />
We place the management of our health, safety and environmental (HSE) responsibilities as our first<br />
priority. We are committed to continuously improving our HSE performance and managing HSE risks<br />
associated with our activities, products and services. We integrate HSE considerations into all aspects of<br />
our business operations and processes with the aim of preventing accidents, injuries, occupational<br />
illnesses and pollution and conserving natural resources.<br />
Employees<br />
We aim to be a fair and caring employer offering our staff equitable opportunities to develop and grow.<br />
Community<br />
We act as a responsible corporate citizen through support for community care initiatives, community<br />
partnerships and philanthropic and charitable causes, in particular those supporting children and youth,<br />
education and the environment.<br />
<strong>Sembcorp</strong>’s operations throughout the world are committed to these principles. The stage and level of<br />
implementation varies according to each operation and the maturity of the business.<br />
88 SEMBCORP INDUSTRIES ANNUAL REPORT <strong>2011</strong> GROWING SUSTAINABLE BUSINESSES 89
SUSTAINABILITY<br />
This report fulfills the requirements<br />
of GRI Application Level B. The<br />
GRI Application Level Check<br />
Statement as well as the index of<br />
GRI G3.1 performance indicators<br />
covered can be found on our<br />
website at www.sembcorp.com.<br />
Sustainable <strong>Sembcorp</strong>:<br />
Our Green Business Lines<br />
In line with our continuous drive for innovation<br />
and to widen our sustainable business portfolio, the<br />
development of sustainable or green business lines<br />
has become a growing part of our ongoing business.<br />
Our sustainable products and services deliver an<br />
additional competitive edge to our customers,<br />
enabling them to achieve their sustainability and<br />
environmental goals. Our sustainable business<br />
operations include the following:<br />
Sustainable and efficient energy solutions<br />
Energy-from-waste, renewable energy<br />
In December <strong>2011</strong>, <strong>Sembcorp</strong> commenced<br />
operations of our woodchip-fuelled biomass steam<br />
production plant on Jurong Island, Singapore. The<br />
plant produces up to 20 tonnes of steam per hour<br />
for customers using waste wood collected from<br />
industrial and commercial waste and processed by<br />
our solid waste collection business. For more details<br />
on the plant, please refer to the write-up<br />
on energy-from-waste solutions on page 90.<br />
Meanwhile, in the UK, the <strong>Sembcorp</strong> Biomass<br />
Power Station in Teesside uses sustainable wood for<br />
fuel. The 35-megawatt combined heat and power<br />
plant is the first large scale wood-fired renewable<br />
energy plant in the country and saves 200,000<br />
tonnes of carbon dioxide emissions a year.<br />
Natural gas<br />
<strong>Sembcorp</strong> is Singapore’s first commercial importer<br />
and retailer of natural gas, considered the cleanest<br />
of all fossil fuels. Since 2001, we have been<br />
importing 341 billion British thermal units of natural<br />
gas per day from West Natuna in Indonesia<br />
and supplying it to major power generators and<br />
petrochemical companies. From the fourth quarter of<br />
<strong>2011</strong>, we started importing an additional 90 billion<br />
British thermal units of gas per day.<br />
Energy efficiency<br />
<strong>Sembcorp</strong> aims to apply technology to achieve<br />
greater efficiency and lower emissions in our power,<br />
steam and desalination operations. A summary of<br />
our use of such technologies may be seen in the<br />
table below.<br />
Energy-from-waste Solutions for a Sustainable Future<br />
As the needs of the world grow, <strong>Sembcorp</strong> recognises that there are tremendous opportunities to<br />
actively invest and grow sustainable businesses. Using our integrated group strength, we apply proven<br />
technologies to produce energy in greener ways, create innovative solutions for clean sustainable water<br />
and help to manage resources through the treatment and recovery of recyclables from waste. Producing<br />
energy from waste is an opportunity as well as a platform for <strong>Sembcorp</strong> to move towards a more<br />
sustainable future.<br />
In December <strong>2011</strong>, we commenced operations of our new woodchip-fuelled biomass steam production<br />
plant on Jurong Island, Singapore. The plant is the first of such energy-from-waste facility in Singapore to<br />
produce process steam for third-party commercial customers on Jurong Island. The facility is capable of<br />
taking up to 150 tonnes of waste wood per day to produce 20 tonnes per hour of steam with only a very<br />
small amount of ash (2%) generated during the woodchip combustion process. Stack emissions data is<br />
continually provided to the National Environment Agency through a direct communication link to monitor<br />
and ensure that the plant complies with the national emissions guidelines.<br />
<strong>Sembcorp</strong> also leverages our expertise in solid waste management to manage the entire energy-fromwaste<br />
process. Our solid waste management arm in Singapore collects and recovers recyclables from<br />
industrial and commercial waste from over 3,000 customers that are otherwise sent for incineration and<br />
disposed of in landfills. Our integrated construction and demolition materials recovery facility in Lim Chu<br />
Kang, Singapore, is capable of processing 300,000 tonnes of construction and demolition waste per year,<br />
recovering timber hardcore and fines during the sorting process. The recovered wood waste from the above<br />
two sources are then processed efficiently into woodchip to fuel the biomass steam production plant. The<br />
biomass plant, designed to the Building and Construction Authority’s Green Mark Gold standard,<br />
incorporates natural ventilation and lighting, solar power and recycled building materials, and is also highly<br />
automated to ensure safety and efficiency.<br />
<strong>Sembcorp</strong>’s technologies for more efficient power,<br />
steam and desalination operations<br />
Combined cycle gas turbine technology (CCGT) – Refers to<br />
the production of electricity using a gas turbine where waste heat<br />
from the gas turbine exhaust is used to produce steam to generate<br />
additional electricity via a steam turbine. This technology allows<br />
<strong>Sembcorp</strong>’s plant to operate more efficiently per unit of fuel input.<br />
Cogeneration – In addition to the CCGT process, steam is<br />
further recovered from the steam turbine to meet customers’<br />
demand, making the entire combined production of electricity<br />
and steam more fuel efficient and further reducing carbon<br />
dioxide emissions.<br />
Combined power and desalination – Refers to the production<br />
of electricity and water where heat which might otherwise have<br />
been lost in the form of flue gas, is recovered to produce steam from<br />
the heat recovery steam generator to generate power and for use<br />
in seawater desalination, allowing for greater efficiency.<br />
Where <strong>Sembcorp</strong><br />
has applied it<br />
Singapore, China, UK, Vietnam,<br />
UAE and Oman<br />
Singapore, China and UK<br />
UAE and Oman<br />
90 SEMBCORP INDUSTRIES ANNUAL REPORT <strong>2011</strong> GROWING SUSTAINABLE BUSINESSES 91
SUSTAINABILITY<br />
Supercritical technology<br />
In May 2010, <strong>Sembcorp</strong> announced a joint<br />
venture agreement with Gayatri Energy Ventures<br />
to build, own and operate a 1,320-megawatt<br />
coal-fired power plant in Andhra Pradesh, India.<br />
While the plant will be fired by coal, it will utilise<br />
supercritical technology which reduces emissions<br />
of carbon dioxide and other pollutants by consuming<br />
less fuel per unit of electricity generated, reducing<br />
its associated environmental impacts. <strong>Sembcorp</strong><br />
expects the power plant to be substantially fuelled<br />
by low sulphur non-coking coal.<br />
Sustainable water solutions<br />
<strong>Sembcorp</strong>’s water business is actively playing<br />
a part in providing sustainable water solutions<br />
to meet the growing needs of industries and<br />
communities and support ongoing development<br />
in emerging economies. We supply water to over<br />
five million people worldwide through our municipal<br />
water operations and also support the specialised<br />
water needs of industrial companies while reducing<br />
their impact on the environment.<br />
Wastewater treatment and reclamation<br />
<strong>Sembcorp</strong> owns and operates facilities capable<br />
of treating high organic concentration and high<br />
salinity industrial wastewater. Our industrial<br />
wastewater treatment facilities in China and<br />
Singapore are capable of treating wastewater up<br />
to 20 times more concentrated than municipal<br />
sewage and up to 1.5 times more saline than<br />
seawater. By treating our industrial customers’<br />
wastewater to meet discharge standards, we help<br />
industries limit their impact on the environment.<br />
In Singapore, our largest industrial wastewater<br />
treatment plant on Jurong Island is expected to<br />
commence operations in the second half of 2012.<br />
The 9,600 cubic metres per day plant is capable<br />
of treating multiple streams of complex industrial<br />
wastewater and will more than double our current<br />
capacity on the island.<br />
We were the first company in China to be<br />
allowed to treat highly concentrated industrial<br />
wastewater directly from source without requiring<br />
our customers to invest in pre-treatment facilities.<br />
Chinese government regulations require industrial<br />
companies to pre-treat their wastewater to the<br />
standard of municipal sewage before discharging<br />
the wastewater to a standard sewage treatment<br />
plant. The decision to permit industrial companies<br />
to discharge effluent directly to our wastewater<br />
treatment facility signifies a new milestone for<br />
advanced wastewater management in China.<br />
Beyond treating wastewater, <strong>Sembcorp</strong> also<br />
reclaims water from treated effluent. This integrated<br />
closed loop approach minimises liquid discharge,<br />
conserves precious water resources and offers a<br />
sustainably-sourced alternative water supply to<br />
industries and households. In Singapore, we are<br />
a pioneer in reclaiming industrial effluent on Jurong<br />
Island. In China, we opened our first industrial water<br />
reclamation plant in the Zhangjiagang Free Trade Port<br />
Zone which is capable of reclaiming industrial water<br />
from treated effluent for reuse by industries. Our<br />
industrial wastewater treatment and water reclamation<br />
facilities in the area have been selected by the<br />
governments of Singapore and China as Governmentto-Government<br />
showcases for bilateral cooperation in<br />
water management, and won prestigious Honour<br />
Awards at both the East Asian and Global International<br />
Water Association Project Innovation Awards in 2010.<br />
Our NEWater plant in Singapore, capable of<br />
producing 228,000 cubic metres per day of water, is one<br />
of the largest water reclamation plants in the world and<br />
plays a significant part in Singapore’s water sustainability<br />
journey. It won the Water Reuse Project of the Year at<br />
the Global Water Awards 2010, which recognises the<br />
water reuse project that represents the most significant<br />
achievement for the industry internationally.<br />
Desalination<br />
We provide sustainable water supply through<br />
desalination to meet growing water demand. Our<br />
US$1.7 billion plant in Fujairah, UAE and our<br />
upcoming US$1 billion plant in Salalah, Oman,<br />
have a water capacity of 100 million and 15 million<br />
imperial gallons per day of desalinated water<br />
respectively. Both integrated power and desalination<br />
plants use various desalination technologies such<br />
as multi-stage flash and reverse osmosis.<br />
Waste-to-resource<br />
Through <strong>Sembcorp</strong>’s range of services, waste<br />
that would usually be disposed of in landfills<br />
and incineration facilities is diverted for recycling.<br />
Within the <strong>Sembcorp</strong> Group, we have capabilities<br />
in advanced waste treatment and resource recovery,<br />
including composting and waste-to-resource. Our<br />
waste-to-resource facilities in Singapore extract<br />
recyclables from waste collected through our waste<br />
collection arm, which is the leading operator in<br />
Singapore serving five out of the nation’s nine<br />
municipal sectors. <strong>Sembcorp</strong> also operates a<br />
construction and demolition materials recovery<br />
facility in Singapore recovering timber, hardcore<br />
and fines, as well as ferrous and non-ferrous metals.<br />
Waste wood collected is processed and used to fuel<br />
our new woodchip-fuelled biomass steam production<br />
plant to produce steam for our customers.<br />
Furthermore, a comprehensive range of waste paper<br />
recycling services is offered from collection, sorting<br />
and baling to bulk supply of recovered paper to<br />
paper manufacturers.<br />
Sustainable integrated urban development<br />
<strong>Sembcorp</strong> develops self-sufficient integrated<br />
urban developments comprising industrial parks as<br />
well as business, commercial and residential space.<br />
The business’ integrated approach to delivering<br />
urban work and living environments attracts local<br />
and international investments which facilitate<br />
development, promotes a conducive business<br />
environment and creates jobs for locals.<br />
<strong>Sembcorp</strong> manages integrated urban<br />
developments with a total gross project size of<br />
7,687 hectares. The integrated developments are<br />
master planned with proper zoning of industrial,<br />
commercial and residential areas, and have strict<br />
effluent discharge guidelines to prevent toxic<br />
discharge into the environment. In addition, on-site<br />
sewage treatment plants treat the effluent before<br />
discharge. Where possible, conservation of the<br />
natural environment and preservation of greenery are<br />
incorporated into the master plans.<br />
Our fourth Vietnam Singapore Industrial Park<br />
development in Hai Phong, Vietnam, incorporates<br />
conservation considerations into its master plan,<br />
with 30% of the land within the development<br />
reserved for green space and preservation of local<br />
flora and fauna. Existing wetlands on the site as well<br />
as tributaries from the Cam River running through<br />
the property will be preserved and made a feature<br />
of the development, while two large retention<br />
ponds will be created to aid water flow during the<br />
monsoon season. These ponds integrate with the<br />
community’s leisure space, while providing a source<br />
of water for landscaping.<br />
Our joint venture project in China, Sino-<br />
Singapore Nanjing Eco Hi-tech Island, is envisioned<br />
as a world-class integrated urban development<br />
on a green island which will have more than<br />
50% of its area preserved for eco-tourism. It will<br />
also feature an exhibition centre and a research<br />
and development park with green roofs to alleviate<br />
urban heat effect as well as rain collection canopies.<br />
Wetland biofilters and park connectors are also<br />
incorporated into the integrated development’s<br />
overall design plan.<br />
In <strong>2011</strong>, we added a new development to our<br />
portfolio, the 1,000-hectare Singapore-Sichuan<br />
Hi-tech Innovation Park in China. With the promotion<br />
of research and development, high-tech upgrading<br />
and environmental protection among the central<br />
government’s twelfth “Five Year Plan” objectives,<br />
the park will focus on technology-driven, knowledgeintensive<br />
industries and showcase a modern,<br />
innovative and low carbon emission city.<br />
92 SEMBCORP INDUSTRIES ANNUAL REPORT <strong>2011</strong> GROWING SUSTAINABLE BUSINESSES 93
SUSTAINABILITY<br />
Research and Development<br />
Research and development plays an important role in strengthening <strong>Sembcorp</strong>’s sustainable capabilities.<br />
As a business, our continuous drive for technology and innovation allows us to optimise existing facilities<br />
and processes and use energy more efficiently. This means better use of resources, lower costs, better safety<br />
performance and reduced environmental impact.<br />
<strong>Sembcorp</strong>’s operations are supported by our in-house Technology department and our Group Technology<br />
Committee which is headed by <strong>Sembcorp</strong>’s Chairman. Members of the Committee include external academics<br />
and industry experts such as Tan Gee Paw, Chairman, Public Utilities Board, Dr Josephine Kwa, ex-CEO, NSL<br />
and Dr Ng How Yong, Associate Professor, Faculty of Engineering, National University of Singapore.<br />
The Committee meets three to four times a year to oversee the direction of <strong>Sembcorp</strong>’s research and<br />
technology programmes, providing vision and strategy to meet <strong>Sembcorp</strong>’s growth. The Committee reviews<br />
emerging technologies and trends in the industry, and facilitates research and development linkages with<br />
academic and research institutions, technology suppliers and end users. An example of such a partnership<br />
is our ongoing collaboration with Nanyang Technological University’s Nanyang Environment and Water<br />
Research Institute to jointly develop a computerised tool to optimise plant operation. This ‘Virtual Brain’<br />
technology will be capable of identifying process deviations which will alert our operators to initiate<br />
changes to the process, saving time and cost.<br />
<strong>Sembcorp</strong> is also working closely with one of our customers in Singapore to run a pilot plant test using<br />
Oxidation Flocculation Reactor technology, a technology patented by Sun Yat Sen University, China. This<br />
innovative solution significantly reduces the treatment cost of industrial wastewater containing recalcitrant<br />
organic substance.<br />
In <strong>2011</strong>, <strong>Sembcorp</strong> secured a research grant from the Energy Market Authority to explore an innovative<br />
energy-from-waste technology. The technology developed will help convert organic waste into biogas.<br />
Pulling together these extensive intellectual resources, our continuous push for technology and<br />
innovation helps to build our competitive advantage and support the sustainable growth of the Group.<br />
Stakeholder Engagement<br />
<strong>Sembcorp</strong> recognises that its business operations<br />
are intertwined with various stakeholders. In early<br />
2012 we conducted a stakeholder engagement<br />
planning exercise in line with AA1000 Stakeholder<br />
Engagement Standard with the help of an<br />
independent consultant to review and identify<br />
our key stakeholder groups.<br />
<strong>Sembcorp</strong>’s key sustainability stakeholder<br />
groups have been identified as shareholders,<br />
financial institutions, the investment community,<br />
government, regulators, customers, employees and<br />
members of communities where we have operations.<br />
Our internal stakeholders are crucial in our<br />
day-to-day practice of sustainability and in<br />
determining our sustainability-related risks and<br />
identifying areas for future improvement. As part<br />
of our efforts to create a culture of open two-way<br />
communication, employees are encouraged to<br />
contribute ideas on improving workplace<br />
practices and the delivery of products and<br />
services. This includes feedback on issues such<br />
as dishonesty and fraud via our whistle-blowing<br />
scheme and confidential feedback channels. To<br />
further promote sustainability as a part of<br />
<strong>Sembcorp</strong>’s corporate culture, employee appraisals<br />
take into account HSE performance as appropriate.<br />
Further information on employee engagement<br />
can be found in the Human Resource section<br />
on page 105.<br />
<strong>Sembcorp</strong> maintains open communication<br />
channels with the investment community including<br />
shareholders, analysts and potential investors. We<br />
actively engage our stakeholders through various<br />
platforms such as one-to-one meetings, group<br />
meetings, presentations and site visits. In <strong>2011</strong>,<br />
we had over 130 meetings with the investment<br />
community. Further information on such<br />
communication can be found in the Corporate<br />
Governance and Investor Relations chapters on<br />
pages 68 and 85 respectively.<br />
We engage in regular dialogues with the<br />
government, regulator and community through<br />
different platforms such as meetings, briefings and<br />
presentations. For example, our solid waste<br />
management operations in Singapore hold monthly<br />
meetings with the respective town councils of every<br />
municipality that we serve.<br />
We proactively engage with customers to find<br />
out how we can improve our services. In the UK,<br />
focus groups and internal surveys are conducted<br />
annually to find out how our municipal water<br />
operations can enhance or improve our service<br />
offering. These also help identify key drivers of<br />
satisfaction, so we know where to focus our efforts<br />
and investment. All feedback is used to make<br />
improvements either via training of advisors,<br />
enhancements to existing processes or the<br />
development of new service enhancements. Our<br />
operation in Bournemouth, UK, is currently<br />
developing a framework to form a customer<br />
engagement panel for the next review of prices by<br />
the regulator. In Singapore, our Utilities operations<br />
conduct a bi-annual survey with its gas, power and<br />
utilities customers. The online survey is sent to all<br />
customers, and in 2010, the overall customer<br />
satisfaction rate was 95%. Aside from the survey,<br />
customers have access to an online portal to retrieve<br />
their consumption information, and they can provide<br />
further feedback via email or a hotline telephone<br />
number. Our solid waste management operations<br />
also conduct an annual online survey with its<br />
customers, and provide a hotline number as well as<br />
an email address for further feedback.<br />
Through these and other formal engagement<br />
programmes, we aim to continue to align relevant<br />
stakeholder issues with our overall strategy.<br />
Supply Chain<br />
<strong>Sembcorp</strong> has a complex supply chain and our<br />
actions influence many businesses along the value<br />
chains we operate in. Many clients are in the process<br />
of developing their own sustainability programmes. As<br />
a provider of essential solutions, we aim to assist our<br />
customers to improve their HSE performance, limit<br />
their environmental impact and conserve resources.<br />
Contractors<br />
As a provider of utilities, <strong>Sembcorp</strong> directly<br />
consumes primary resources, produces waste and<br />
emissions and manages people, buildings, treatment<br />
processes and machinery. As such, we work closely<br />
with our suppliers, business partners and contractors<br />
to ensure adherence to our Group HSE guidelines.<br />
All suppliers are subject to a vendor pre-qualification<br />
review that includes checks on its HSE provisions. We<br />
ensure that the appointment of all vendors and<br />
contractors comply with the applicable government<br />
certification requirements as well as our guidelines<br />
and policies. Platforms such as safety induction<br />
programmes and contractor HSE engagement help<br />
to actively identify gaps and improve performance.<br />
In Singapore, where over 70% of <strong>Sembcorp</strong>’s<br />
contract workers are employed, we require<br />
contractors to comply with all requirements stated<br />
in a Permit to Work application, issued by the<br />
Ministry of Manpower, before they can work in our<br />
facilities or operating sites. This includes requirements<br />
for health and safety provisions and the submission<br />
of proper paperwork to demonstrate the presence<br />
of adequate workers’ compensation insurance<br />
coverage, as well as relevant resident visa and work<br />
permits. Employees of our contractors must also<br />
attend HSE training before any work is started.<br />
94 SEMBCORP INDUSTRIES ANNUAL REPORT <strong>2011</strong> GROWING SUSTAINABLE BUSINESSES 95
SUSTAINABILITY<br />
External Initiatives and Memberships<br />
At <strong>Sembcorp</strong>, we recognise the importance<br />
of being an active player within our industry and<br />
engaging with our peers and the wider business<br />
community on sustainability issues. <strong>Sembcorp</strong> is a<br />
founding member and supporter of the Singapore<br />
Compact for Corporate Social Responsibility,<br />
a national society promoting sustainability issues<br />
in Singapore.<br />
Our Group President & CEO also serves as a<br />
member of Singapore’s Climate Change Network,<br />
a forum started by Singapore’s National Climate<br />
Change Secretariat. The network serves as a<br />
platform for representatives from various sectors<br />
to nurture dialogue on climate change matters and<br />
to exchange information on climate change issues.<br />
At the industry level, <strong>Sembcorp</strong> participates in<br />
the Responsible Care voluntary initiative, endorsed<br />
by the Singapore Chemical Industry Council (SCIC).<br />
This encourages members to adopt 10 guiding<br />
principles for a safer chemical industry through<br />
the six management practices of employee health<br />
and safety, distribution, pollution prevention,<br />
process safety, product stewardship and community<br />
awareness, and emergency response. Our Utilities<br />
business in Singapore has actively participated in a<br />
number of industry workgroups organised by the<br />
SCIC looking at issues such as capacity building on<br />
process safety and drafting new quantitative risk<br />
assessment guidelines.<br />
In Singapore, <strong>Sembcorp</strong> is also a member of<br />
the Sakra Island Community Awareness Group,<br />
which seeks to promote community awareness<br />
and a standardised management practice code for<br />
emergency responses among companies located<br />
in the Sakra district on Jurong Island. Similarly,<br />
our Teesside, UK operations are active in the North<br />
East of England Process Industry Cluster which serves<br />
as a unified voice for the process industry in<br />
Northeast England, where a substantial part of the<br />
UK’s chemical, petrochemical, speciality chemical,<br />
pharmaceutical, polymer and biotechnology<br />
industries are based. In the UAE, our operations in<br />
Fujairah are part of the Abu Dhabi Water & Electricity<br />
Authority’s task force in formulating HSE procedures<br />
and guidelines for the energy sector.<br />
External Recognition and Awards<br />
In <strong>2011</strong>, <strong>Sembcorp</strong> received both national and<br />
global recognition and a number of awards for its<br />
efforts to promote and practise sustainability.<br />
Dow Jones Sustainability Asia Pacific Index<br />
<strong>Sembcorp</strong> has been selected as an index<br />
component of the Dow Jones Sustainability Asia<br />
Pacific Index for <strong>2011</strong>. The index represents the top<br />
20% of the largest 600 companies in the Asia Pacific<br />
developed region based on long-term economic,<br />
environmental and social criteria. <strong>Sembcorp</strong> is<br />
honoured to be one of only four Singapore<br />
companies selected for the index.<br />
Singapore Corporate Awards<br />
<strong>Sembcorp</strong> clinched the coveted Gold award<br />
for Best <strong>Annual</strong> <strong>Report</strong> (for companies with<br />
S$1 billion and above in market capitalisation) at<br />
the Singapore Corporate Awards <strong>2011</strong> for our<br />
<strong>Annual</strong> <strong>Report</strong> 2010, in recognition of our excellence<br />
in reporting and disclosure. The prestigious awards<br />
showcase excellence in corporate governance and<br />
shareholder communication, and the Best <strong>Annual</strong><br />
<strong>Report</strong> award was introduced to encourage social<br />
responsibility reporting as well as increase the<br />
awareness of the organisations’ responsibility to<br />
the community.<br />
Frost & Sullivan Asia Pacific Awards<br />
<strong>Sembcorp</strong> won the Frost & Sullivan Asia Pacific<br />
Waste Recycling Company of the Year award in<br />
<strong>2011</strong>, in recognition of our excellence in solid<br />
waste recycling, waste treatment support and<br />
applying environmentally-friendly waste recycling<br />
technologies in our businesses. The award also<br />
recognises the company’s position as a major<br />
industry player providing waste recycling services<br />
across customer verticals, and our ability to<br />
successfully respond to our customers’ needs<br />
with a business strategy that incorporates best<br />
sustainable practices.<br />
Securities Investors Association (Singapore)<br />
Investors’ Choice Awards<br />
<strong>Sembcorp</strong> was named the Most Transparent<br />
Company (multi-industry / conglomerates category)<br />
at the Securities Investors Association (Singapore)<br />
Investors’ Choice Awards <strong>2011</strong> for the third year<br />
running. This recognises our continuous drive<br />
towards transparency and good governance,<br />
and our efforts to give stakeholders an accurate,<br />
coherent and balanced account of our company<br />
and performance.<br />
Singapore Sustainability Awards<br />
<strong>Sembcorp</strong> was conferred top honours at the<br />
Singapore Sustainability Awards <strong>2011</strong>, winning the<br />
Sustainable Business Award (Enterprise category).<br />
The awards, presented by the Singapore Business<br />
Federation, recognise local enterprises with<br />
outstanding sustainable business practices.<br />
Companies are assessed on their innovation,<br />
corporate social responsibility, commercial potential<br />
and sustainable business growth, as well as their<br />
environmental, health and safety and production<br />
process management systems.<br />
Responsible Care Awards<br />
<strong>Sembcorp</strong> was honoured by the SCIC with gold<br />
awards in the categories of Community Awareness<br />
and Emergency Response and Pollution Prevention,<br />
and three achievement awards in Distribution,<br />
Employee Health and Safety and Process Safety at<br />
the Responsible Care Awards <strong>2011</strong>. The awards<br />
honour companies who have incorporated<br />
Responsible Care management practices into their<br />
operations and recognise those with exemplary<br />
performance in maintaining high HSE standards.<br />
South African Blue and Green Drop Status<br />
In recognition of our continuing efforts<br />
to provide water and sanitation services of the<br />
highest quality, both <strong>Sembcorp</strong>’s South African<br />
operations were awarded the prestigious Blue<br />
Drop and Green Drop status in <strong>2011</strong> by the<br />
Department of Water and Environmental Affairs.<br />
Only 7.2% of all water systems in South Africa<br />
were awarded the Blue Drop (drinking water quality<br />
management) status in <strong>2011</strong>, while the Green Drop<br />
(wastewater quality management) status was<br />
achieved by only 4.7% of South Africa’s wastewater<br />
systems. In addition, one of our operations was<br />
conferred the Platinum status for achieving the<br />
Blue Drop status for three consecutive years, making<br />
it among just 10 operations in the country to be<br />
awarded Platinum.<br />
Health, Safety and Environment<br />
Managing our material issues<br />
HSE issues are clearly linked to <strong>Sembcorp</strong>’s<br />
long-term success and have been identified as<br />
material factors in terms of their potential impact on<br />
our business operations. In managing our HSE issues,<br />
we continue to be guided by four main principles:<br />
Implementing internationally recognised HSE<br />
management systems such as ISO 14001:2004<br />
and OHSAS 18001:2007<br />
Actively investing in financially viable<br />
sustainable business lines, which form part of<br />
our core operations<br />
Using continuous improvement to enhance<br />
HSE performance of our processes, products<br />
and services<br />
Working closely with our business partners and<br />
seeking active engagement to promote mutual<br />
HSE performance improvement<br />
<strong>Sembcorp</strong>’s operations are in various phases of<br />
development. They include facilities that are under<br />
construction, newly commissioned as well as recently<br />
acquired. As such, our priority continues to be on<br />
aligning and improving standards across the Group<br />
96 SEMBCORP INDUSTRIES ANNUAL REPORT <strong>2011</strong> GROWING SUSTAINABLE BUSINESSES 97
SUSTAINABILITY<br />
and proactively managing HSE performance<br />
throughout the asset management life cycle,<br />
from business development and project conception,<br />
to operation and the end of the asset life.<br />
Management of HSE efforts within <strong>Sembcorp</strong><br />
and HSE progress<br />
With operations that spread across six continents,<br />
our Group HSE department is the driver of our<br />
management systems and coordinates our global<br />
HSE efforts. Management committees and reporting<br />
structures have been established with regional<br />
coordinators working closely with the department.<br />
This ensures the effective management of HSE issues<br />
with the purpose of setting long-term HSE objectives<br />
and targets and complying with regulatory<br />
requirements, voluntary group guidelines, standards<br />
and initiatives. <strong>Report</strong>ing to the Board Risk<br />
Committee (BRC) was formalised in <strong>2011</strong>, and HSE<br />
issues have been incorporated into regular reports<br />
to the board with key HSE risks and controls also<br />
presented to the BRC.<br />
The key goal for the Group HSE department in<br />
<strong>2011</strong> was to strengthen overall <strong>Sembcorp</strong> Group HSE<br />
culture, create more HSE awareness and shape the<br />
development of the HSE management framework<br />
across the Group. The framework outlines the roles<br />
and responsibilities of various relevant departments<br />
and business units, in line with the Group HSE policy.<br />
The Group HSE policy can be viewed on our website<br />
at www.sembcorp.com.<br />
The framework was endorsed by the BRC and<br />
implemented across all Utilities businesses in the<br />
Group. Periodic HSE assurance audits help to ensure<br />
that HSE matters are managed professionally in order<br />
to meet legal compliance and ensure continuous<br />
improvement in all our activities.<br />
HSE reporting to management<br />
In an effort to standardise HSE guidelines and<br />
reporting, Group HSE has reviewed and developed<br />
a standardised set of reporting parameters to track<br />
and monitor key HSE statistics across the Group.<br />
The new parameters and template are based on<br />
the <strong>Sembcorp</strong> 4/0 targets. The 4/0 targets refer to:<br />
zero harm to people, zero damage to the<br />
environment, zero damage to assets and zero<br />
non-compliance to legal and regulatory requirements.<br />
Along with the Group HSE guidelines, the 4/0 targets<br />
and reporting parameters were approved by the<br />
BRC in February <strong>2011</strong>.<br />
It is compulsory for all business units under the<br />
operational control of the <strong>Sembcorp</strong> Group to follow<br />
these guidelines.<br />
HSE workshops and training<br />
A Group HSE workshop is conducted annually<br />
where employees from our operations around the<br />
world will meet and contribute ideas towards the<br />
formulation of key HSE initiatives as well as a set of<br />
global mandatory HSE guidelines for all business<br />
units under our operational control.<br />
In addition, in <strong>2011</strong>, Group HSE also conducted<br />
an inaugural HSE workshop for <strong>Sembcorp</strong>’s China<br />
operations, with the objective of promoting HSE<br />
awareness and best practice. This resulted in the<br />
establishment of a China HSE Committee comprising<br />
representatives from each site, providing a platform<br />
for HSE colleagues in China to communicate,<br />
share best practices and support improvements in<br />
HSE. Moving forward, Group HSE and Group<br />
Asset Management will support the coordination<br />
of a regular asset management and HSE workshop<br />
to support China’s operations and its HSE<br />
performance improvement.<br />
HSE audits<br />
Group HSE conducts regular HSE audits for<br />
the operations to achieve continuous improvement.<br />
In <strong>2011</strong>, we covered our operations in Fujairah,<br />
UAE, and three facilities in China. The audits were<br />
conducted in accordance with Group HSE guidelines,<br />
to help identify and bridge gaps so that these<br />
business units can improve on their HSE<br />
performance. Our water operations in China have<br />
also embarked on automating their reporting<br />
of HSE and operational statistics through<br />
collaboration with the Group HSE and Group<br />
Performance Management departments.<br />
<strong>Sembcorp</strong>’s two greenfield projects in India<br />
and Oman are in the construction and commissioning<br />
phases respectively. Group HSE works closely<br />
with their counterparts at the new plants to share<br />
and communicate Group HSE guidelines and<br />
requirements. The team visited the plant in Oman<br />
for a two-day HSE review in November <strong>2011</strong>, and<br />
established an understanding of the plant’s HSE<br />
management system framework and existing HSE<br />
practices. Potential areas for improvement were<br />
identified and recommendations were made for<br />
establishing HSE procedures and processes.<br />
Certifications Achieved by <strong>Sembcorp</strong>’s Businesses<br />
HSE management certifications<br />
We continue to work towards implementing<br />
internationally recognised HSE management systems<br />
across our operations.<br />
In early 2012, <strong>Sembcorp</strong> Gulf O&M Company in<br />
the UAE underwent a certification audit for both ISO<br />
14001 and OHSAS 18001 and was awarded both<br />
certifications with zero non-conformities. Following<br />
these certifications, we will be working towards the<br />
additional requirement of attaining the Abu Dhabi<br />
Environment, Health and Safety Management System<br />
qualification, for which assessments will conclude by<br />
end 2012.<br />
Meanwhile, <strong>Sembcorp</strong> Utilities Singapore<br />
obtained the integrated OHSAS 18001 and ISO<br />
14001 Environmental Management System in<br />
March <strong>2011</strong>.<br />
Unit ISO 9001 ISO 14001 OHSAS 18001<br />
<strong>Sembcorp</strong> Utilities (Singapore) √ √ √<br />
<strong>Sembcorp</strong> Gas √ √ √<br />
<strong>Sembcorp</strong> Environment √ √ √<br />
<strong>Sembcorp</strong> Bournemouth Water √ √ √<br />
Zhangijagang Free Trade Zone <strong>Sembcorp</strong> Water<br />
√<br />
Fuzhou <strong>Sembcorp</strong> Water √ √ √<br />
Qitaihe <strong>Sembcorp</strong> Water<br />
√<br />
<strong>Sembcorp</strong> Xinmin Water<br />
√<br />
<strong>Sembcorp</strong> Sanhe Yanjiao √ √ √<br />
Subic Water and Sewerage √ √ √<br />
<strong>Sembcorp</strong> Silulumanzi √ √<br />
<strong>Sembcorp</strong> Siza Water<br />
√<br />
<strong>Sembcorp</strong> Gulf O&M Company √ √<br />
98 SEMBCORP INDUSTRIES ANNUAL REPORT <strong>2011</strong> GROWING SUSTAINABLE BUSINESSES 99
SUSTAINABILITY<br />
Environmental management<br />
As a key player in the energy and water sector,<br />
we are keenly aware of global climate change issues.<br />
We aim to limit and manage the impact of our<br />
operations on the environment by enhancing our<br />
efficiency and investing in assets which apply<br />
technologies to manage and reduce emissions. For<br />
example, our new woodchip-fuelled biomass steam<br />
production plant in Singapore produces process<br />
steam for third-party commercial customers. The<br />
plant was designed to the Building and Construction<br />
Authority’s Green Mark Gold standard, and<br />
incorporates natural ventilation and lighting, solar<br />
power and recycled building materials.<br />
Environmental studies including environmental<br />
impact assessments are a part of Group HSE’s<br />
requirements for new major projects and expansions.<br />
Environmental impact assessments are carried out in<br />
accordance with national and / or international<br />
standards and methodologies. All recommendations<br />
put forth from the assessments form part of our<br />
management of HSE risks and are incorporated in the<br />
planning, design, construction and commissioning of<br />
the new plants. Other environmental assessments<br />
such as environmental baseline studies and pollution<br />
control studies are conducted as required in the<br />
relevant countries.<br />
Energy and carbon<br />
In <strong>2011</strong>, we have included data on our<br />
environmental management from our operations<br />
in Singapore, China, the UAE, UK and Vietnam. We<br />
continued to track our primary energy sources usage.<br />
Natural gas still accounts for the largest proportion<br />
of our fuels used. We also monitored indirect energy<br />
usage in the form of electricity consumption by our<br />
operations within the scope of the report.<br />
We are proactive in seeking to reduce our energy<br />
consumption and corresponding greenhouse gas<br />
emissions through investing in energy efficient<br />
and renewable energy technologies. In Singapore,<br />
our energy-from-waste technology, which converts<br />
Utilities’ Energy Sources Consumption<br />
Fuel Type (in gigajoules)<br />
Primary energy sources<br />
Natural Gas 109,327,532<br />
Fuel Oil 435,894<br />
Diesel 3,974,042<br />
Coal 4,475,256<br />
Biomass 2,924,763<br />
Total Primary Energy<br />
Source Consumption 121,137,488<br />
Indirect Energy Consumption<br />
Electricity<br />
703,016 MWH<br />
Steam<br />
933,340 tonnes<br />
Data covers Utilities operations in Singapore, China, the UAE, UK and Vietnam<br />
MWH: Megawatt-hour<br />
organic waste into biogas, has led to a reduction<br />
in the consumption of over six million megajoules<br />
of natural gas. In Bournemouth in the UK, our<br />
operations used 244 megawatt-hours less of grid<br />
electricity compared to the previous year. Standby<br />
generation was also reduced, saving 6,028 litres of<br />
gasoil which led to a reduction of over 150 tonnes<br />
of carbon dioxide emissions. Photovoltaic cells will<br />
be installed to generate clean electricity for the plant.<br />
In addition, pumps will be refurbished to ensure<br />
efficiency during operation. Page 91 provides a<br />
summary of the energy efficiency technologies<br />
which we apply in our operations.<br />
Our carbon dioxide emission estimate 1 is derived<br />
from stationary fuel combustion and does not cover<br />
process emissions. In <strong>2011</strong>, our carbon dioxide<br />
emission amounted to over 6,500 kilotonnes as<br />
compared to over 7,600 kilotonnes in 2010. Our<br />
emissions estimate is based on the World Resource<br />
Institute / World Business Council for Sustainable<br />
Development Protocol as well as site specific data.<br />
1<br />
Emission data excludes plants in China which are not stationary fuel<br />
combustion plants<br />
Utilities’ Direct and Indirect Greenhouse<br />
Gas Emissions<br />
CO 2<br />
Equivalent<br />
Tonnes in Tonnes<br />
Carbon dioxide (CO 2 ) 6,578,944 6,578,944<br />
Methane (CH 4 ) 257 5,392<br />
Nitrous oxide (N 2 O) 129 39,928<br />
Total CO 2 equivalent 6,624,264<br />
Calculated using Defra conversion figures published in August <strong>2011</strong><br />
Atmospheric Emissions<br />
In addition to carbon dioxide and greenhouse gas<br />
emissions, we monitor emissions of sulphur oxides<br />
(SOx) and nitrogen oxides (NOx). The data tracked is<br />
from our energy generation operations in Singapore,<br />
the UAE and UK. Our operation in Teesside is the main<br />
contributor of SOx and NOx due to its use of coal.<br />
Utilities’ Atmospheric Emissions<br />
Tonnes<br />
SOx 1,997<br />
NOx 1,989<br />
Data covers Utilities operations in Singapore, the UAE and UK<br />
Water use and quality<br />
Our water business has grown significantly over<br />
the recent years through acquisitions and organic<br />
growth. We provide services ranging from specialised<br />
industrial wastewater treatment to water reclamation,<br />
desalination and the supply of potable and industrial<br />
water. <strong>Sembcorp</strong> manages facilities capable of<br />
producing and treating over seven million cubic<br />
metres of water and wastewater daily and serves<br />
over five million people worldwide. Through<br />
innovation, we make every effort to ensure the<br />
efficient use and reuse of water resources.<br />
As part of the water solutions we offer to our<br />
customers, we treat and supply water extracted<br />
from surface water, groundwater (including lakes,<br />
rivers, oceans and aquifers) as well as public utilities<br />
(including wastewater). In <strong>2011</strong>, our operations<br />
in Singapore, China, the UAE, UK and Vietnam<br />
extracted over 1,500 million cubic metres of water<br />
primarily for treatment, supply to our customers<br />
and use in our operations. Out of the total water<br />
extracted, 91% was surface water, 4% was<br />
groundwater, 3% was wastewater and 2% was<br />
water from public utilities.<br />
In <strong>2011</strong>, <strong>Sembcorp</strong> recycled almost 20 million<br />
cubic metres of water, or over 1% of our total<br />
volume used, for supply to our customers and use<br />
in our operations, reducing the intake of potable<br />
or raw water supplies and also helping our customers<br />
to reduce the amount of raw water needed for<br />
their operations.<br />
The graph below shows our potable water use<br />
and the amount of water recycled.<br />
Utilities’ Potable and Recycled Water Use<br />
Potable Water Use 1<br />
Recycled Water Use<br />
Million cubic metres<br />
40<br />
30<br />
20<br />
10<br />
0<br />
35.2<br />
2010<br />
18.3<br />
27.6<br />
<strong>2011</strong><br />
19.9<br />
Data covers Utilities operations in Singapore, China, the UAE, UK and Vietnam<br />
1<br />
Potable water refers to water from public utilities<br />
100 SEMBCORP INDUSTRIES ANNUAL REPORT <strong>2011</strong> GROWING SUSTAINABLE BUSINESSES 101
SUSTAINABILITY<br />
<strong>Sembcorp</strong> received numerous awards in <strong>2011</strong><br />
for its water services, including being named Water<br />
Company of the Year at the prestigious Global Water<br />
Intelligence’s Global Water Awards. This award<br />
recognises <strong>Sembcorp</strong> as the water company that has<br />
made “the most significant contribution to the<br />
development of the international water sector in<br />
2010”. Further information on the awards won by<br />
<strong>Sembcorp</strong> in <strong>2011</strong> can be found on page 96.<br />
Waste<br />
As one of the largest solid waste management<br />
players in Singapore, <strong>Sembcorp</strong> provides services that<br />
aim to reduce waste going to incineration or landfill<br />
facilities. We also promote waste reduction by<br />
encouraging recycling. In line with our business focus<br />
to reduce waste for disposal, we are actively<br />
developing differentiating know-how including<br />
energy-from-waste capabilities. Our woodchipfuelled<br />
biomass steam production plant began full<br />
commercial operations in late <strong>2011</strong>, and is the first<br />
such energy-from-waste facility in Singapore to<br />
produce renewable process steam for third party<br />
commercial customers on Jurong Island.<br />
Pollution<br />
Our Group HSE guidelines require that any<br />
uncontrolled and / or unauthorised discharge of<br />
substances or any spill and / or leak of 500 litres or<br />
more without secondary containment is reported.<br />
There were no reportable spills or leaks in <strong>2011</strong>.<br />
Accident and injury rate<br />
An enhanced set of HSE reporting parameters<br />
including the <strong>Sembcorp</strong> 4/0 targets was agreed upon<br />
in February <strong>2011</strong> for application across all business<br />
units in Singapore and overseas.<br />
Using indicators of accident frequency rate (AFR)<br />
and accident severity rate (ASR), in accordance with<br />
the tracking criteria set by Singapore’s Ministry of<br />
Manpower, the safety performance from our Utilities<br />
operations in Singapore, China, the UAE, UK and<br />
Vietnam has been recorded.<br />
Accident Statistics for the Utilities Business<br />
(excluding Solid Waste Management)<br />
<strong>2011</strong><br />
Accident Frequency Rate 1 2.05<br />
Accident Severity Rate 2 24<br />
1<br />
Number of workplace accidents per million man-hours worked<br />
2<br />
Number of man-days lost to workplace accidents per million<br />
man-hours worked<br />
Data covers operations in Singapore, China, the UAE, UK and Vietnam<br />
Our Utilities operations, excluding solid waste<br />
management, reported 14 lost time injuries and<br />
19 first aid cases in <strong>2011</strong>, plus 166 man-days lost<br />
in <strong>2011</strong> (0.01% of the total man-hours worked)<br />
due to injuries sustained by our employees and<br />
contractors during operations.<br />
Our employees are monitored for noise induced<br />
hearing loss and dermatitis and no case of either<br />
incident was reported in <strong>2011</strong>.<br />
The solid waste management business’ safety<br />
performance in Singapore is reported separately<br />
from the performance of the rest of our Utilities<br />
operations. This is due to the fact that the solid<br />
waste management business’ waste collection<br />
operations employ manual labour to a greater degree<br />
and therefore have a different risk profile from our<br />
energy, water and on-site logistics operations.<br />
Our solid waste management business in<br />
Singapore saw an increase in the AFR from 6.4 in<br />
2010 to 10.6 in <strong>2011</strong>. However, its ASR decreased<br />
from 346.9 in 2010 to 148.3 in <strong>2011</strong>. Safety remains<br />
important to us and our solid waste management<br />
business has taken preventive action to improve its<br />
AFR and ASR levels. This includes ‘toolbox meetings’<br />
with management and employees to cover the<br />
importance of health and safety and spot inspections<br />
at operational sites. In addition, monthly briefing<br />
sessions are organised to allow employees to share<br />
their lessons learnt in managing safety in their work.<br />
Vehicle accident rates<br />
<strong>Sembcorp</strong>’s solid waste management business<br />
in Singapore operates a fleet of 200 commercial<br />
vehicles and our staff undertake a considerable<br />
amount of driving each year. One of our key safety<br />
indicators for this business is vehicle accidents. In<br />
<strong>2011</strong>, there was a substantial decrease in the<br />
accident rate both in terms of absolute numbers<br />
(89 in <strong>2011</strong> compared to 137 in 2010) and number<br />
of incidents per 100,000 kilometres driven (0.7 in<br />
<strong>2011</strong> compared to 1.1 in 2010).<br />
Solid Waste Management’s Vehicle<br />
Accident Rate<br />
160<br />
120<br />
80<br />
40<br />
0<br />
Total number of vehicle accidents<br />
Vehicle accident rate per 100,000 km<br />
144<br />
2008<br />
134<br />
0.9 0.9<br />
2009<br />
137<br />
In January <strong>2011</strong>, in addition to the stringent<br />
selection process in the recruitment of drivers,<br />
the company also commenced a safety training<br />
programme for our waste collection truck drivers<br />
in Singapore. This has improved their road safety<br />
awareness and defensive driving ability to reduce<br />
accident rates.<br />
Health and safety life cycle assessments<br />
All our products and services are assessed<br />
according to internationally recognised HSE and<br />
quality management systems. HSE and quality<br />
internal audits are conducted regularly to ensure<br />
that the quality of our water supply meets legal and<br />
product specifications. For the list of certifications<br />
achieved by <strong>Sembcorp</strong>’s businesses, please refer<br />
to page 99.<br />
1.1<br />
2010<br />
89<br />
0.7<br />
<strong>2011</strong><br />
1.6<br />
1.2<br />
0.8<br />
0.4<br />
0<br />
Human Resource and Employee Welfare<br />
Management approach to human resource<br />
and employee welfare<br />
At <strong>Sembcorp</strong>, we recognise that our employees<br />
are our most valuable asset and a key stakeholder<br />
group. We are committed to providing a fair, diverse and<br />
inclusive workplace, and to continuous improvement in<br />
our human resource and people development practices.<br />
Diversity and fair employment approach<br />
and statistics<br />
<strong>Sembcorp</strong> strives to maintain a fair, diverse and<br />
inclusive workplace for all its employees. At the end of<br />
<strong>2011</strong>, there were over 5,000 permanent employees in<br />
the entire <strong>Sembcorp</strong> group, excluding employees from<br />
the Marine business. 11% of our total headcount<br />
were contract employees. Please see the charts on the<br />
following pages for the distribution of all <strong>Sembcorp</strong>’s<br />
permanent employees, excluding employees from the<br />
Marine business, by age, geographical region, gender<br />
and education. Any deviation from this scope is noted<br />
under the individual sections.<br />
With our headquarters based in Singapore, the<br />
Group subscribes to the Principles of Fair Employment<br />
formulated by the Singapore Tripartite Alliance for Fair<br />
Employment Practices and has endorsed the Tripartite<br />
Alliance’s Employers’ Pledge of Fair Employment<br />
Practices. These principles, embedded into our human<br />
resource practices and implemented by <strong>Sembcorp</strong> on<br />
a global level, include a commitment to:<br />
Recruit and select based on merit, such as skills,<br />
experience and ability, regardless of age, race,<br />
gender or family status<br />
Treat employees fairly and with respect and<br />
implement progressive human resource<br />
management systems<br />
Provide equal opportunities for training and<br />
development based on employees’ strengths and<br />
needs, to help them achieve their full potential.<br />
Reward fairly, based on ability, performance,<br />
contribution and experience<br />
Abide by labour laws and adopt tripartite guidelines<br />
which promote fair employment practices<br />
102 SEMBCORP INDUSTRIES ANNUAL REPORT <strong>2011</strong> GROWING SUSTAINABLE BUSINESSES 103
SUSTAINABILITY<br />
The significantly higher proportion of male<br />
employees in <strong>Sembcorp</strong>’s headcount is consistent<br />
with industry norms, where the nature of work<br />
required in plants involves more physically demanding<br />
tasks. <strong>Sembcorp</strong> ensures that equal opportunity is<br />
given to all female employees across the Group.<br />
The staff distribution of non-executive staff<br />
by gender is 12% female and 88% male. The<br />
distribution of staff by gender for executives is<br />
28% female and 72% male.<br />
<strong>Annual</strong> Employee Turnover (%)<br />
2009 2010 <strong>2011</strong><br />
Turnover 12 12 12<br />
2009 and 2010 data does not cover our municipal water businesses<br />
acquired in 2010.<br />
Geographical Distribution of Staff by Gender<br />
Number of male employees<br />
2,000<br />
1,600<br />
1,200<br />
1,776<br />
1,426<br />
Number of female employees<br />
<strong>Sembcorp</strong> Staff Distribution by Age<br />
29 & below 40 – 49<br />
30 – 34 50 & above<br />
35 – 39<br />
19%<br />
16%<br />
<strong>Sembcorp</strong> Staff Distribution by Geography<br />
ASEAN<br />
Europe<br />
Other Asia<br />
Others<br />
Middle East & Africa<br />
3%<br />
13%<br />
800<br />
400<br />
0<br />
425<br />
386<br />
279<br />
ASEAN Other Asia Middle East<br />
Europe Others<br />
& Africa<br />
74<br />
647<br />
60<br />
142<br />
26<br />
31%<br />
18%<br />
<strong>Sembcorp</strong> Staff Distribution by Gender<br />
Female<br />
Male<br />
19%<br />
81%<br />
16%<br />
7%<br />
42%<br />
35%<br />
<strong>Sembcorp</strong> Staff Distribution by Education<br />
Non-tertiary<br />
Tertiary<br />
47%<br />
53%<br />
Human rights<br />
<strong>Sembcorp</strong> fully supports the basic principles<br />
of human rights and has implemented a number<br />
of policies throughout the Group in support of these<br />
principles, including fair employment practices and<br />
a grievance and harassment policy.<br />
A key tenet of <strong>Sembcorp</strong>’s business ethics is strict<br />
respect for labour laws within each of the countries<br />
we operate in, all of which preclude forced or child<br />
labour, and is further supported through our policies<br />
and employment practices. The technical nature of<br />
our operations requires an experienced workforce,<br />
both within the organisation and in our supply chain,<br />
as specialist skills are required.<br />
Employee health and welfare<br />
<strong>Sembcorp</strong> continues to promote a holistic and<br />
balanced lifestyle for our employees, which we<br />
believe is good for both their physical and mental<br />
health. We encourage employees at our various<br />
business units to participate in employee recreation<br />
activities throughout the year, including community<br />
outreach and volunteering initiatives, team sports<br />
events, talks, gatherings and employee family days.<br />
Some of these activities welcome employees to<br />
participate with their family members, such as our<br />
<strong>Sembcorp</strong> Family Day in Singapore and Fujairah.<br />
<strong>Sembcorp</strong> also organises an annual Health<br />
Week, a company-funded health education initiative<br />
that helps equip employees in Singapore with<br />
essential health knowledge and personal lifestyle skills.<br />
Employee engagement<br />
We recognise the importance of engaging with<br />
our employees and have various platforms through<br />
which we communicate with and receive feedback<br />
from our staff. We provide information on our financial<br />
and business performance as well as on applicable<br />
company standards and policies to our staff. Interactive<br />
staff communication sessions with management are in<br />
place to ensure two-way communication between the<br />
company and its employees.<br />
104 SEMBCORP INDUSTRIES ANNUAL REPORT <strong>2011</strong> GROWING SUSTAINABLE BUSINESSES 105
SUSTAINABILITY<br />
Staff communication<br />
In <strong>2011</strong>, we continued to hold employee briefing<br />
sessions in conjunction with the company’s quarterly<br />
financial reporting cycle. At these sessions, senior<br />
management provides employees with information<br />
on the company’s performance and key<br />
developments. Presentations are also held to brief<br />
employees on topics such as corporate social<br />
responsibility or specific company policies such<br />
as fraud management.<br />
We continue to hold an annual communication<br />
forum in Singapore for managers from <strong>Sembcorp</strong><br />
offices all over the world, with detailed briefings from<br />
top management and external experts on our Group’s<br />
operating environment, performance, outlook and<br />
strategy. This forum incorporates an interactive<br />
networking and question and answer session.<br />
Furthermore, at the country level, some business<br />
units also hold quarterly learning and sharing sessions,<br />
senior manager briefings and staff consultation group<br />
sessions. At <strong>Sembcorp</strong> Bournemouth Water in the UK,<br />
there is also a staff consultative group made up<br />
of elected staff representatives and management<br />
representatives, which meets quarterly to discuss<br />
relevant employee issues.<br />
Over the course of the year, we continued to<br />
communicate corporate updates and business<br />
milestones to all staff through employee emails and<br />
bi-monthly e-newsletters. Relevant and up-to-date<br />
information on staff welfare and benefits was also<br />
publicised to employees via the company intranet.<br />
Other forms of engagement<br />
<strong>Sembcorp</strong> welcomes feedback from its employees<br />
and provides confidential channels through which<br />
employees can submit feedback and staff<br />
suggestions, including an easily accessible online<br />
channel on the employee intranet. All feedback is<br />
sent to the Group Human Resource department and,<br />
if sent via the internet, is also automatically copied to<br />
the Senior Vice President of Group Human Resource<br />
and the Group President & CEO’s office.<br />
In line with our commitment to high ethical<br />
standards and good corporate governance practices,<br />
we have in place a group-wide whistle-blowing policy<br />
and encourage all employees to report any possible<br />
improprieties on a confidential basis without fear of<br />
recrimination. We have an easily accessible whistleblowing<br />
link on our company intranet and employees<br />
may also provide feedback via email, mail or fax.<br />
People development<br />
Labour and union relations<br />
Within the boundaries of each of the jurisdictions<br />
under which we operate, <strong>Sembcorp</strong> employees are<br />
entitled to practise freedom of association in the<br />
workplace. <strong>Sembcorp</strong>’s operations span six<br />
continents where labour relations, regulations and<br />
practices differ widely. In <strong>2011</strong>, 42% of <strong>Sembcorp</strong>’s<br />
employees were union members.<br />
<strong>Sembcorp</strong> maintains excellent labour<br />
management relations with its unions, and holds<br />
constructive ongoing exchanges with employee<br />
unions in its various locations. In Singapore,<br />
<strong>Sembcorp</strong> is committed to working closely with<br />
the Building Construction and Timber <strong>Industries</strong><br />
Employees Union (BATU) as well as the Union<br />
of Power and Gas Employees (UPAGE). Our reemployment<br />
policy, endorsed by BATU and UPAGE,<br />
gives medically fit employees the option of<br />
continuing on their jobs beyond the statutory<br />
retirement age. In an event organised by BATU and<br />
<strong>Sembcorp</strong>, the Prime Minister of Singapore visited<br />
our Bukit Merah Depot on the first day of Lunar New<br />
Year in <strong>2011</strong> to show appreciation to the workers<br />
who continued to work tirelessly and perform vital<br />
duties on this public holiday.<br />
In the UK, <strong>Sembcorp</strong> Bournemouth Water has a<br />
long standing relationship with its recognised unions<br />
GMB and Unison. Both unions sit on <strong>Sembcorp</strong>’s staff<br />
consultative group and the health and safety<br />
committee, where they also participate in safety<br />
inspections. At our Teesside operations, discussions<br />
with Unite (the UK’s biggest union) are conducted in<br />
line with our collective ‘Together Agreement’ which<br />
covers over 90% of our employees at this operation.<br />
Formal joint consultation meetings with employees<br />
and unions are conducted three times a year, and<br />
meetings between management and the company’s<br />
senior union representatives are held bi-monthly.<br />
Personal and professional development<br />
opportunities<br />
<strong>Sembcorp</strong>’s success is driven by the calibre and<br />
performance of its people. We recognise that it is<br />
essential to equip our employees across all levels of<br />
seniority to meet the changing needs of the<br />
marketplace. <strong>Sembcorp</strong> offers employees a range of<br />
personal and professional development opportunities<br />
including career development, education, talent<br />
management and leadership programmes.<br />
Competency building and succession planning<br />
In <strong>2011</strong>, the Group continued to invest in<br />
competency building for our employees, spending<br />
over S$1.5 million on training for employees within<br />
our operations in Singapore, China, the UAE and UK.<br />
It is a priority for us to enhance the skill level<br />
of our employees to ensure smooth succession.<br />
<strong>Sembcorp</strong>’s learning and development programmes<br />
factor in issues such as succession planning and<br />
addressing skill gaps with relation to core<br />
competency requirements.<br />
Around 5% of our non-executive staff worldwide<br />
are due to retire in the next five years, and a further<br />
7% in the next six to 10 years. Around 2% of our<br />
executive staff worldwide are due to retire in the next<br />
five years, and a further 5% in the next six to 10 years.<br />
Executive and leadership development<br />
The <strong>Sembcorp</strong> Leadership Competencies<br />
programme is our unique talent management and<br />
development system that defines the qualities and<br />
performance expectations of a <strong>Sembcorp</strong> leader.<br />
Capable leaders are crucial in achieving business<br />
success and the <strong>Sembcorp</strong> Leadership Competencies<br />
detail the ways in which <strong>Sembcorp</strong> leaders should<br />
act and respond. Managers also attend courses<br />
to enhance their presentation, negotiation,<br />
communication and coaching skills as well as<br />
courses on building and leading high-performance<br />
teams. Senior executives are expected to undertake<br />
regular training to update and upgrade their<br />
skills and education programmes are accessible to<br />
them at prestigious institutes such as the Harvard<br />
Business School, INSEAD and the Temasek Business<br />
Leadership Centre.<br />
Attachments, job rotations and working tours<br />
We offer employees the opportunity to<br />
experience different cultural and operational settings<br />
through job rotations and attachments. We currently<br />
have more than 50 employees of different<br />
nationalities posted from our Singapore office to<br />
various overseas businesses. Internships and industrial<br />
attachments also provide students and <strong>Sembcorp</strong><br />
scholars with practical experience and exposure to<br />
our operations while they undergo their studies.<br />
Professional and on-the-job training<br />
We send our employees for professional training<br />
to allow them to develop skill sets that better equip<br />
them for their roles. Working with local educational<br />
institutions in Singapore, we send our engineers to<br />
specialised technical competency courses. Our<br />
employees are also sent for professional training<br />
related to the industry, including courses under<br />
Singapore’s National Skills Recognition Scheme and<br />
Workforce Skills Qualification scheme under the<br />
Workforce Development Authority.<br />
In Singapore, staff are also encouraged to<br />
pursue higher qualifications which are sponsored<br />
by the company.<br />
In the UK, our operations are signed up to the<br />
‘Investors in People’ standard, the UK’s leading people<br />
management standard. This provides a business<br />
improvement tool to help organisations develop<br />
performance through their people. Both our<br />
106 SEMBCORP INDUSTRIES ANNUAL REPORT <strong>2011</strong> GROWING SUSTAINABLE BUSINESSES 107
SUSTAINABILITY<br />
operations aim to provide education and training<br />
for all employees to carry out their duties and provide<br />
them with appropriate opportunities for development.<br />
This involves identifying skill gaps in accordance with<br />
core competencies. <strong>Sembcorp</strong> is also helping to shape<br />
the future of the industry by proactively engaging in<br />
training and skills development throughout the<br />
northeastern region, as well as raise the performance<br />
bar of apprentices and other workers in the industry.<br />
Knowledge sharing<br />
As an industry leader in various sectors,<br />
<strong>Sembcorp</strong> encourages our employees to share<br />
and exchange best practices through platforms<br />
such as seminars and conferences on a local<br />
and international basis. In the UK, our Senior Vice<br />
President of Regional Human Resource sits as the<br />
Chairman of the North East Regional Skills Board for<br />
the National Skills Academy for the Process <strong>Industries</strong><br />
and uses his expertise to improve the skills of the<br />
existing workforce as well as attract and retain new<br />
entrants to the industry.<br />
Performance management<br />
<strong>Sembcorp</strong> has implemented a system for<br />
performance appraisals across its operations in all<br />
countries. The appraisal system allows all employees<br />
to comment on their personal contribution<br />
throughout the year and to jointly identify areas for<br />
further career development and learning with their<br />
supervisors on a regular basis. It enables constructive<br />
discussion and uses the feedback process to ensure<br />
that employees share the responsibility for managing<br />
their career and goals. The appraisal process<br />
incorporates shared future objectives to ensure that<br />
employee outputs are also aligned to the needs of<br />
the business. Selected senior managers are also<br />
assessed using a 360-degree appraisal system where<br />
feedback is sought from a range of superiors, peers<br />
and colleagues and other partners. The profile of<br />
essential competencies for the job function compiled<br />
from this process is also incorporated into these<br />
managers’ development plans, helping them lead<br />
their teams successfully and enhance their<br />
professional performance.<br />
Remuneration, benefits and rewards<br />
Rewarding performance is the key component<br />
of <strong>Sembcorp</strong>’s employment retention strategy.<br />
The Group offers competitive base pay packages<br />
throughout our global businesses that are based on<br />
country-specific conditions. Rewards include annual<br />
salary increments and annual performance bonuses,<br />
as well as longer-term incentives linked to sector<br />
practices and based on the performance of the<br />
Group, the company and the individual.<br />
Share-based incentives, administered by a board<br />
nominated committee, remain a key component<br />
of the Group’s pay structure and are deliberately<br />
aligned to long-term Group performance objectives.<br />
Since 2007, share options granted to staff have been<br />
replaced with restricted stocks. shares. This Restricted Stock Share<br />
Plan applies to employees of the Group, while the<br />
Performance Share Plan is primarily for key executives<br />
of the Group.<br />
All employees are eligible for comprehensive<br />
insurance coverage on a global basis. They can join<br />
the company’s private medical and dental insurance<br />
scheme under which the company meets the cost of<br />
employee membership and allows employees to<br />
include eligible dependants. The company also<br />
provides additional insurance cover for life, travel,<br />
personal accidents, workers’ compensation and<br />
hospitalisation and surgical expenses.<br />
Wider Community<br />
<strong>Sembcorp</strong> maintains an ongoing commitment<br />
to support the local communities in which we<br />
operate through supporting social development and<br />
community investment projects. In <strong>2011</strong>, <strong>Sembcorp</strong><br />
contributed over S$1.3 million in cash and in-kind<br />
support to its communities (excluding community<br />
investment initiatives by our separately listed Marine<br />
business). We took part in many initiatives in our<br />
communities in support of children and the elderly,<br />
education, the environment and sports and fitness.<br />
Our employees are active volunteers in the<br />
community, providing helping hands as well as<br />
management expertise. 48% of our operations<br />
have local community engagements and<br />
development programmes.<br />
Volunteering<br />
Our employees offer their time to volunteer in<br />
a number of initiatives that the company organises.<br />
For example:<br />
<strong>Sembcorp</strong> has been a supporter of Singapore’s<br />
Assisi Hospice (which provides palliative care for<br />
people with life-limiting illnesses) since 2008.<br />
<strong>Sembcorp</strong> volunteers help with the running of<br />
the charity’s Fun Carnival, which generated more<br />
than S$800,000 in donations in <strong>2011</strong>, as well as<br />
its Christmas carnival, bringing goodwill and<br />
cheer to the patients.<br />
For the third year running, <strong>Sembcorp</strong> has<br />
partnered with the Sunshine Welfare Action<br />
Mission (SWAMI) in Singapore to bring festive<br />
cheer to needy elderly households. SWAMI is a<br />
non-profit organisation providing nursing care<br />
and shelter for the sick, aged and handicapped<br />
from needy backgrounds. In the run-up to the<br />
Lunar New Year in <strong>2011</strong>, SWAMI identified 23<br />
households whose residents do not have the ease<br />
of movement, to benefit from volunteers spring<br />
cleaning their homes.<br />
In the UK, <strong>Sembcorp</strong> employee Jane Atkinson<br />
was granted an honorary doctorate in Business<br />
Administration by Teesside University, one of the<br />
leading UK universities for engineering, in<br />
recognition of her work in championing<br />
engineering education among youths.<br />
Community outreach activities<br />
<strong>Sembcorp</strong> supports projects that help<br />
communities, such as:<br />
In <strong>2011</strong>, <strong>Sembcorp</strong>, through its joint venture<br />
in the Vietnam Singapore Industrial Park,<br />
launched the first community clinic in Binh<br />
Duong. With a medical team from My Phuoc<br />
Hospital, this clinic provides free first aid,<br />
medical consultation and counselling services<br />
for the medically underserved populations<br />
of Binh Duong province.<br />
In China, our Yancheng operations organised<br />
their fifth ‘Water Services For The Community’<br />
event in the Chaoyang district to promote the<br />
accessibility of municipal water for all. The event<br />
helped facilitate water maintenance and repair<br />
services for the residents, and also generated<br />
greater awareness on water conservation, quality<br />
and pricing.<br />
In South Africa, <strong>Sembcorp</strong> Siza Water donated<br />
an immune haematology test machine to a local<br />
non-governmental organisation HIV / AIDS centre<br />
to help overcome traveling and cost barriers<br />
to getting tested.<br />
<strong>Sembcorp</strong> Water Technology Prize<br />
In <strong>2011</strong>, <strong>Sembcorp</strong> presented the <strong>Sembcorp</strong> Water Technology Prize to winning teams from three<br />
schools. The first such competition of its kind in Singapore, it exposes secondary and junior college students<br />
to the challenges facing the water industry, spurring them to develop solutions to those challenges. Students<br />
attend site visits as well as hands-on training sessions, and are mentored by top researchers as well as<br />
lecturers for their projects. By giving students an insight into the latest water technologies, as well as access<br />
to resources and materials for their projects, the competition inculcates an interest in water technology<br />
and environmental issues to help develop Singapore’s pool of water and environmental specialists.<br />
The competition is co-organised by Singapore’s national water agency PUB, the Nanyang Technological<br />
University’s Singapore Membrane Technology Centre and Singapore Polytechnic.<br />
108 SEMBCORP INDUSTRIES ANNUAL REPORT <strong>2011</strong> GROWING SUSTAINABLE BUSINESSES 109
SUSTAINABILITY<br />
<strong>Sembcorp</strong> Bournemouth Water has been a<br />
supporter of international charity WaterAid. In<br />
<strong>2011</strong>, <strong>Sembcorp</strong> Bournemouth Water received<br />
The President’s Award, endorsed by WaterAid’s<br />
President, His Royal Highness The Prince of Wales,<br />
for its support over the last 30 years.<br />
Our operations in Teesside extended their<br />
professional expertise to a neighbouring village<br />
to help secure lower costs with the building<br />
suppliers for the renovations of their historic<br />
village hall.<br />
<strong>Sembcorp</strong> Utilities Chile worked with local<br />
community leaders to pilot a campaign in two<br />
Santiago regions, entitled ‘Yo cuido mi grifo’<br />
(I take care of my fire hydrant), to educate the<br />
local community about the importance of fire<br />
hydrants. The project also saw the opening of<br />
two children’s water parks. The project resulted in<br />
savings of over 600,000 litres of water a day.<br />
Sustainability Contact<br />
For further information on sustainability<br />
at <strong>Sembcorp</strong> <strong>Industries</strong>, please visit our website<br />
at www.sembcorp.com. If you have any comments<br />
or wish to discuss any of the contents of this report<br />
or other sustainability issues, please contact:<br />
Group Corporate Relations<br />
Tel: +65 6723 3113<br />
Email: gcr@sembcorp.com<br />
Wildlife and biodiversity<br />
<strong>Sembcorp</strong> also contributes to programmes<br />
supporting wildlife and biodiversity. We continue<br />
to support the <strong>Sembcorp</strong> Forest of Giants in the<br />
Southern Ridges through donations to the Singapore<br />
National Parks Board’s registered charity, the Garden<br />
City Fund. In <strong>2011</strong>, we further developed the<br />
programme to promote greater awareness and<br />
appreciation of nature. <strong>Sembcorp</strong> volunteers were<br />
trained to be guides of the Southern Ridges, which<br />
span the hills of Mount Faber Park in Singapore.<br />
<strong>Sembcorp</strong>’s municipal water operations in<br />
Bournemouth, UK, continues its long-standing<br />
support of the Dorset Wildlife Trust which manages<br />
more than 40 nature reserves in the county. In <strong>2011</strong>,<br />
<strong>Sembcorp</strong> Bournemouth Water provided support to<br />
the charity to restore areas of chalk streams that have<br />
been affected by human intervention. The crystal<br />
clear waters of chalk streams support more wildlife<br />
than any other waters in Britain, with a huge range<br />
of aquatic insects, spawning sites for trout and<br />
salmon and food for predators.<br />
<strong>Sembcorp</strong>’s woodchip-fuelled biomass steam production plant on Jurong Island, Singapore<br />
110 SEMBCORP INDUSTRIES ANNUAL REPORT <strong>2011</strong>
FINANCIAL<br />
STATEMENTS<br />
Directors’ <strong>Report</strong> 114<br />
Statement by Directors 132<br />
Independent Auditors’ <strong>Report</strong> 133<br />
Balance Sheets 134<br />
Consolidated Income Statement 135<br />
Consolidated Statement of Comprehensive Income 136<br />
Consolidated Statement of Changes in Equity 137<br />
Consolidated Statement of Cash Flows 141<br />
Notes to the Financial Statements 143<br />
Supplementary Information 260<br />
EVA Statement 263<br />
Shareholders’ Information 264<br />
Corporate Information 265<br />
Notice of <strong>Annual</strong> General Meeting 266<br />
Proxy Form 271<br />
<strong>Sembcorp</strong>’s membrane bioreactor wastewater treatment plant on Jurong Island, Singapore.
DIRECTORS’ REPORT<br />
Year Ended December 31, <strong>2011</strong><br />
We are pleased to submit this annual report to the members of the Company together with the audited financial statements<br />
for the financial year ended December 31, <strong>2011</strong>.<br />
Directors<br />
The directors in office at the date of this report are as follows:<br />
Ang Kong Hua<br />
Tang Kin Fei<br />
Goh Geok Ling<br />
Evert Henkes<br />
Bobby Chin Yoke Choong<br />
Margaret Lui<br />
Tan Sri Mohd Hassan Marican<br />
Tham Kui Seng (appointed on June 1, <strong>2011</strong>)<br />
Directors’ Interests<br />
According to the register kept by the Company for the purposes of Section 164 of the Singapore Companies Act, Chapter<br />
50 (the “Act”), particulars of interests of directors who held office at the end of the financial year (including those held<br />
by their spouses and infant children) in shares, debentures, warrants and share options in the Company and in related<br />
corporations are as follows:<br />
Shareholdings registered in the name<br />
Other shareholdings in which director<br />
of director, spouse or infant children is deemed to have an interest<br />
At<br />
beginning<br />
Name of director of the year / At<br />
and corporation date of At end At beginning At end At<br />
in which interests held Description of interests Exercise period appointment of the year 21/01/2012 of the year of the year 21/01/2012<br />
Ang Kong Hua<br />
<strong>Sembcorp</strong> <strong>Industries</strong> Ltd Ordinary shares – 20,300 20,300 – – –<br />
Conditional award of:<br />
– 20,300 restricted shares 20,300 – – – – –<br />
to be delivered in <strong>2011</strong><br />
(Note 4)<br />
Tang Kin Fei<br />
<strong>Sembcorp</strong> <strong>Industries</strong> Ltd Ordinary shares 3,024,405 3,593,826 3,593,826 – – –<br />
Options to subscribe<br />
for ordinary shares at<br />
– S$2.37 per share 02/07/2006 150,000 – – – – –<br />
to 01/07/2015<br />
– S$2.36 per share 22/11/2006 150,000 150,000 150,000 – – –<br />
to 21/11/2015<br />
Directors’ Interests (cont’d)<br />
Shareholdings registered in the name<br />
Other shareholdings in which director<br />
of director, spouse or infant children is deemed to have an interest<br />
At<br />
beginning<br />
Name of director of the year / At<br />
and corporation date of At end At beginning At end At<br />
in which interests held Description of interests Exercise period appointment of the year 21/01/2012 of the year of the year 21/01/2012<br />
Tang Kin Fei (cont’d)<br />
<strong>Sembcorp</strong> <strong>Industries</strong> Ltd Conditional award of:<br />
– 400,000 performance Up to<br />
shares to be delivered 600,000 – – – – –<br />
after 2010 (Note 1a)<br />
– 400,000 performance Up to Up to Up to<br />
shares to be delivered 600,000 600,000 600,000 – – –<br />
after <strong>2011</strong> (Note 1b)<br />
– 400,000 performance Up to Up to Up to<br />
shares to be delivered 600,000 600,000 600,000 – – –<br />
after 2012 (Note 1c)<br />
– 400,000 performance Up to Up to<br />
shares to be delivered – 600,000 600,000 – – –<br />
after 2013 (Note 1d)<br />
– 128,596 restricted shares 27,861 – – – – –<br />
to be delivered<br />
after 2008 (Note 2(i))<br />
– 126,000 restricted shares 82,320 41,160 41,160 – – –<br />
to be delivered<br />
after 2009 (Note 3a(i))<br />
– 126,000 restricted shares Up to<br />
to be delivered 189,000 100,800 100,800 – – –<br />
after 2010 (Note 3b(i))<br />
– 126,000 restricted shares Up to Up to Up to<br />
to be delivered 189,000 189,000 189,000 – – –<br />
after <strong>2011</strong> (Note 3c)<br />
– 126,000 restricted shares Up to Up to<br />
to be delivered – 189,000 189,000 – – –<br />
after 2012 (Note 3d)<br />
– S$2.52 per share 10/06/2007 300,000 300,000 300,000 – – –<br />
to 09/06/2016<br />
114 SEMBCORP INDUSTRIES ANNUAL REPORT <strong>2011</strong><br />
GROWING SUSTAINABLE BUSINESSES 115
DIRECTORS’ REPORT<br />
Year Ended December 31, <strong>2011</strong><br />
Directors’ Interests (cont’d)<br />
Shareholdings registered in the name<br />
Other shareholdings in which director<br />
of director, spouse or infant children is deemed to have an interest<br />
At<br />
beginning<br />
Name of director of the year / At<br />
and corporation date of At end At beginning At end At<br />
in which interests held Description of interests Exercise period appointment of the year 21/01/2012 of the year of the year 21/01/2012<br />
Tang Kin Fei (cont’d)<br />
<strong>Sembcorp</strong> Marine Ltd Ordinary shares 123,880 182,570 182,570 – – –<br />
Options to subscribe<br />
for ordinary shares at<br />
– S$2.38 per share 03/10/2007 24,500 – – – – –<br />
to 02/10/<strong>2011</strong><br />
Conditional award of:<br />
– 18,900 restricted shares 8,190 – – – – –<br />
to be delivered<br />
after 2008 (Note 2(ii))<br />
– 12,000 restricted shares 12,000 6,000 6,000 – – –<br />
to be delivered<br />
after 2009 (Note 3a(ii))<br />
– 17,000 restricted shares Up to<br />
to be delivered 25,500 17,000 17,000 – – –<br />
after 2010 (Note 3b(ii))<br />
– 11,500 restricted shares 11,500 – – – – –<br />
to be delivered<br />
in <strong>2011</strong> (Note 5)<br />
Directors’ Interests (cont’d)<br />
Shareholdings registered in the name<br />
Other shareholdings in which director<br />
of director, spouse or infant children is deemed to have an interest<br />
At<br />
beginning<br />
Name of director of the year / At<br />
and corporation date of At end At beginning At end At<br />
in which interests held Description of interests Exercise period appointment of the year 21/01/2012 of the year of the year 21/01/2012<br />
Goh Geok Ling (cont’d)<br />
<strong>Sembcorp</strong> <strong>Industries</strong> Ltd Conditional award of:<br />
– 13,982 restricted shares 3,028 – – – – –<br />
to be delivered<br />
after 2008 (Note 2(iii))<br />
– 13,700 restricted shares 8,950 4,474 4,474 – – –<br />
to be delivered<br />
after 2009 (Note 3a(iii))<br />
– 13,700 restricted shares Up to<br />
to be delivered 20,550 10,960 10,960 – – –<br />
after 2010 (Note 3b(iii))<br />
– 13,700 restricted shares 13,700 – – – – –<br />
to be delivered<br />
in <strong>2011</strong> (Note 4)<br />
<strong>Sembcorp</strong> Marine Ltd Ordinary shares 127,694 293,040 293,040 – – –<br />
Options to subscribe<br />
for ordinary shares at<br />
– S$2.38 per share 03/10/2007 106,000 – – – – –<br />
to 02/10/<strong>2011</strong><br />
<strong>Sembcorp</strong> Financial<br />
Services Pte Ltd<br />
Fixed Rate Notes issued<br />
under the S$1.5 Billion<br />
Multicurrency Medium<br />
Term Note Programme Principal Principal Principal<br />
(Note 6) amount: amount: amount:<br />
– Due 2014 S$500,000 S$500,000 S$500,000 – – –<br />
– Due 2020 S$500,000 S$500,000 S$500,000 – – –<br />
Conditional award of:<br />
– 30,800 restricted shares 13,346 – – – – –<br />
to be delivered<br />
after 2008 (Note 2(iv))<br />
– 22,000 restricted shares 22,000 11,000 11,000 – – –<br />
to be delivered<br />
after 2009 (Note 3a(iv))<br />
Goh Geok Ling<br />
<strong>Sembcorp</strong> <strong>Industries</strong> Ltd Ordinary shares 440,136 484,320 484,320 47,000 47,000 47,000<br />
Options to subscribe<br />
for ordinary shares at<br />
– S$2.52 per share 10/06/2007 17,500 – – – – –<br />
to 09/06/<strong>2011</strong><br />
– 29,000 restricted shares Up to<br />
to be delivered 43,500 29,000 29,000 – – –<br />
after 2010 (Note 3b(iv))<br />
– 20,500 restricted shares 20,500 – – – – –<br />
to be delivered<br />
in <strong>2011</strong> (Note 5)<br />
116 SEMBCORP INDUSTRIES ANNUAL REPORT <strong>2011</strong><br />
GROWING SUSTAINABLE BUSINESSES 117
DIRECTORS’ REPORT<br />
Year Ended December 31, <strong>2011</strong><br />
Directors’ Interests (cont’d)<br />
Shareholdings registered in the name<br />
Other shareholdings in which director<br />
of director, spouse or infant children is deemed to have an interest<br />
At<br />
beginning<br />
Name of director of the year / At<br />
and corporation date of At end At beginning At end At<br />
in which interests held Description of interests Exercise period appointment of the year 21/01/2012 of the year of the year 21/01/2012<br />
Evert Henkes<br />
<strong>Sembcorp</strong> <strong>Industries</strong> Ltd Ordinary shares 99,383 113,018 113,018 – – –<br />
Conditional award of:<br />
– 7,144 restricted shares 1,548 – – – – –<br />
to be delivered<br />
after 2008 (Note 2(v))<br />
– 7,000 restricted shares 4,573 2,286 2,286 – – –<br />
to be delivered<br />
after 2009 (Note 3a(v))<br />
– 7,000 restricted shares Up to<br />
to be delivered 10,500 5,600 5,600 – – –<br />
after 2010 (Note 3b(v))<br />
– 7,000 restricted shares 7,000 – – – – –<br />
to be delivered<br />
in <strong>2011</strong> (Note 4)<br />
Bobby Chin Yoke Choong<br />
<strong>Sembcorp</strong> <strong>Industries</strong> Ltd Ordinary shares – 15,400 15,400 – – –<br />
Conditional award of:<br />
– 11,000 restricted shares Up to<br />
to be delivered 16,500 8,800 8,800 – – –<br />
after 2010 (Note 3b(vi))<br />
– 11,000 restricted shares 11,000 – – – – –<br />
to be delivered<br />
in <strong>2011</strong> (Note 4)<br />
Margaret Lui – – – – – – –<br />
Tan Sri Mohd Hassan Marican – – – – – – –<br />
Tham Kui Seng – – – – – – –<br />
Directors’ Interests (cont’d)<br />
Note 1:<br />
Note 2:<br />
Note 3:<br />
The actual number to be delivered will depend on the achievement of set targets over a 3-year period as indicated below. Achievement of<br />
targets below threshold level will mean no performance shares will be delivered, while achievement up to 150% will mean up to 1.5 times the<br />
number of conditional performance shares awarded could be delivered.<br />
a. Period from 2008 to 2010 *<br />
b. Period from 2009 to <strong>2011</strong><br />
c. Period from 2010 to 2012<br />
d. Period from <strong>2011</strong> to 2013<br />
*<br />
For this period, 300,000 <strong>Sembcorp</strong> <strong>Industries</strong> Ltd (SCI) shares were released to Tang Kin Fei on March 23, <strong>2011</strong>. The balance of the<br />
conditional awards covering the period has thus lapsed.<br />
The actual number to be delivered will depend on the achievement of set targets at the end of the 2-year performance period from 2007 to<br />
2008. Achievement of targets below threshold level will mean no restricted shares will be delivered, while achievement up to 130% will mean<br />
up to 1.3 times the number of conditional restricted shares awarded could be delivered.<br />
i. For this period, 27,861 SCI shares (the final release of the 1/3 of the 83,587 shares) were vested under the award to Tang Kin Fei on<br />
March 23, <strong>2011</strong>. The 1st and 2nd release of 27,863 shares each have been vested in 2009 and 2010 respectively.<br />
ii. For this period, 8,190 <strong>Sembcorp</strong> Marine Ltd (SCM) shares (the final release of the 1/3 of the 24,570 shares) were vested under the award to<br />
Tang Kin Fei on March 15, <strong>2011</strong>. The 1st and 2nd release of 8,190 shares each have been vested in 2009 and 2010 respectively.<br />
iii. For this period, 3,028 SCI shares (the final release of the 1/3 of the 9,088 shares) were vested under the award to Goh Geok Ling on<br />
March 23, <strong>2011</strong>. The 1st and 2nd release of 3,030 shares each have been vested in 2009 and 2010 respectively.<br />
iv. For this period, 13,346 SCM shares (the final release of the 1/3 of the 40,040 shares) were vested under the award to Goh Geok Ling on<br />
March 15, <strong>2011</strong>. The 1st and 2nd release of 13,347 shares each have been vested in 2009 and 2010 respectively.<br />
v. For this period, 1,548 SCI shares (the final release of the 1/3 of the 4,644 shares) were vested under the award to Evert Henkes on<br />
March 23, <strong>2011</strong>. The 1st and 2nd release of 1,548 shares each have been vested in 2009 and 2010 respectively.<br />
The actual number to be delivered will depend on the achievement of set targets at the end of the 2-year performance period as indicated<br />
below. Achievement of targets below threshold level will mean no restricted shares will be delivered, while achievement up to 150% will mean<br />
up to 1.5 times the number of conditional restricted shares awarded could be delivered.<br />
a. Period from 2008 to 2009 **<br />
b. Period from 2009 to 2010^<br />
c. Period from 2010 to <strong>2011</strong><br />
d. Period from <strong>2011</strong> to 2012<br />
**<br />
i. For this period, 41,160 SCI shares (2nd release of the 1/3 of the 123,480 shares) were vested under the award to Tang Kin Fei on March 23,<br />
<strong>2011</strong> and the remaining 41,160 shares will be vested in year 2012. The 1st release of 41,160 shares has been vested on March 10, 2010.<br />
ii. For this period, 6,000 SCM shares (2nd release of the 1/3 of the 18,000 shares) were vested under the award to Tang Kin Fei on March<br />
15, <strong>2011</strong> and the remaining 6,000 shares will be vested in year 2012. The 1st release of 6,000 shares has been vested on March 12, 2010.<br />
iii. For this period, 4,476 SCI shares (2nd release of the 1/3 of the 13,426 shares) were vested under the award to Goh Geok Ling on March<br />
23, <strong>2011</strong> and the remaining 4,474 shares will be vested in year 2012. The 1st release of 4,476 shares has been vested on March 10, 2010.<br />
iv. For this period, 11,000 SCM shares (2nd release of the 1/3 of the 33,000 shares) were vested under the award to Goh Geok Ling on March<br />
15, <strong>2011</strong> and the remaining 11,000 shares will be vested in year 2012. The 1st release of 11,000 shares has been vested on March 12, 2010.<br />
v. For this period, 2,287 SCI shares (2nd release of the 1/3 of the 6,860 shares) were vested under the award to Evert Henkes on March 23,<br />
<strong>2011</strong> and the remaining 2,286 shares will be vested in year 2012. The 1st release of 2,287 shares has been vested on March 10, 2010.<br />
^<br />
i. For this period, 50,400 SCI shares (1/3 of the 151,200 shares) were vested under the award to Tang Kin Fei on March 23, <strong>2011</strong> and the<br />
remaining 100,800 shares will be vested in year 2012/2013.<br />
ii. For this period, 8,500 SCM shares (1/3 of the 25,500 shares) were vested under the award to Tang Kin Fei on March 15, <strong>2011</strong> and the<br />
remaining 17,000 shares will be vested in year 2012/2013.<br />
iii. For this period, 5,480 SCI shares (1/3 of the 16,440 shares) were vested under the award to Goh Geok Ling on March 23, <strong>2011</strong> and the<br />
remaining 10,960 shares will be vested in year 2012/2013.<br />
iv. For this period, 14,500 SCM shares (1/3 of the 43,500 shares) were vested under the award to Goh Geok Ling on March 15, <strong>2011</strong> and<br />
the remaining 29,000 shares will be vested in year 2012/2013.<br />
v. For this period, 2,800 SCI shares (1/3 of the 8,400 shares) were vested under the award to Evert Henkes on March 23, <strong>2011</strong> and the<br />
remaining 5,600 shares will be vested in year 2012/2013.<br />
vi. For this period, 4,400 SCI shares (1/3 of the 13,200 shares) were vested under the award to Bobby Chin Yoke Choong on March 23,<br />
<strong>2011</strong> and the remaining 8,800 shares will be vested in year 2012/2013.<br />
Note 4: Shares were fully vested and released under the award on April 8, <strong>2011</strong>.<br />
Note 5: Shares were fully vested and released under the award on April 19, <strong>2011</strong>.<br />
Note 6: Fixed Rate Notes issued under the S$1.5 Billion Multicurrency Medium Term Note Programme of <strong>Sembcorp</strong> Financial Services Pte Ltd, a related<br />
company of <strong>Sembcorp</strong> <strong>Industries</strong> Group.<br />
118 SEMBCORP INDUSTRIES ANNUAL REPORT <strong>2011</strong><br />
GROWING SUSTAINABLE BUSINESSES 119
DIRECTORS’ REPORT<br />
Year Ended December 31, <strong>2011</strong><br />
Directors’ Interests (cont’d)<br />
Except as disclosed in this report, no director who held office at the end of the financial year had interests in shares,<br />
debentures, warrants or share options of the Company, or of related corporations, either at the beginning of the financial<br />
year, or date of appointment if later, or at the end of the financial year.<br />
Except as disclosed under the “Share-based Incentive Plans” section of this report, neither at the end of, nor at any time<br />
during the financial year, was the Company a party to any arrangement whose objects are, or one of whose objects is,<br />
to enable the directors of the Company to acquire benefits by means of the acquisition of shares in or debentures of the<br />
Company or any other body corporate.<br />
Except as disclosed in Notes 35(b) and 40 to the financial statements, since the end of the last financial year, no director has<br />
received or become entitled to receive, a benefit by reason of a contract made by the Company or a related corporation<br />
with the director, or with a firm of which he is a member, or with a company in which he has a substantial financial interest.<br />
Share-based Incentive Plans<br />
The Company’s Performance Share Plan (SCI PSP 2010) and Restricted Share Plan (SCI RSP 2010) (collectively, the “2010<br />
Share Plans”) were approved and adopted by the shareholders at an Extraordinary General Meeting of the Company held<br />
on April 22, 2010. The 2010 Share Plans replaced the Share Plans which were approved and adopted by the shareholders at<br />
an Extraordinary General Meeting of the Company held on June 5, 2000 and expired in 2010.<br />
The Executive Resource & Compensation Committee (the “Committee”) of the Company has been designated as the<br />
Committee responsible for the administration of the Share Plans. The Committee comprises the following members, all of<br />
whom are directors:<br />
Ang Kong Hua (Chairman)<br />
Goh Geok Ling<br />
Margaret Lui<br />
The SCI RSP 2010 is the incentive scheme for directors and employees of the Group whereas the SCI PSP 2010 is aimed<br />
primarily at key executives of the Group.<br />
The 2010 Share Plans are intended to increase the Company’s flexibility and effectiveness in its continuing efforts to attract,<br />
retain and incentivise participants to higher standards of performance and encourage greater dedication and loyalty<br />
by enabling the Company to give recognition to past contributions and services; as well as motivating participants to<br />
contribute to the long-term prosperity of the Group. The 2010 Share Plans will strengthen the Company’s competitiveness<br />
in attracting and retaining talented key senior management and senior executives.<br />
The SCI RSP 2010 is intended to apply to a broad base of senior executives as well as to the non-executive directors, while<br />
the SCI PSP 2010 is intended to apply to a select group of key senior management. Generally, it is envisaged that the range<br />
of performance targets to be set under the SCI RSP 2010 and the SCI PSP 2010 will be different, with the latter emphasising<br />
stretched or strategic targets aimed at sustaining longer term growth.<br />
Share-based Incentive Plans (cont’d)<br />
The 2010 Share Plans use methods fairly common among major local and multinational companies to incentivise and<br />
motivate key senior management and senior executives to achieve pre-determined targets which create and enhance<br />
economic value for shareholders. The Company believes that the 2010 Share Plans will be effective tools in motivating key<br />
senior management and senior executives to strive to deliver long-term shareholder value.<br />
While the 2010 Share Plans cater principally to Group executives, it is recognised that there are other persons who can<br />
make significant contributions to the Group through their close working relationship with the Group. Such persons include<br />
employees of associated companies over which the Company has operational control.<br />
A participant’s awards under the 2010 Share Plans will be determined at the sole discretion of the Committee. In considering<br />
an award to be granted to a participant, the Committee may take into account, inter alia, the participant’s performance<br />
during the relevant period, and his capability, entrepreneurship, scope of responsibility and skill set.<br />
Other information regarding the 2010 Share Plans and expired Share Plans is as follows:<br />
a. Share Option Plan<br />
Under the rules of the Share Option Plan, participants who ceased to be employed by the Group or the associated<br />
company by reason of ill health, injury or disability, redundancy, retirement at or after the legal retirement age,<br />
retirement before the legal retirement age, death, etc., or any other event approved by the Committee, may be<br />
allowed by the Committee to retain their unexercised options. The Committee may determine the number of shares<br />
comprised in that option which may be exercised and the period during which such option shall be exercisable, being<br />
a period not later than the expiry of the exercise period in respect of that option. Such option may be exercised at<br />
any time notwithstanding that the date of exercise of such option falls on a date prior to the first day of the exercise<br />
period in respect of such option.<br />
Other information regarding the Share Option Plans is as follows:<br />
i. The exercise price of the options can be set at market price or a discount to the market price not exceeding 20% of<br />
the market price in respect of options granted at the time of grant. Market price is the volume-weighted average<br />
price for the shares on the Singapore Exchange Securities Trading Limited (SGX-ST) over the three consecutive trading<br />
days prior to grant date of that option. For all options granted to date, the exercise prices are set at market price.<br />
ii. After the first 12 months of lock-out period, the Group imposed a further vesting of 4 years for managers and<br />
above for retention purposes.<br />
iii. In <strong>2011</strong> and 2010, all options were settled by the issuance of treasury shares.<br />
iv. The options granted expire after 5 years for non-executive directors and associated company’s employees, and 10<br />
years for the employees of the Group. There are no outstanding share options for non-executive directors.<br />
The 2010 Share Plans will provide incentives to high performing key senior management and senior executives to excel<br />
in their performance and encourage greater dedication and loyalty to the Company. Through the 2010 Share Plans, the<br />
Company will be able to motivate key senior management and senior executives to continue to strive for the Group’s longterm<br />
shareholder value. In addition, the 2010 Share Plans aim to foster a greater ownership culture within the Group which<br />
align the interests of participants with the interests of shareholders, and to improve performance and achieve sustainable<br />
growth for the Company in the changing business environment.<br />
120 SEMBCORP INDUSTRIES ANNUAL REPORT <strong>2011</strong><br />
GROWING SUSTAINABLE BUSINESSES 121
DIRECTORS’ REPORT<br />
Year Ended December 31, <strong>2011</strong><br />
Share-based Incentive Plans (cont’d)<br />
a. Share Option Plan (cont’d)<br />
v. <strong>Sembcorp</strong> <strong>Industries</strong> Ltd Share Option Plan<br />
At the end of the financial year, details of the options granted under the Share Option Plan on unissued ordinary<br />
shares of the Company are as follows:<br />
<strong>Sembcorp</strong> <strong>Industries</strong> Ltd<br />
Ordinary shares<br />
<strong>2011</strong><br />
Options Options Options Options Options<br />
Exercise outstanding cancelled / outstanding exercisable exercisable<br />
Date of grant price at Options lapsed / at at at<br />
of options per share Jan 1, <strong>2011</strong> exercised not accepted Dec 31, <strong>2011</strong> Jan 1, <strong>2011</strong> Dec 31, <strong>2011</strong> Exercise period<br />
19/04/2001 S$1.19 111,100 (81,100) (30,000) – 111,100 – 20/04/2002 to 19/04/<strong>2011</strong><br />
07/05/2002 S$1.23 160,750 (3,500) – 157,250 160,750 157,250 08/05/2003 to 07/05/2012<br />
17/10/2002 S$0.62 87,000 (34,500) – 52,500 87,000 52,500 18/10/2003 to 17/10/2012<br />
02/06/2003 S$0.78 97,600 (65,475) (1,125) 31,000 97,600 31,000 03/06/2004 to 02/06/2013<br />
18/11/2003 S$0.93 111,375 (37,375) (2,000) 72,000 111,375 72,000 19/11/2004 to 18/11/2013<br />
17/05/2004 S$0.99 206,750 (29,000) (3,500) 174,250 206,750 174,250 18/05/2005 to 17/05/2014<br />
22/11/2004 S$1.16 225,000 (44,250) (2,125) 178,625 225,000 178,625 23/11/2005 to 22/11/2014<br />
01/07/2005 S$2.37 792,700 (391,175) (17,875) 383,650 792,700 383,650 02/07/2006 to 01/07/2015<br />
21/11/2005 S$2.36 891,474 (222,349) (23,125) 646,000 891,474 646,000 22/11/2006 to 21/11/2015<br />
09/06/2006 S$2.52 175,000 (175,000) – – 175,000 – 10/06/2007 to 09/06/<strong>2011</strong><br />
09/06/2006 S$2.52 1,735,790 (519,376) (25,750) 1,190,664 1,735,790 1,190,664 10/06/2007 to 09/06/2016<br />
4,594,539 (1,603,100) (105,500) 2,885,939 4,594,539 2,885,939<br />
<strong>Sembcorp</strong> <strong>Industries</strong> Ltd<br />
Ordinary shares<br />
2010<br />
Options Options Options Options Options<br />
Exercise outstanding cancelled / outstanding exercisable exercisable<br />
Date of grant price at Options lapsed / at at at<br />
of options per share Jan 1, 2010 exercised not accepted Dec 31, 2010 Jan 1, 2010 Dec 31, 2010 Exercise period<br />
26/06/2000 S$1.63 188,723 (127,523) (61,200) – 188,723 – 27/06/2001 to 26/06/2010<br />
19/04/2001 S$1.19 122,750 (11,650) – 111,100 122,750 111,100 20/04/2002 to 19/04/<strong>2011</strong><br />
07/05/2002 S$1.23 189,125 (28,375) – 160,750 189,125 160,750 08/05/2003 to 07/05/2012<br />
17/10/2002 S$0.62 91,250 (4,250) – 87,000 91,250 87,000 18/10/2003 to 17/10/2012<br />
02/06/2003 S$0.78 105,225 (6,625) (1,000) 97,600 105,225 97,600 03/06/2004 to 02/06/2013<br />
18/11/2003 S$0.93 130,125 (18,750) – 111,375 130,125 111,375 19/11/2004 to 18/11/2013<br />
17/05/2004 S$0.99 292,275 (84,525) (1,000) 206,750 292,275 206,750 18/05/2005 to 17/05/2014<br />
22/11/2004 S$1.16 376,275 (148,275) (3,000) 225,000 376,275 225,000 23/11/2005 to 22/11/2014<br />
01/07/2005 S$2.37 91,875 (91,875) – – 91,875 – 02/07/2006 to 01/07/2010<br />
01/07/2005 S$2.37 1,316,952 (513,752) (10,500) 792,700 1,316,952 792,700 02/07/2006 to 01/07/2015<br />
21/11/2005 S$2.36 135,625 (135,625) – – 135,625 – 22/11/2006 to 21/11/2010<br />
21/11/2005 S$2.36 1,550,076 (645,602) (13,000) 891,474 1,550,076 891,474 22/11/2006 to 21/11/2015<br />
09/06/2006 S$2.52 385,000 (210,000) – 175,000 271,250 175,000 10/06/2007 to 09/06/<strong>2011</strong><br />
09/06/2006 S$2.52 2,742,135 (974,595) (31,750) 1,735,790 1,955,385 1,735,790 10/06/2007 to 09/06/2016<br />
7,717,411 (3,001,422) (121,450) 4,594,539 6,816,911 4,594,539<br />
Share-based Incentive Plans (cont’d)<br />
a. Share Option Plan (cont’d)<br />
v. <strong>Sembcorp</strong> <strong>Industries</strong> Ltd Share Option Plan (cont’d)<br />
The details of options of the Company awarded / exercised since commencement of the Scheme (aggregate) to<br />
December 31, <strong>2011</strong> are as follows:<br />
Aggregate<br />
options<br />
Aggregate cancelled / Aggregate Aggregate<br />
options lapsed / options options<br />
Option participants granted not accepted exercised outstanding<br />
Directors<br />
Ang Kong Hua – – – –<br />
Tang Kin Fei 3,444,052 (607,759) 1 (2,386,293) 450,000<br />
Goh Geok Ling 370,000 – (370,000) –<br />
Evert Henkes 94,000 – (94,000) –<br />
Bobby Chin Yoke Choong – – – –<br />
Margaret Lui – – – –<br />
Tan Sri Mohd Hassan Marican – – – –<br />
Tham Kui Seng – – – –<br />
Other executives<br />
Group 149,771,742 (69,253,288) (78,088,515) 2,429,939<br />
Associated company 748,600 (215,100) (533,500) –<br />
Parent Group 2 378,500 (107,000) (265,500) 6,000<br />
Former directors of the Company 10,641,578 (2,383,328) (8,258,250) –<br />
Total 165,448,472 (72,566,475) (89,996,058) 2,885,939<br />
1. Options lapsed due to replacement of 1999 options and expiry of earlier options.<br />
2. Parent Group refers to former employees of Singapore Technologies Pte Ltd. No options were granted to former employees of Singapore<br />
Technologies Pte Ltd since 2005.<br />
Since the commencement of the Share Option Plan, no options have been granted to the controlling shareholders<br />
of the Company or their associates. No participant under the Share Option Plan has been granted 5% or more of<br />
the total options available. No options have been offered at a discount.<br />
The options granted by the Company do not entitle the holders of the options, by virtue of such holdings, to any<br />
right to participate in any share issue of any company.<br />
122 SEMBCORP INDUSTRIES ANNUAL REPORT <strong>2011</strong><br />
GROWING SUSTAINABLE BUSINESSES 123
DIRECTORS’ REPORT<br />
Year Ended December 31, <strong>2011</strong><br />
Share-based Incentive Plans (cont’d)<br />
a. Share Option Plan (cont’d)<br />
vi. Share options of a listed subsidiary<br />
At the end of the financial year, details of the options granted under the Share Option Plan on unissued ordinary<br />
shares of <strong>Sembcorp</strong> Marine Ltd are as follows:<br />
<strong>Sembcorp</strong> Marine Ltd<br />
Ordinary shares<br />
<strong>2011</strong><br />
Options Options Options Options Options<br />
Exercise outstanding cancelled / outstanding exercisable exercisable<br />
Date of grant price at Options lapsed / at at at<br />
of options per share Jan 1, <strong>2011</strong> exercised not accepted Dec 31, <strong>2011</strong> Jan 1, <strong>2011</strong> Dec 31, <strong>2011</strong> Exercise period<br />
27/09/2001 S$0.47 54,810 (21,210) (33,600) – 54,810 – 28/09/2002 to 27/09/<strong>2011</strong><br />
07/11/2002 S$0.64 161,700 (31,500) (4,550) 125,650 161,700 125,650 08/11/2003 to 07/11/2012<br />
08/08/2003 S$0.71 216,470 (132,200) (10,850) 73,420 216,470 73,420 09/08/2004 to 08/08/2013<br />
10/08/2004 S$0.74 1,723,958 (1,427,648) (55,300) 241,010 1,723,958 241,010 11/08/2005 to 10/08/2014<br />
11/08/2005 S$2.11 4,213,877 (2,617,027) (93,100) 1,503,750 4,213,877 1,503,750 12/08/2006 to 11/08/2015<br />
02/10/2006 S$2.38 191,750 (191,750) – – 191,750 – 03/10/2007 to 02/10/<strong>2011</strong> *<br />
02/10/2006 S$2.38 4,918,409 (3,046,002) (15,925) 1,856,482 4,918,409 1,856,482 03/10/2007 to 02/10/2016<br />
11,480,974 (7,467,337) (213,325) 3,800,312 11,480,974 3,800,312<br />
* Applicable to non-executive directors of the Company only.<br />
<strong>Sembcorp</strong> Marine Ltd<br />
Ordinary shares<br />
2010<br />
Options Options Options Options Options<br />
Exercise outstanding cancelled / outstanding exercisable exercisable<br />
Date of grant price at Options lapsed / at at at<br />
of options per share Jan 1, 2010 exercised not accepted Dec 31, 2010 Jan 1, 2010 Dec 31, 2010 Exercise period<br />
08/09/2000 S$0.50 191,170 (53,890) (137,280) – 191,170 – 08/09/2001 to 07/09/2010<br />
27/09/2001 S$0.47 99,610 (42,000) (2,800) 54,810 99,610 54,810 28/09/2002 to 27/09/<strong>2011</strong><br />
07/11/2002 S$0.64 308,450 (142,550) (4,200) 161,700 308,450 161,700 08/11/2003 to 07/11/2012<br />
08/08/2003 S$0.71 878,220 (661,550) (200) 216,470 878,220 216,470 09/08/2004 to 08/08/2013<br />
10/08/2004 S$0.74 2,598,278 (868,920) (5,400) 1,723,958 2,598,278 1,723,958 11/08/2005 to 10/08/2014<br />
11/08/2005 S$2.11 203,000 (203,000) – – 203,000 – 12/08/2006 to 11/08/2010 *<br />
11/08/2005 S$2.11 7,035,787 (2,790,560) (31,350) 4,213,877 7,035,787 4,213,877 12/08/2006 to 11/08/2015<br />
02/10/2006 S$2.38 588,000 (396,250) – 191,750 453,250 191,750 03/10/2007 to 02/10/<strong>2011</strong> *<br />
02/10/2006 S$2.38 8,335,653 (3,311,179) (106,065) 4,918,409 5,774,379 4,918,409 03/10/2007 to 02/10/2016<br />
20,238,168 (8,469,899) (287,295) 11,480,974 17,542,144 11,480,974<br />
* Applicable to non-executive directors of the Company only.<br />
Share-based Incentive Plans (cont’d)<br />
b. Performance Share Plan<br />
Under the Performance Share Plan (SCI PSP 2010), the awards granted conditional on performance targets are set<br />
based on medium-term corporate objectives at the start of each rolling three-year performance qualifying period. A<br />
specific number of performance shares shall be awarded at the end of the three-year performance cycle depending on<br />
the extent of the achievement of the performance conditions established at the onset.<br />
The performance levels were calibrated based on Wealth Added and Total Shareholder Return. A minimum threshold<br />
performance must be achieved to trigger an achievement factor, which in turn determines the number of shares to be<br />
finally awarded. Performance shares to be delivered will range between 0% to 150% of the conditional performance<br />
shares awarded.<br />
To create alignment between senior management and other employees at the time of vesting, SCI PSP 2010 has in place<br />
a plan trigger. Under this trigger mechanism, the performance shares for the performance period <strong>2011</strong> to 2013 will be<br />
vested to the senior management participants only if the restricted shares for the performance period 2012 to 2013 are<br />
vested, subject to the achievement of the performance conditions for the respective performance periods.<br />
Senior management participants are required to hold a minimum percentage of the shares released to them under the<br />
Performance Share Plan to maintain a beneficial ownership stake in the Group, for the duration of their employment<br />
or tenure with the Group. A maximum cap is set based on a multiple of the individual participant’s annual base salary.<br />
Any excess can be sold off, but in the event of a shortfall, they have a two calendar year period to meet the minimum<br />
percentage requirement.<br />
i. <strong>Sembcorp</strong> <strong>Industries</strong> Ltd Performance Shares<br />
The details of the movement of the performance shares of <strong>Sembcorp</strong> <strong>Industries</strong> Ltd awarded during the financial<br />
year since commencement of the Performance Share Plan (aggregate) are as follows:<br />
Movements during the year<br />
Conditional Conditional Conditional<br />
performance performance performance<br />
Performance shares participants At Jan 1 shares awarded shares released shares lapsed At Dec 31<br />
<strong>2011</strong><br />
Director of the Company:<br />
Tang Kin Fei 1,200,000 400,000 (300,000) (100,000) 1,200,000<br />
Key executives of the Group 1,411,665 420,000 (292,500) (105,832) 1,433,333<br />
2,611,665 820,000 (592,500) (205,832) 2,633,333<br />
2010<br />
Director of the Company:<br />
Tang Kin Fei 1,208,240 400,000 (142,884) (265,356) 1,200,000<br />
Key executives of the Group 1,432,622 600,000 (124,735) (496,222) 1,411,665<br />
2,640,862 1,000,000 (267,619) (761,578) 2,611,665<br />
With the Committee’s approval on the achievement factor for the achievement of the performance targets for<br />
the performance period 2008 to 2010 (2010: performance period 2007 to 2009), a total of 592,500 (2010: 267,619)<br />
performance shares were released via the issuance of treasury shares.<br />
The total number of performance shares in awards granted conditionally and representing 100% of targets to be<br />
achieved, but not released as at end <strong>2011</strong>, was 2,633,333 (2010: 2,611,665). Based on the multiplying factor, the actual<br />
release of the awards could range from zero to a maximum of 3,950,000 (2010: 3,917,498) performance shares.<br />
124 SEMBCORP INDUSTRIES ANNUAL REPORT <strong>2011</strong><br />
GROWING SUSTAINABLE BUSINESSES 125
DIRECTORS’ REPORT<br />
Year Ended December 31, <strong>2011</strong><br />
Share-based Incentive Plans (cont’d)<br />
b. Performance Share Plan (cont’d)<br />
ii. Performance shares of a listed subsidiary<br />
The details of the movement of the performance shares of <strong>Sembcorp</strong> Marine Ltd awarded during the year are as<br />
follows:<br />
<strong>2011</strong> 2010<br />
At January 1 1,970,000 2,315,000<br />
Conditional performance shares awarded 585,000 635,000<br />
Conditional performance shares lapsed (242,916) –<br />
Additional performance shares awarded arising from targets met 385,000 235,200<br />
Conditional performance shares released (932,084) (1,215,200)<br />
At December 31 1,765,000 1,970,000<br />
No performance shares of <strong>Sembcorp</strong> Marine Ltd were awarded to the directors of the Company.<br />
With the <strong>Sembcorp</strong> Marine Ltd’s committee’s approval on the achievement factor for the achievement of the<br />
performance targets for the performance period 2008 to 2010 (2010: performance period 2007 to 2009), a total of<br />
932,084 (2010: 1,215,200) performance shares were released via the issuance of treasury shares.<br />
In <strong>2011</strong>, there were additional 385,000 (2010: 235,200) performance shares awarded for over-achievement of the<br />
performance targets for the performance period 2008 to 2010 (2010: performance period 2007 to 2009).<br />
The total number of performance shares in awards granted conditionally and representing 100% of targets to be<br />
achieved, but not released as at December 31, <strong>2011</strong>, was 1,765,000 (2010: 1,970,000). Based on the multiplying<br />
factor, the actual release of the awards could range from zero to a maximum of 2,647,500 (2010: 2,955,000)<br />
performance shares.<br />
c. Restricted Share Plan<br />
Under the Restricted Share Plan (SCI RSP 2010), the awards granted conditional on performance targets are set based<br />
on corporate objectives at the start of each rolling two-year performance qualifying period. The performance criteria<br />
for the restricted shares are calibrated based on Return on Total Assets (excluding <strong>Sembcorp</strong> Marine Ltd) and Group<br />
Profit from Operations (excluding <strong>Sembcorp</strong> Marine Ltd) for awards granted in <strong>2011</strong>.<br />
A minimum threshold performance must be achieved to trigger an achievement factor, which in turn determines the<br />
number of shares to be finally awarded. Based on the criteria, restricted shares to be delivered will range from 0% to<br />
150% of the conditional restricted shares awarded.<br />
The managerial participants of the Group will be awarded restricted shares under SCI RSP 2010, while the nonmanagerial<br />
participants of the Group will receive their awards in an equivalent cash value. This cash-settled notional<br />
restricted shares award for non-managerial participants is known as the <strong>Sembcorp</strong> Challenge Bonus.<br />
A specific number of restricted shares shall be awarded at the end of the two-year performance cycle depending on<br />
the extent of the achievement of the performance conditions established at the onset. There is a further vesting period<br />
of three years after the performance period, during which one-third of the awarded shares are released each year to<br />
managerial participants. Non-managerial participants will receive the equivalent in cash at the end of the two-year<br />
performance cycle, with no further vesting conditions.<br />
126 SEMBCORP INDUSTRIES ANNUAL REPORT <strong>2011</strong><br />
Share-based Incentive Plans (cont’d)<br />
c. Restricted Share Plan (cont’d)<br />
Senior management participants are required to hold a minimum percentage of the shares released to them under the<br />
Restricted Share Plan to maintain a beneficial ownership stake in the Group, for the duration of their employment or<br />
tenure with the Group. A maximum cap is set based on a multiple of the individual participant’s annual base salary.<br />
Any excess can be sold off, but in the event of a shortfall, they have a two calendar year period to meet the minimum<br />
percentage requirement.<br />
For the year 2010, the awards granted under the SCI RSP 2010 to non-executive directors were time-based shares which<br />
vest 1 year from the date of grant.<br />
To align the interests of the non-executive directors with the interests of shareholders, up to 30% of the aggregate<br />
directors’ fees approved by shareholders for a particular financial year may be paid out in the form of restricted share<br />
awards under the SCI RSP 2010.<br />
For year <strong>2011</strong>, non-executive directors were not awarded any shares except as part of their directors’ fees (except for<br />
Mr Tang Kin Fei, who is the Group President & CEO, and who does not receive any directors’ fees). The awards granted<br />
will consist of the grant of fully paid shares outright with no performance and vesting conditions attached, but with<br />
a selling moratorium. Non-executive directors are required to hold shares (including shares obtained by other means)<br />
worth at least one-time the annual base retainer; any excess may be sold as desired. A non-executive director can<br />
dispose of all of his shares one year after leaving the Board.<br />
The actual number of shares to be awarded to each non-executive director will be determined by reference to the<br />
volume-weighted average price of a share on the SGX-ST over the 14 trading days immediately following the date<br />
of the <strong>Annual</strong> General Meeting (AGM). The number of shares to be awarded will be rounded down to the nearest<br />
hundred and any residual balance will be settled in cash.<br />
i. <strong>Sembcorp</strong> <strong>Industries</strong> Ltd Restricted Shares<br />
The details of the movement of the restricted shares of <strong>Sembcorp</strong> <strong>Industries</strong> Ltd awarded during the year are as follows:<br />
Movements during the year<br />
Additional<br />
restricted<br />
Conditional shares awarded Conditional Conditional<br />
restricted arising from restricted restricted<br />
Restricted shares participants At Jan 1 shares awarded targets met shares released shares lapsed At Dec 31<br />
<strong>2011</strong><br />
Directors of the Company:<br />
Ang Kong Hua 20,300 – – (20,300) – –<br />
Tang Kin Fei 362,181 126,000 25,200 (119,421) – 393,960<br />
Goh Geok Ling 39,378 – 2,740 (26,684) – 15,434<br />
Evert Henkes 20,121 – 1,400 (13,635) – 7,886<br />
Bobby Chin Yoke Choong 22,000 – 2,200 (15,400) – 8,800<br />
Margaret Lui – – – – – –<br />
Tan Sri Mohd Hassan Marican – – – – – –<br />
Tham Kui Seng – – – – – –<br />
Former directors of<br />
the Company 88,242 – 6,140 (94,382) – –<br />
Other executives of<br />
the Group 4,963,224 2,179,800 361,880 (1,492,987) (267,668) 5,744,249<br />
5,515,446 2,305,800 399,560 (1,782,809) (267,668) 6,170,329<br />
GROWING SUSTAINABLE BUSINESSES 127
DIRECTORS’ REPORT<br />
Year Ended December 31, <strong>2011</strong><br />
Share-based Incentive Plans (cont’d)<br />
c. Restricted Share Plan (cont’d)<br />
i. <strong>Sembcorp</strong> <strong>Industries</strong> Ltd Restricted Shares (cont’d)<br />
Movements during the year<br />
Additional<br />
restricted<br />
Conditional shares awarded Conditional Conditional<br />
restricted arising from restricted restricted<br />
Restricted shares participants At Jan 1 shares awarded targets met shares released shares lapsed At Dec 31<br />
2010<br />
Directors of the Company:<br />
Ang Kong Hua – 20,300 – – – 20,300<br />
Tang Kin Fei 338,138 126,000 – (99,437) (2,520) 362,181<br />
Goh Geok Ling 33,458 13,700 – (7,506) (274) 39,378<br />
Richard Hale, OBE 41,518 17,000 – (9,314) (340) 48,864<br />
Evert Henkes 17,096 7,000 – (3,835) (140) 20,121<br />
Lee Suet Fern 33,458 13,700 – (7,506) (274) 39,378<br />
Bobby Chin Yoke Choong 11,000 11,000 – – – 22,000<br />
Margaret Lui – – – – – –<br />
Tan Sri Mohd Hassan Marican – – – – – –<br />
Former director of<br />
the Company 57,393 13,725 – (70,648) (470) –<br />
Other executives of<br />
the Group 4,506,785 2,046,075 – (1,263,026) (326,610) 4,963,224<br />
5,038,846 2,268,500 – (1,461,272) (330,628) 5,515,446<br />
With the Committee’s approval on the achievement factor for the achievement of the performance targets for the<br />
performance period 2009 to 2010, a total of 872,309 restricted shares were released in <strong>2011</strong>. For awards in relation<br />
to the performance period 2008 to 2009, a total of 548,312 (2010: 736,370) restricted shares were released in<br />
<strong>2011</strong>. For awards in relation to the performance period 2007 to 2008, a total of 279,488 (2010: 359,706) restricted<br />
shares were released in <strong>2011</strong>. For awards in relation to the performance period 2006 to 2007, nil (2010: 311,950)<br />
restricted shares were released in <strong>2011</strong>. In <strong>2011</strong>, there were 82,700 shares released to non-executive directors. In<br />
2010, there were additional 53,246 restricted shares released to employees upon retirement. The restricted shares<br />
were released via the issuance of treasury shares.<br />
In <strong>2011</strong>, additional 399,560 (2010: nil) restricted shares were awarded for the over-achievement of the performance<br />
targets for the performance period 2009 to 2010 (2010: performance period 2008 to 2009).<br />
The total number of restricted shares outstanding, including award(s) achieved but not released, as at end <strong>2011</strong>,<br />
was 6,170,329 (2010: 5,515,446). Of this, the total number of restricted shares in awards granted conditionally<br />
and representing 100% of targets to be achieved, but not released was 4,244,200 (2010: 4,097,300). Based on the<br />
multiplying factor, the actual release of the conditional awards could range from zero to a maximum of 6,366,300<br />
(2010: 6,145,950) restricted shares.<br />
128 SEMBCORP INDUSTRIES ANNUAL REPORT <strong>2011</strong><br />
Share-based Incentive Plans (cont’d)<br />
c. Restricted Share Plan (cont’d)<br />
i. <strong>Sembcorp</strong> <strong>Industries</strong> Ltd Restricted Shares (cont’d)<br />
<strong>Sembcorp</strong> Challenge Bonus<br />
With the Committee’s approval on the achievement factor for the achievement of the performance targets for the<br />
performance period 2009 to 2010 (2010: performance period 2008 to 2009), a total of S$2,661,000, equivalent to<br />
494,042 (2010: S$1,511,000, equivalent to 358,784) notional restricted shares, were paid. A total of 600,000 (2010:<br />
600,000) notional restricted shares of <strong>Sembcorp</strong> <strong>Industries</strong> Ltd’s shares were awarded in <strong>2011</strong> for the <strong>Sembcorp</strong><br />
Challenge Bonus.<br />
The total number of notional restricted shares in awards for the <strong>Sembcorp</strong> Challenge Bonus granted conditionally<br />
and representing 100% of targets to be achieved, but not released as at end <strong>2011</strong>, was 1,200,000 (2010: 1,200,000).<br />
Based on the multiplying factor, the number of notional restricted shares to be converted into the funding pool<br />
could range from zero to a maximum of 1,800,000 (2010: 1,800,000).<br />
ii. Restricted shares of a listed subsidiary<br />
The details of the movement of the restricted shares of <strong>Sembcorp</strong> Marine Ltd awarded during the year are as<br />
follows:<br />
Movements during the year<br />
Additional<br />
conditional<br />
restricted<br />
Conditional shares awarded Conditional Conditional<br />
restricted arising from restricted restricted<br />
Restricted shares participants At Jan 1 shares awarded targets met shares released shares lapsed At Dec 31<br />
<strong>2011</strong><br />
Directors of the Company:<br />
Tang Kin Fei 48,690 – 8,500 (34,190) – 23,000<br />
Goh Geok Ling 84,846 – 14,500 (59,346) – 40,000<br />
Former director of<br />
the Company 36,700 – 11,000 (25,700) – 22,000<br />
Other participants 11,210,067 3,085,800 1,607,205 (4,923,035) (914,752) 10,065,285<br />
11,380,303 3,085,800 1,641,205 (5,042,271) (914,752) 10,150,285<br />
2010<br />
Directors of the Company:<br />
Tang Kin Fei 45,380 11,500 6,000 (14,190) – 48,690<br />
Goh Geok Ling 77,693 20,500 11,000 (24,347) – 84,846<br />
Richard Hale, OBE 22,000 14,700 – – – 36,700<br />
Other participants 10,261,889 3,447,500 1,658,250 (3,890,418) (267,154) 11,210,067<br />
10,406,962 3,494,200 1,675,250 (3,928,955) (267,154) 11,380,303<br />
With the <strong>Sembcorp</strong> Marine Ltd’s committee’s approval on the achievement factor for the achievement of the<br />
performance targets for the performance period 2009 to 2010, a total of 1,888,581 restricted shares were released<br />
in <strong>2011</strong>. For awards in relation to the performance period 2008 to 2009, a total of 1,531,500 (2010: 1,791,238)<br />
restricted shares were released in <strong>2011</strong>. For awards in relation to the performance period 2007 to 2008, a total<br />
of 1,502,177 (2010: 1,561,953) restricted shares were released in <strong>2011</strong>. For awards in relation to the performance<br />
period 2006 to 2007, a total of 16,413 (2010: 575,764) restricted shares were released in <strong>2011</strong>. In <strong>2011</strong>, there were<br />
103,600 restricted shares released to non-executive directors. The restricted shares were either released via the<br />
issuance of treasury shares or the issuance of new shares.<br />
GROWING SUSTAINABLE BUSINESSES 129
DIRECTORS’ REPORT<br />
Year Ended December 31, <strong>2011</strong><br />
Share-based Incentive Plans (cont’d)<br />
c. Restricted Share Plan (cont’d)<br />
ii. Restricted shares of a listed subsidiary (cont’d)<br />
In <strong>2011</strong>, additional 1,641,205 (2010: 1,675,250) <strong>Sembcorp</strong> Marine Ltd’s restricted shares were awarded for the<br />
over-achievement of the performance targets for the performance period 2009 to 2010 (2010: performance period<br />
2008 to 2009).<br />
Audit Committee (cont’d)<br />
The total number of <strong>Sembcorp</strong> Marine Ltd’s restricted shares outstanding, including awards achieved but not<br />
released, as at December 31, <strong>2011</strong>, was 10,150,285 (2010: 11,380,303). Of this, the total number of restricted shares<br />
in awards granted conditionally and representing 100% of targets to be achieved, but not released was 6,242,400<br />
(2010: 6,615,930). Based on the multiplying factor, the actual release of the awards could range from zero to a<br />
maximum of 9,363,600 (2010: 9,923,895) restricted shares.<br />
Challenge Bonus of a listed subsidiary<br />
With the <strong>Sembcorp</strong> Marine Ltd’s committee’s approval on the achievement factor for the achievement of the<br />
performance targets for the performance period 2009 to 2010 (2010: performance period 2008 to 2009), a total of<br />
S$7,336,725 (2010: S$3,785,714), equivalent to 1,373,250 (2010: 1,030,600) notional restricted shares, were paid.<br />
A total of 1,122,200 (2010: 1,234,400) notional restricted shares were awarded on July 15, <strong>2011</strong> (2010: April 19,<br />
2010) for the <strong>Sembcorp</strong> Marine Challenge Bonus.<br />
The total number of notional restricted shares in awards for the <strong>Sembcorp</strong> Marine Challenge Bonus granted<br />
conditionally and representing 100% of targets to be achieved, but not released as at December 31, <strong>2011</strong>, was<br />
2,167,200 (2010: 2,149,950). Based on the multiplying factor, the number of notional restricted shares to be<br />
converted into the funding pool could range from zero to a maximum of 3,250,800 (2010: 3,224,925).<br />
On behalf of the Board of Directors<br />
Ang Kong Hua<br />
Chairman<br />
Singapore<br />
d. Maximum Number of Shares Issuable<br />
February 27, 2012<br />
The maximum number of performance shares and restricted shares which could be delivered, when aggregated with<br />
the number of new shares issued and issuable in respect of all options granted, is within the 15% limit of the share<br />
capital of the Company on the day preceding the relevant date of the grant.<br />
Audit Committee<br />
The members of the Audit Committee during the year and at the date of this report are:<br />
Bobby Chin Yoke Choong (Chairman)<br />
Tan Sri Mohd Hassan Marican<br />
Evert Henkes<br />
The Audit Committee held four meetings during the financial year. In performing its functions, the Audit Committee met<br />
with the Company’s external and internal auditors to discuss the scope of their work, the results of their examination and<br />
their evaluation of the Company’s internal accounting control system.<br />
The Audit Committee performed the functions specified in Section 201B of the Singapore Companies Act, Chapter 50, the<br />
Listing Manual of the Singapore Exchange, and the Code of Corporate Governance.<br />
The Audit Committee also reviewed the following:<br />
• assistance provided by the Company’s officers to the external and internal auditors;<br />
• quarterly financial information and annual financial statements of the Group and the Company prior to their submission<br />
to the directors of the Company for adoption; and<br />
The Audit Committee has full access to the management and is given the resources required for it to discharge its functions.<br />
It has full authority and the discretion to invite any director or executive officer to attend its meetings. The Audit Committee<br />
also recommends the appointment of the external auditors and reviews the level of audit and non-audit fees.<br />
The Audit Committee is satisfied with the independence and objectivity of the external auditors and has recommended<br />
to the Board of Directors that the auditors, KPMG LLP, be nominated for re-appointment as auditors at the forthcoming<br />
<strong>Annual</strong> General Meeting of the Company.<br />
Auditors<br />
The auditors, KPMG LLP, have indicated their willingness to accept re-appointment.<br />
Tang Kin Fei<br />
Director<br />
130 SEMBCORP INDUSTRIES ANNUAL REPORT <strong>2011</strong><br />
GROWING SUSTAINABLE BUSINESSES 131
STATEMENT BY DIRECTORS<br />
Year Ended December 31, <strong>2011</strong><br />
INDEPENDENT AUDITORS’ REPORT<br />
Year Ended December 31, <strong>2011</strong><br />
In our opinion:<br />
a. the financial statements set out on pages 134 to 259 are drawn up so as to give a true and fair view of the state of<br />
affairs of the Group and of the Company as at December 31, <strong>2011</strong>, and the results, changes in equity and cash flows of<br />
the Group for the year ended on that date in accordance with the provisions of the Singapore Companies Act, Chapter<br />
50 and Singapore Financial <strong>Report</strong>ing Standards; and<br />
b. at the date of this statement, there are reasonable grounds to believe that the Company will be able to pay its debts<br />
as and when they fall due.<br />
The Board of Directors has, on the date of this statement, authorised these financial statements for issue.<br />
On behalf of the Board of Directors<br />
Independent Auditors’ <strong>Report</strong><br />
Members of the Company<br />
<strong>Sembcorp</strong> <strong>Industries</strong> Ltd<br />
<strong>Report</strong> on the financial statements<br />
We have audited the accompanying financial statements of <strong>Sembcorp</strong> <strong>Industries</strong> Ltd (the “Company”) and its subsidiaries (the<br />
“Group”), which comprise the balance sheets of the Group and the Company as at December 31, <strong>2011</strong>, the income statement,<br />
statement of comprehensive income, statement of changes in equity and statement of cash flows of the Group for the year then<br />
ended, and a summary of significant accounting policies and other explanatory information, as set out on pages 134 to 259.<br />
Management’s responsibility for the financial statements<br />
Management is responsible for the preparation of financial statements that give a true and fair view in accordance with<br />
the provisions of the Singapore Companies Act, Chapter 50 (the “Act”) and Singapore Financial <strong>Report</strong>ing Standards, and<br />
for devising and maintaining a system of internal accounting controls sufficient to provide a reasonable assurance that<br />
assets are safeguarded against loss from unauthorised use or disposition; and transactions are properly authorised and that<br />
they are recorded as necessary to permit the preparation of true and fair profit and loss accounts and balance sheets and<br />
to maintain accountability of assets.<br />
Ang Kong Hua<br />
Chairman<br />
Singapore<br />
February 27, 2012<br />
Tang Kin Fei<br />
Director<br />
Auditors’ responsibility<br />
Our responsibility is to express an opinion on these financial statements based on our audit. We conducted our audit in<br />
accordance with Singapore Standards on Auditing. Those standards require that we comply with ethical requirements and<br />
plan and perform the audit to obtain reasonable assurance about whether the financial statements are free from material<br />
misstatement.<br />
An audit involves performing procedures to obtain audit evidence about the amounts and disclosures in the financial<br />
statements. The procedures selected depend on the auditor’s judgement, including the assessment of the risks of material<br />
misstatement of the financial statements, whether due to fraud or error. In making those risk assessments, the auditor<br />
considers internal control relevant to the entity’s preparation of the financial statements that give a true and fair view<br />
in order to design audit procedures that are appropriate in the circumstances, but not for the purpose of expressing an<br />
opinion on the effectiveness of the entity’s internal control. An audit also includes evaluating the appropriateness of<br />
accounting policies used and the reasonableness of accounting estimates made by management, as well as evaluating the<br />
overall presentation of the financial statements.<br />
We believe that the audit evidence we have obtained is sufficient and appropriate to provide a basis for our audit opinion.<br />
Opinion<br />
In our opinion, the consolidated financial statements of the Group and the balance sheet of the Company are properly<br />
drawn up in accordance with the provisions of the Act and Singapore Financial <strong>Report</strong>ing Standards to give a true and fair<br />
view of the state of affairs of the Group and of the Company as at December 31, <strong>2011</strong>, and the results, changes in equity<br />
and cash flows of the Group for the year ended on that date.<br />
<strong>Report</strong> on other legal and regulatory requirements<br />
In our opinion, the accounting and other records required by the Act to be kept by the Company and by those subsidiaries<br />
incorporated in Singapore of which we are the auditors have been properly kept in accordance with the provisions of the Act.<br />
KPMG LLP<br />
Public Accountants and<br />
Certified Public Accountants<br />
132 SEMBCORP INDUSTRIES ANNUAL REPORT <strong>2011</strong><br />
Singapore<br />
February 27, 2012 GROWING SUSTAINABLE BUSINESSES 133
BALANCE SHEETS<br />
As at December 31, <strong>2011</strong><br />
CONSOLIDATED INCOME STATEMENT<br />
Year Ended December 31, <strong>2011</strong><br />
Group<br />
Company<br />
<strong>2011</strong> 2010 <strong>2011</strong> 2010<br />
Note S$’000 S$’000 S$’000 S$’000<br />
Equity attributable to owners of the Company:<br />
Share capital 3 565,572 571,099 565,572 571,099<br />
(Deficit) / Surplus in other reserves 5 (46,322) 156,588 (9,884) 9,869<br />
Accumulated profits 3,595,266 3,087,523 1,309,119 1,089,251<br />
4,114,516 3,815,210 1,864,807 1,670,219<br />
Non-controlling interests 1,126,144 1,205,050 – –<br />
Total equity 5,240,660 5,020,260 1,864,807 1,670,219<br />
Non-current assets<br />
Property, plant and equipment 6 4,249,575 3,438,579 450,265 453,344<br />
Investment properties 7 23,007 24,112 – –<br />
Investments in subsidiaries 8 – – 1,561,239 1,563,246<br />
Interests in associates 9 843,127 686,601 – –<br />
Interests in joint ventures 10 501,573 347,427 – –<br />
Other financial assets 11 145,280 324,929 – –<br />
Long-term receivables and prepayments 12 380,464 345,705 7,730 729<br />
Intangible assets 16 331,883 311,834 19,515 19,097<br />
Deferred tax assets 17 60,655 48,162 – –<br />
6,535,564 5,527,349 2,038,749 2,036,416<br />
Current assets<br />
Inventories and work-in-progress 18 1,078,269 915,933 9,101 7,417<br />
Trade and other receivables 19 1,090,259 760,537 100,864 70,927<br />
Tax recoverable 12,073 116,751 – 105,544<br />
Assets held for sale 21 24,437 36,813 – –<br />
Other financial assets 11 16,545 46,282 – 24<br />
Cash and cash equivalents 22 2,995,478 3,487,876 629,074 310,342<br />
5,217,061 5,364,192 739,039 494,254<br />
Current liabilities<br />
Trade and other payables 23 2,746,273 2,268,116 179,883 155,101<br />
Excess of progress billings over work-in-progress 18 355,300 664,109 – –<br />
Provisions 24 117,522 122,870 20,766 7,246<br />
Other financial liabilities 27 22,509 17,109 – –<br />
Current tax payable 269,822 343,340 17,178 –<br />
Interest-bearing borrowings 29 186,073 48,945 94 88<br />
3,697,499 3,464,489 217,921 162,435<br />
Net current assets 1,519,562 1,899,703 521,118 331,819<br />
8,055,126 7,427,052 2,559,867 2,368,235<br />
Non-current liabilities<br />
Deferred tax liabilities 17 387,651 419,539 40,349 40,535<br />
Provisions 24 37,087 38,529 593 500<br />
Other financial liabilities 27 187,325 54,608 – –<br />
Retirement benefit obligations 28 17,740 19,973 – –<br />
Interest-bearing borrowings 29 1,856,365 1,553,125 156 250<br />
Other long-term liabilities 30 328,298 321,018 653,962 656,731<br />
2,814,466 2,406,792 695,060 698,016<br />
5,240,660 5,020,260 1,864,807 1,670,219<br />
Group<br />
<strong>2011</strong> 2010<br />
Note S$’000 S$’000<br />
Turnover 32 9,047,066 8,763,614<br />
Cost of sales (7,692,621) (7,242,974)<br />
Gross profit 1,354,445 1,520,640<br />
General and administrative expenses (288,641) (341,065)<br />
Operating profit 1,065,804 1,179,575<br />
Other income 112,060 117,836<br />
Non-operating expense (net) (12,190) (29,048)<br />
Finance costs 33 (65,668) (61,129)<br />
Share of results (net of tax) of:<br />
– Associates 90,627 85,635<br />
– Joint ventures 79,946 74,460<br />
Profit before tax 1,270,579 1,367,329<br />
Tax expense 34 (124,769) (194,378)<br />
Profit for the year 35 1,145,810 1,172,951<br />
Attributable to:<br />
Shareholders of the Company 809,282 792,871<br />
Non-controlling interests 336,528 380,080<br />
Profit for the year 1,145,810 1,172,951<br />
Earnings per share (cents): 36<br />
Basic 45.32 44.44<br />
Diluted 44.98 44.11<br />
The accompanying notes form an integral part of these financial statements.<br />
134 SEMBCORP INDUSTRIES ANNUAL REPORT <strong>2011</strong><br />
The accompanying notes form an integral part of these financial statements.<br />
GROWING SUSTAINABLE BUSINESSES 135
CONSOLIDATED STATEMENT OF COMPREHENSIVE INCOME<br />
Year Ended December 31, <strong>2011</strong><br />
CONSOLIDATED STATEMENT OF CHANGES IN EQUITY<br />
Year Ended December 31, <strong>2011</strong><br />
Group<br />
<strong>2011</strong> 2010<br />
Note S$’000 S$’000<br />
Profit for the year 1,145,810 1,172,951<br />
Foreign currency translation differences for foreign operations 13,192 (131,504)<br />
Exchange differences on monetary items forming part of<br />
net investment in foreign operation (223) (3,663)<br />
Net change in fair value of cash flow hedges (114,261) (1,843)<br />
Net change in fair value of cash flow hedges transferred to profit or loss (27,451) (7,269)<br />
Net change in fair value of cash flow hedges transferred to<br />
initial carrying value of hedged items – 2,798<br />
Net change in fair value of available-for-sale financial assets (132,220) 101,099<br />
Share of other comprehensive income of associates and joint ventures (5,869) 2,520<br />
Other comprehensive income for the year, net of tax 31 (266,832) (37,862)<br />
Total comprehensive income for the year 878,978 1,135,089<br />
Attributable to:<br />
Shareholders of the Company 644,457 735,140<br />
Non-controlling interests 234,521 399,949<br />
Total comprehensive income for the year 878,978 1,135,089<br />
Attributable to owners of the Company<br />
Reserve Currency Non-<br />
Share for own translation Other Accumulated controlling Total<br />
capital shares reserve reserves profits Total interests equity<br />
Group S$’000 S$’000 S$’000 S$’000 S$’000 S$’000 S$’000 S$’000<br />
At January 1, <strong>2011</strong> 571,099 (5,668) (230,754) 393,010 3,087,523 3,815,210 1,205,050 5,020,260<br />
Total comprehensive income<br />
for the year<br />
Profit for the year – – – – 809,282 809,282 336,528 1,145,810<br />
Other comprehensive income<br />
Foreign currency translation<br />
differences for<br />
foreign operations – – 7,536 – – 7,536 5,656 13,192<br />
Exchange differences on<br />
monetary items forming<br />
part of net investment<br />
in foreign operation – – (223) – – (223) – (223)<br />
Net change in fair value of<br />
cash flow hedges – – – (58,836) – (58,836) (55,425) (114,261)<br />
Net change in fair value of<br />
cash flow hedges<br />
transferred to profit or loss – – – (27,112) – (27,112) (339) (27,451)<br />
Net change in fair value of<br />
available-for-sale<br />
financial assets – – – (80,331) – (80,331) (51,889) (132,220)<br />
Share of other comprehensive<br />
income of associates<br />
and joint ventures – – – (5,859) – (5,859) (10) (5,869)<br />
Total other comprehensive<br />
income for the year – – 7,313 (172,138) – (164,825) (102,007) (266,832)<br />
Total comprehensive income<br />
for the year – – 7,313 (172,138) 809,282 644,457 234,521 878,978<br />
An analysis of the movements in each category within “Other reserves” is presented in Note 5(c).<br />
The accompanying notes form an integral part of these financial statements.<br />
The accompanying notes form an integral part of these financial statements.<br />
136 SEMBCORP INDUSTRIES ANNUAL REPORT <strong>2011</strong><br />
GROWING SUSTAINABLE BUSINESSES 137
CONSOLIDATED STATEMENT OF CHANGES IN EQUITY<br />
Year Ended December 31, <strong>2011</strong><br />
Attributable to owners of the Company<br />
Attributable to owners of the Company<br />
Reserve Currency Non-<br />
Share for own translation Other Accumulated controlling Total<br />
capital shares reserve reserves profits Total interests equity<br />
Group S$’000 S$’000 S$’000 S$’000 S$’000 S$’000 S$’000 S$’000<br />
Transactions with owners of the Company,<br />
recognised directly in equity<br />
Contributions by and distributions<br />
to owners of the Company<br />
Cancellation of shares (5,527) 5,527 – – – – – –<br />
Issue of shares to<br />
non-controlling interests – – – – – – 14,537 14,537<br />
Share-based payments – – – 19,564 – 19,564 6,995 26,559<br />
Purchase of treasury shares – (37,771) – – – (37,771) – (37,771)<br />
Issue of treasury shares<br />
under Share Option Plan – 7,942 – – – 7,942 – 7,942<br />
Issue of treasury shares<br />
under Performance Share Plan – 2,913 – – – 2,913 – 2,913<br />
Issue of treasury shares<br />
under Restricted Share Plan – 8,602 – – – 8,602 – 8,602<br />
Treasury shares transferred<br />
to employees – – – (15,976) – (15,976) – (15,976)<br />
Treasury shares of a subsidiary – – – (25,856) – (25,856) (16,701) (42,557)<br />
Realisation of reserve<br />
upon disposal of investments<br />
and changes in group structure – – (5,899) 2,869 2,490 (540) 496 (44)<br />
Final one-tier tax exempt dividend<br />
paid of 15.0 cents per share<br />
in respect of year 2010 – – – – (268,261) (268,261) – (268,261)<br />
Final bonus one-tier tax exempt<br />
dividend paid of 2.0 cents<br />
per share in respect of year 2010 – – – – (35,768) (35,768) – (35,768)<br />
Dividend paid to<br />
non-controlling interests – – – – – – (318,754) (318,754)<br />
Total contributions by<br />
and distributions to<br />
owners of the Company (5,527) (12,787) (5,899) (19,399) (301,539) (345,151) (313,427) (658,578)<br />
At December 31, <strong>2011</strong> 565,572 (18,455) (229,340) 201,473 3,595,266 4,114,516 1,126,144 5,240,660<br />
Reserve Currency Non-<br />
Share for own translation Other Accumulated controlling Total<br />
capital shares reserve reserves profits Total interests equity<br />
Group S$’000 S$’000 S$’000 S$’000 S$’000 S$’000 S$’000 S$’000<br />
At January 1, 2010 554,037 (21,236) (120,110) 344,915 2,562,352 3,319,958 915,577 4,235,535<br />
Total comprehensive income<br />
for the year<br />
Profit for the year – – – – 792,871 792,871 380,080 1,172,951<br />
Other comprehensive income<br />
Foreign currency translation<br />
differences for<br />
foreign operations – – (106,972) – – (106,972) (24,532) (131,504)<br />
Exchange differences on<br />
monetary items forming<br />
part of net investment<br />
in foreign operation – – (3,663) – – (3,663) – (3,663)<br />
Net change in fair value of<br />
cash flow hedges – – – (7,458) – (7,458) 5,615 (1,843)<br />
Net change in fair value of<br />
cash flow hedges transferred<br />
to profit or loss – – – (6,570) – (6,570) (699) (7,269)<br />
Net change in fair value of<br />
cash flow hedges transferred<br />
to initial carrying value<br />
of hedged items – – – 2,798 – 2,798 – 2,798<br />
Net change in fair value of<br />
available-for-sale<br />
financial assets – – – 61,565 – 61,565 39,534 101,099<br />
Transfer of reserve – – (9) – 58 49 (49) –<br />
Share of other comprehensive<br />
income of associates<br />
and joint ventures – – – 2,671 (151) 2,520 – 2,520<br />
Total other comprehensive<br />
income for the year – – (110,644) 53,006 (93) (57,731) 19,869 (37,862)<br />
Total comprehensive income<br />
for the year – – (110,644) 53,006 792,778 735,140 399,949 1,135,089<br />
An analysis of the movements in each category within “Other reserves” is presented in Note 5(c).<br />
The accompanying notes form an integral part of these financial statements.<br />
The accompanying notes form an integral part of these financial statements.<br />
138 SEMBCORP INDUSTRIES ANNUAL REPORT <strong>2011</strong><br />
GROWING SUSTAINABLE BUSINESSES 139
CONSOLIDATED STATEMENT OF CHANGES IN EQUITY<br />
Year Ended December 31, <strong>2011</strong><br />
CONSOLIDATED STATEMENT OF CASH FLOWS<br />
Year Ended December 31, <strong>2011</strong><br />
Attributable to owners of the Company<br />
Reserve Currency Non-<br />
Share for own translation Other Accumulated controlling Total<br />
capital shares reserve reserves profits Total interests equity<br />
Group S$’000 S$’000 S$’000 S$’000 S$’000 S$’000 S$’000 S$’000<br />
Transactions with owners of the Company,<br />
recognised directly in equity<br />
Contributions by and distributions<br />
to owners of the Company<br />
Issue of ordinary shares<br />
as acquisition consideration 17,062 – – – – 17,062 – 17,062<br />
Issue of shares to<br />
non-controlling interests – – – – – – 16,162 16,162<br />
Share-based payments – – – 15,829 – 15,829 5,256 21,085<br />
Purchase of treasury shares – (3,466) – – – (3,466) – (3,466)<br />
Issue of treasury shares<br />
under Share Option Plan – 12,478 – – – 12,478 – 12,478<br />
Issue of treasury shares<br />
under Performance Share Plan – 991 – – – 991 – 991<br />
Issue of treasury shares<br />
under Restricted Share Plan – 5,565 – – – 5,565 – 5,565<br />
Treasury shares transferred<br />
to employees – – – (12,232) – (12,232) – (12,232)<br />
Treasury shares of a subsidiary – – – 1,978 – 1,978 1,270 3,248<br />
Realisation of reserve<br />
upon disposal of investments<br />
and changes in group structure – – – – – – (745) (745)<br />
Final one-tier tax exempt dividend<br />
paid of 15.0 cents per share<br />
in respect of year 2009 – – – – (267,607) (267,607) – (267,607)<br />
Dividend paid to<br />
non-controlling interests – – – – – – (147,078) (147,078)<br />
Total contributions by<br />
and distributions to<br />
owners of the Company 17,062 15,568 – 5,575 (267,607) (229,402) (125,135) (354,537)<br />
Changes in ownership interests<br />
in subsidiaries<br />
Acquisition of<br />
non-controlling interests<br />
with a change in control – – – – – – 35,428 35,428<br />
Acquisition of<br />
non-controlling interests<br />
without a change in control – – – (10,486) – (10,486) (20,769) (31,255)<br />
Total changes in ownership<br />
interests in subsidiaries – – – (10,486) – (10,486) 14,659 4,173<br />
Total transactions with owners 17,062 15,568 – (4,911) (267,607) (239,888) (110,476) (350,364)<br />
At December 31, 2010 571,099 (5,668) (230,754) 393,010 3,087,523 3,815,210 1,205,050 5,020,260<br />
Group<br />
<strong>2011</strong> 2010<br />
Cash flows from operating activities<br />
Profit for the year 1,145,810 1,172,951<br />
Adjustments for:<br />
Dividend and interest income (69,218) (36,020)<br />
Finance costs 65,668 61,129<br />
Depreciation and amortisation 234,816 242,139<br />
Share of results of associates and joint ventures (170,573) (160,095)<br />
Gain on disposal of property, plant and equipment (980) (1,576)<br />
Gain on disposal of investment properties (822) –<br />
Gain on disposal of assets held for sale and investments (net) (455) (141)<br />
Full and final settlement of disputed foreign exchange transactions – (52,640)<br />
Changes in fair value of financial instruments 7,280 (12,428)<br />
Equity settled share-based compensation expenses 26,559 21,085<br />
Allowance made for impairment in value of assets and assets written off (net) 17,922 11,433<br />
Tax expense (Note 34) 124,769 194,378<br />
Operating profit before working capital changes 1,380,776 1,440,215<br />
Changes in working capital:<br />
Inventories and work-in-progress (471,233) 449,259<br />
Receivables (364,748) 77,255<br />
Payables 514,820 (185,479)<br />
1,059,615 1,781,250<br />
Net payment from banks for Unauthorised Transactions (Note 35(e)) – 52,640<br />
Tax paid (84,605) (131,525)<br />
Net cash from operating activities 975,010 1,702,365<br />
S$’000<br />
S$’000<br />
The accompanying notes form an integral part of these financial statements.<br />
140 SEMBCORP INDUSTRIES ANNUAL REPORT <strong>2011</strong><br />
The accompanying notes form an integral part of these financial statements.<br />
GROWING SUSTAINABLE BUSINESSES 141
CONSOLIDATED STATEMENT OF CASH FLOWS<br />
Year Ended December 31, <strong>2011</strong><br />
NOTES TO THE FINANCIAL STATEMENTS<br />
Year Ended December 31, <strong>2011</strong><br />
Group<br />
<strong>2011</strong> 2010<br />
Cash flows from investing activities<br />
Dividends and interest received 140,392 97,306<br />
Proceeds from disposal of interests in subsidiaries (2,428) –<br />
Proceeds from sale of investments 1,685 59<br />
Proceeds from sale of property, plant and equipment 3,621 7,619<br />
Proceeds from sale of investment properties 850 –<br />
Proceeds from sale of intangible assets – 10<br />
Proceeds from sale of assets held for sale 759 –<br />
Cash paid to non-controlling interests upon liquidation of a subsidiary – (542)<br />
Acquisition of / additional investments in associates and joint ventures (197,566) (18,758)<br />
Acquisition of subsidiaries, net of cash acquired (Note 38) – (197,003)<br />
Acquisition of non-controlling interests – (15,766)<br />
Acquisition of other financial assets – (2,005)<br />
Purchase of property, plant and equipment (Note (a)) (1,051,626) (629,357)<br />
Payment for intangible assets (38,578) (2,960)<br />
Net cash used in investing activities (1,142,891) (761,397)<br />
Cash flows from financing activities<br />
Proceeds from share issue to non-controlling interests of subsidiaries 14,537 16,162<br />
Proceeds from share options exercised with issue of treasury shares 3,481 6,802<br />
Proceeds from share options exercised with issue of treasury shares of a subsidiary 496 3,248<br />
Purchase of treasury shares (37,771) (3,466)<br />
Purchase of treasury shares by subsidiary (43,053) –<br />
Proceeds from borrowings 476,715 948,146<br />
Repayment of borrowings (50,556) (538,206)<br />
Payment on finance leases (2,785) (2,336)<br />
Net (decrease) / increase in other long-term liabilities (31) 626<br />
Dividends paid to owners of the Company (304,029) (267,607)<br />
Dividends paid to non-controlling interests of subsidiaries (318,754) (147,078)<br />
Interest paid (61,706) (45,807)<br />
Net cash used in financing activities (323,456) (29,516)<br />
Net (decrease) / increase in cash and cash equivalents (491,337) 911,452<br />
Cash and cash equivalents at beginning of the year 3,487,876 2,597,512<br />
Effect of exchange rate changes on balances held in foreign currency (1,061) (21,088)<br />
Cash and cash equivalents at end of the year (Note 22) 2,995,478 3,487,876<br />
(a) During the year, the Group acquired property, plant and equipment with an aggregate cost of S$1,053,314,000 (2010:<br />
S$658,807,000) of which S$851,000 (2010: S$4,432,000) was acquired by means of finance lease, and S$837,000 (2010:<br />
S$25,018,000) relates to provision for restoration costs (Note 24).<br />
S$’000<br />
S$’000<br />
These notes form an integral part of the financial statements.<br />
The financial statements were authorised for issue by the Board of Directors on February 27, 2012.<br />
1. Domicile and Activities<br />
<strong>Sembcorp</strong> <strong>Industries</strong> Ltd (the “Company”) is a company incorporated in the Republic of Singapore and has its registered<br />
office at 30 Hill Street #05-04, Singapore 179360.<br />
The principal activities of the Company include:<br />
a. investment holding, as well as the corporate headquarter which gives strategic direction and provides management<br />
services to its subsidiaries; and<br />
b. production and supply of utilities services, terminalling and storage of petroleum products and chemicals.<br />
The principal activities of key subsidiaries are as follows:<br />
i. Utilities<br />
This business focuses on the provision of energy, water and on-site logistics and solid waste management. Key<br />
activities in the energy sector include power generation and retail, process steam production and supply, as well as<br />
natural gas import, supply and retail. In the water sector, the business offers wastewater treatment as well as the<br />
production and supply of reclaimed, desalinated and potable water and water for industrial use.<br />
ii.<br />
Marine<br />
This business focuses principally on repair, building and conversion of ships and rigs, and on offshore engineering.<br />
iii. Integrated Urban Development (formerly known as Industrial Parks)<br />
This business owns, develops, markets and manages integrated industrial parks and townships in Asia.<br />
iv. Others / Corporate<br />
This business mainly relates to minting, design and construction activities, offshore engineering and the corporate<br />
companies.<br />
The financial statements comprise the Company and its subsidiaries (together referred to as the “Group” and<br />
individually as “Group entities”) and the Group’s interests in associates and joint ventures.<br />
2. Summary of Significant Accounting Policies<br />
a. Basis of Preparation<br />
The financial statements are prepared in accordance with Singapore Financial <strong>Report</strong>ing Standards (FRS).<br />
The financial statements are presented in Singapore dollars and rounded to the nearest thousand (S$’000), unless<br />
otherwise indicated. They are prepared on the historical cost basis except where otherwise described in the<br />
accounting policies below.<br />
The preparation of financial statements in conformity with FRS requires management to make judgements,<br />
estimates and assumptions that affect the application of accounting policies and the reported amounts of assets,<br />
liabilities, income and expenses. Actual results may differ from these estimates.<br />
The estimates and underlying assumptions are reviewed on an ongoing basis. Revisions to accounting estimates are<br />
recognised in the period in which the estimates are revised and in any future periods affected.<br />
The accompanying notes form an integral part of these financial statements.<br />
142 SEMBCORP INDUSTRIES ANNUAL REPORT <strong>2011</strong><br />
GROWING SUSTAINABLE BUSINESSES 143
NOTES TO THE FINANCIAL STATEMENTS<br />
Year Ended December 31, <strong>2011</strong><br />
2. Summary of Significant Accounting Policies (cont’d)<br />
a. Basis of Preparation (cont’d)<br />
Information about significant areas of estimation uncertainty and critical judgements in applying accounting<br />
policies that have the most significant effect on the amounts recognised in the financial statements are discussed<br />
in Note 45.<br />
With effect from January 1, <strong>2011</strong>, the Group adopted the new or amended FRS and Interpretations to FRS (INT FRS)<br />
that are mandatory for application from that date. Changes to the Group’s accounting policies have been made as<br />
required, in accordance with the transitional provisions in the respective FRS and INT FRS.<br />
The adoption of these new or amended FRS and INT FRS did not result in substantial changes to the Group’s<br />
and Company’s accounting policies and had no material effect on the amounts reported for the current or prior<br />
financial years except as disclosed below. The accounting policies used by the Group have been applied consistently<br />
to all periods presented in these financial statements.<br />
i. Measurement of non-controlling interests in business combinations<br />
From January 1, <strong>2011</strong>, the Group has applied the amendments to FRS 103 Business Combinations resulting<br />
from the Improvements to FRSs 2010 in measuring at the acquisition date, non-controlling interests that are<br />
not present ownership interests and do not entitle their holders to a proportionate share of the acquiree’s<br />
net assets in the event of liquidation. Such non-controlling interests are now measured at fair value (see Note<br />
2(b)(i)).<br />
Previously, the Group has elected on a transaction-by-transaction basis whether to measure non-controlling<br />
interests that are not present ownership interests and do not entitle holders to proportionate share of the<br />
acquiree’s net assets on liquidation at fair value, or at the non-controlling interests’ proportionate share of the<br />
recognised amounts of the acquiree’s identifiable net assets, at the acquisition date.<br />
2. Summary of Significant Accounting Policies (cont’d)<br />
b. Consolidation<br />
i. Business Combinations<br />
Acquisitions on or after January 1, 2010<br />
Business combinations are accounted for using the acquisition method as at the acquisition date, which is the<br />
date on which control is transferred to the Group. Control is the power to govern the financial and operating<br />
policies of an entity so as to obtain benefits from its activities. In assessing control, the Group takes into<br />
consideration potential voting rights that are currently exercisable.<br />
The consideration transferred does not include amounts related to the settlement of pre-existing relationships.<br />
Such amounts are generally recognised in profit or loss.<br />
Costs related to the acquisition, other than those associated with the issue of debt or equity securities, that the<br />
Group incurs in connection with a business combination are expensed as incurred.<br />
Any contingent consideration payable is recognised at fair value at the acquisition date. If the contingent<br />
consideration is classified as equity, it is not remeasured and settlement is accounted for within equity.<br />
Otherwise, subsequent changes to the fair value of the contingent consideration are recognised in profit or<br />
loss.<br />
For non-controlling interests that are present ownership interests and entitle their holders to a proportionate<br />
share of the acquiree’s net assets in the event of liquidation, the Group elects on a transaction-by-transaction<br />
basis whether to measure them at fair value, or at the non-controlling interests’ proportionate share of the<br />
recognised amounts of the acquiree’s identifiable net assets, at the acquisition date. All other non-controlling<br />
interests are measured at acquisition-date fair value or, when applicable, on the basis specified in another<br />
standard.<br />
ii.<br />
Identification of related party relationships and related party disclosures<br />
From January 1, <strong>2011</strong>, the Group has applied the revised FRS 24 Related Party Disclosures (2010) to identify<br />
parties that are related to the Group and to determine the disclosures to be made on transactions and<br />
outstanding balances, including commitments, between the Group and its related parties. FRS 24 (2010)<br />
improved the definition of a related party in order to eliminate inconsistencies and ensure symmetrical<br />
identification of relationships between two parties.<br />
The adoption of FRS 24 (2010) has resulted in additional parties being identified as related to the Group.<br />
Transactions and outstanding balances, including commitments, with these related parties for the current and<br />
comparative years have been disclosed accordingly in Note 40 to the financial statements.<br />
The adoption of FRS 24 (2010) affects only the disclosures made in the financial statements. There is no<br />
financial effect on the results and financial position of the Group for the current and previous financial years.<br />
Accordingly, the adoption of FRS 24 (2010) has no impact on earnings per share.<br />
Acquisitions between January 1, 2004 and December 31, 2009<br />
For acquisitions between January 1, 2004 and December 31, 2009, business combinations are accounted<br />
for using the purchase method, upon the adoption of FRS 103. Under the purchase method, the cost of an<br />
acquisition is measured at the fair value of the assets given, equity instruments issued and liabilities incurred or<br />
assumed at the date of exchange, plus costs directly attributable to the acquisition. The excess of the Group’s<br />
interest in the net fair value of the identifiable assets, liabilities and contingent liabilities over the cost of<br />
acquisition is credited to profit or loss in the period of the acquisition.<br />
Acquisitions prior to January 1, 2004<br />
Prior to January 1, 2004, business combinations were accounted for either by the purchase method, or if they<br />
were between entities under common control, by the historical cost method similar to the pooling-of-interest<br />
method.<br />
ii. Acquisition of Non-controlling Interests<br />
Acquisitions of non-controlling interests are accounted for as transactions with owners in their capacity as<br />
owners and therefore no goodwill is recognised as a result of such transactions. The adjustments to noncontrolling<br />
interests are based on a proportionate amount of the fair value of net assets of the subsidiary.<br />
Prior to January 1, 2010, goodwill was recognised on the acquisition of non-controlling interests in a subsidiary,<br />
which represented the excess of the cost of the additional investment over the carrying amount of the interest<br />
in the net assets acquired at the date of the transaction.<br />
144 SEMBCORP INDUSTRIES ANNUAL REPORT <strong>2011</strong><br />
GROWING SUSTAINABLE BUSINESSES 145
NOTES TO THE FINANCIAL STATEMENTS<br />
Year Ended December 31, <strong>2011</strong><br />
2. Summary of Significant Accounting Policies (cont’d)<br />
b. Consolidation (cont’d)<br />
iii. Subsidiaries<br />
Subsidiaries are those entities that are controlled by the Group.<br />
The financial statements of subsidiaries are included in the consolidated financial statements from the date<br />
that control commences until the date control ceases. The accounting policies of subsidiaries have been<br />
changed when necessary to align them with the policies adopted by the Group.<br />
Non-controlling interests are that part of the net results of operations and of net assets of a subsidiary<br />
attributable to the interests which are not owned directly or indirectly by the equity holders of the Company.<br />
They are shown separately in the consolidated statement of comprehensive income, statement of changes in<br />
equity and balance sheet. Total comprehensive income is attributed to the non-controlling interests based<br />
on their respective interests in a subsidiary even if this results in the non-controlling interests having a deficit<br />
balance.<br />
iv. Acquisitions from Entities under Common Control<br />
Business combinations that involve entities under common control are excluded from the scope of FRS 103.<br />
Such combinations are accounted at historical cost in a manner similar to the pooling-of-interest method, in<br />
the preparation of the consolidated financial statements. Under this method of accounting, the difference<br />
between the value of the share capital issued and the value of shares received is taken to the merger reserve.<br />
v. Loss of Control<br />
Upon the loss of control, the Group derecognises the assets and liabilities of the subsidiary, any non-controlling<br />
interests and the other components of equity related to the subsidiary. Any surplus or deficit arising on the loss<br />
of control is recognised in profit or loss. If the Group retains any interest in the previous subsidiary, then such<br />
interest is measured at fair value at the date that control is lost. Subsequently, it is accounted for as an equityaccounted<br />
investee or as an available-for-sale financial asset depending on the level of influence retained.<br />
vi. Associates<br />
Associates are those entities in which the Group has significant influence, but not control, over the financial<br />
and operating policies.<br />
The existence and effect of potential voting rights that are presently exercisable or presently convertible<br />
are considered when assessing whether the Group has significant influence over another entity. Significant<br />
influence is presumed to exist when the Group holds between 20% and 50% of the voting power of another<br />
entity.<br />
Associates are accounted for using the equity method of accounting from the day that significant influence<br />
commences until the date that significant influence ceases. When the Group’s share of losses exceeds the<br />
carrying amount of the associate (including any other unsecured receivables, that in substance, form part of<br />
the Group’s net investment in the associate), recognition of further losses is discontinued unless the Group has<br />
incurred obligations or made payments on its behalf to satisfy obligations of the associate that the Group has<br />
guaranteed or otherwise committed on behalf of.<br />
The excess of the Group’s interest in the net fair value of the identifiable assets, liabilities and contingent<br />
liabilities over the cost of acquisition is credited to profit or loss in the period of the acquisition. Where the<br />
audited financial statements are not available, the share of results is arrived at from unaudited management<br />
financial statements made up mainly to the end of the accounting year to December 31.<br />
2. Summary of Significant Accounting Policies (cont’d)<br />
b. Consolidation (cont’d)<br />
vii. Joint Ventures<br />
Joint ventures are those entities over whose activities the Group has joint control, established by contractual<br />
agreement and requiring unanimous consent for strategic, financial and operating decisions.<br />
The existence and effect of potential voting rights that are presently exercisable or presently convertible are<br />
considered when assessing whether the Group has joint control over the entity.<br />
Joint ventures are accounted for using the equity method of accounting from the date joint control commences<br />
until the day that the joint control ceases.<br />
The excess of the Group’s interest in the net fair value of the identifiable assets, liabilities and contingent<br />
liabilities over the cost of acquisition is credited to profit or loss in the period of the acquisition. Where the<br />
audited financial statements are not available, the share of results is arrived at from unaudited management<br />
financial statements made up mainly to the end of the accounting year to December 31.<br />
viii. Transactions Eliminated on Consolidation<br />
All intra-group balances, transactions, and unrealised income and expenses arising from intra-group<br />
transactions, are eliminated in preparing the consolidated financial statements. Unrealised gains arising from<br />
transactions with associates and joint ventures are eliminated against the investment to the extent of the<br />
Group’s interest in the investee. Unrealised losses are eliminated in the same way as unrealised gains, but only<br />
to the extent that there is no evidence of impairment.<br />
ix. Accounting for Subsidiaries, Associates and Joint Ventures<br />
Investments in subsidiaries, associates and joint ventures are measured in the Company’s balance sheet at cost<br />
less accumulated impairment losses.<br />
c. Foreign Currencies<br />
i. Functional and Presentation Currency<br />
Items included in the financial statements of each company in the Group are measured using the currency<br />
of the primary economic environment in which the company operates (“the functional currency”). The<br />
consolidated financial statements are presented in Singapore dollars, which is the Company’s functional and<br />
presentation currency.<br />
ii. Foreign Currency Transactions and Balances<br />
Transactions in foreign currencies are translated to the respective functional currencies of Group entities at<br />
foreign exchange rates at the dates of the transactions. At each reporting date:<br />
• Foreign currency monetary assets and liabilities are translated into the functional currency using foreign<br />
exchange rates ruling at that date.<br />
• Non-monetary assets and liabilities measured at historical cost in foreign currencies are translated into the<br />
functional currency using foreign exchange rates at the dates of the transactions.<br />
• Non-monetary assets and liabilities measured at fair value in foreign currencies are translated into the<br />
functional currency at foreign exchange rates ruling at the dates the fair value was determined.<br />
146 SEMBCORP INDUSTRIES ANNUAL REPORT <strong>2011</strong><br />
GROWING SUSTAINABLE BUSINESSES 147
NOTES TO THE FINANCIAL STATEMENTS<br />
Year Ended December 31, <strong>2011</strong><br />
2. Summary of Significant Accounting Policies (cont’d)<br />
c. Foreign Currencies (cont’d)<br />
ii. Foreign Currency Transactions and Balances (cont’d)<br />
Foreign exchange differences arising from the settlement or from translation of monetary items are recognised<br />
in profit or loss.<br />
Foreign exchange differences arising from non-monetary items are recognised directly in other comprehensive<br />
income when non-monetary items’ gains or losses are recognised directly in other comprehensive income.<br />
Conversely, when non-monetary items’ gains or losses are recognised directly in profit or loss, foreign exchange<br />
differences arising from these items are recognised directly in profit or loss.<br />
iii. Foreign Operations<br />
The results and financial positions of foreign operations (none of which has the currency of a hyperinflationary<br />
economy) that have a functional currency different from the presentation currency are translated into the<br />
presentation currency as follows:<br />
• Assets and liabilities are translated at foreign exchange rates ruling at the date of the balance sheet.<br />
• Revenues and expenses are translated at average foreign exchange rates.<br />
•<br />
All resulting foreign exchange differences are taken to the foreign currency translation reserve in other<br />
comprehensive income.<br />
Goodwill (except those relating to acquisitions of foreign operations prior to January 1, 2004) and fair value<br />
adjustments arising from the acquisition of foreign operations are translated to the presentation currency for<br />
consolidation at the rates of exchange ruling at the balance sheet date. Goodwill arising from the acquisition<br />
of foreign operations prior to January 1, 2004 are translated at foreign exchange rates ruling at the dates of<br />
the transactions.<br />
On disposal, accumulated foreign currency translation differences are recognised in the consolidated income<br />
statement as part of the gain or loss on disposal.<br />
Foreign currency differences are recognised in other comprehensive income, and presented in the foreign<br />
currency translation reserve (translation reserve) in equity. However, if the foreign operation is a non-whollyowned<br />
subsidiary, then the relevant proportionate share of the translation difference is allocated to the noncontrolling<br />
interests. When a foreign operation is disposed of such that control, significant influence or joint<br />
control is lost, the cumulative amount in the translation reserve related to that foreign operation is reclassified<br />
to profit or loss as part of the gain or loss on disposal. When the Group disposes of only part of its interest in a<br />
subsidiary that includes a foreign operation while retaining control, the relevant proportion of the cumulative<br />
amount is reattributed to non-controlling interests. When the Group disposes of only part of its investment<br />
in an associate or joint venture that includes a foreign operation while retaining significant influence or joint<br />
control, the relevant proportion of the cumulative amount is reclassified to profit or loss.<br />
iv. Net Investment in a Foreign Operation<br />
Exchange differences arising from monetary items that in substance form part of the Company’s net investment<br />
in a foreign operation are recognised in the Company’s profit or loss. Such exchange differences are reclassified<br />
to the foreign currency translation reserve in the consolidated statement of comprehensive income and are<br />
released to the consolidated income statement upon disposal of the investment as part of the gain or loss on<br />
disposal.<br />
2. Summary of Significant Accounting Policies (cont’d)<br />
d. Property, Plant and Equipment<br />
i. Owned Assets<br />
Property, plant and equipment are measured at cost less accumulated depreciation and accumulated<br />
impairment losses. Cost includes expenditure that is directly attributable to the acquisition of the asset.<br />
ii.<br />
The cost of self-constructed asset includes the cost of materials, direct labour and any other costs directly<br />
attributable to bringing the assets to a working condition for their intended use, the cost of dismantling and<br />
removing the items and restoring the site on which they are located and capitalised borrowing costs.<br />
Where an item of property, plant and equipment comprises major components having different useful lives,<br />
they are accounted for as separate items of property, plant and equipment.<br />
Revaluation Surplus<br />
Any increase in revaluation is credited to the revaluation reserve unless it offsets a previous decrease in value<br />
recognised in profit or loss. A decrease in value is recognised in profit or loss where it exceeds the increase<br />
previously recognised in the revaluation surplus of the same asset.<br />
iii. Subsequent Expenditure<br />
Subsequent expenditure relating to property, plant and equipment that has already been recognised is<br />
added to the carrying amount of the asset when it is probable that future economic benefits, in excess of the<br />
originally assessed standard of performance of the existing asset, will flow to the Group. All other subsequent<br />
expenditure is recognised as an expense in the period in which it is incurred.<br />
Certain items of property, plant and equipment are subject to overhauls at regular intervals. The inherent<br />
components of the initial overhaul are determined based on the costs of the next overhaul and are separately<br />
depreciated in order to reflect the estimated intervals between two overhauls. The costs of the overhauls<br />
subsequently incurred are capitalised as additions and the carrying amounts of the replaced components are<br />
written off to profit or loss.<br />
iv. Disposals<br />
Gains or losses arising from the retirement or disposal of property, plant and equipment are determined as<br />
the difference between the net disposal proceeds and the carrying amount of the asset and are recognised in<br />
profit or loss on the date of retirement or disposal.<br />
v. Finance Lease Assets<br />
Finance leases are those leasing agreements with terms of which the Group assumes substantially all the risks<br />
and rewards of ownership. Property, plant and equipment acquired by way of such leases is capitalised at the<br />
lower of its fair value and the present value of the minimum lease payments at the inception of the lease, less<br />
accumulated depreciation and impairment losses.<br />
Lease payments are apportioned between the finance charges and reduction of the lease liability so as to<br />
achieve a constant rate of interest on the remaining balance of the liability.<br />
Finance charges are charged directly to profit or loss.<br />
Capitalised leased assets are depreciated over the shorter of the economic useful life of the asset and the lease<br />
term.<br />
148 SEMBCORP INDUSTRIES ANNUAL REPORT <strong>2011</strong><br />
GROWING SUSTAINABLE BUSINESSES 149
NOTES TO THE FINANCIAL STATEMENTS<br />
Year Ended December 31, <strong>2011</strong><br />
2. Summary of Significant Accounting Policies (cont’d)<br />
d. Property, Plant and Equipment (cont’d)<br />
vi. Provision for Restoration Costs<br />
A provision is recognised for the costs expected to be incurred to dismantle, remove and restore the asset upon<br />
expiry of the lease agreement. The estimated costs form part of the cost of the property, plant and equipment<br />
and are depreciated over the useful life of the asset.<br />
vii. Depreciation<br />
Depreciation is calculated using the straight-line method to allocate the cost less its residual value so as to write<br />
off items of property, plant and equipment over their estimated useful lives. Each part of an item of property,<br />
plant and equipment with a cost that is significant in relation to the total cost of an item is depreciated<br />
separately. The estimated useful lives for the current and comparative years are as follows:<br />
Leasehold land and wet berthage<br />
Buildings<br />
Improvements to premises<br />
Quays and dry docks<br />
Infrastructure<br />
Plant and machinery<br />
Marine vessels<br />
Tools and workshop equipment<br />
Furniture, fittings and office equipment<br />
Motor vehicles<br />
Lease period of 3 to 60 years<br />
10 to 75 years or lease period of 3 to 30 years<br />
3 to 30 years<br />
60 years or lease period of 6 to 22 years<br />
8 to 80 years<br />
3 to 40 years<br />
3 to 20 years<br />
3 to 10 years<br />
1 to 10 years<br />
2 to 10 years<br />
The assets’ depreciation methods, useful lives and residual values are reviewed, if not insignificant, annually,<br />
and adjusted as appropriate.<br />
No depreciation is provided on freehold land and capital work-in-progress.<br />
Fully depreciated assets are retained in the financial statements until they are no longer in use.<br />
e. Investment Properties<br />
Investment properties comprise significant portions of office buildings and freehold land that are held for longterm<br />
rental yields or for capital appreciation, or both.<br />
Investment properties are initially recognised at cost and subsequently carried at cost less accumulated depreciation<br />
and accumulated impairment losses. Depreciation is recognised in profit or loss on a straight-line basis over the<br />
estimated useful lives ranging from 20 to 50 years. The assets’ depreciation methods, useful lives and residual<br />
values are reviewed, if not insignificant, annually, and adjusted if appropriate. No depreciation is provided on the<br />
freehold land.<br />
Investment properties are subject to renovations or improvements at regular intervals. The cost of major<br />
renovations and improvements is capitalised as additions and the carrying amounts of the replaced components<br />
are written off to profit or loss. The cost of maintenance, repairs and minor improvements is charged to profit or<br />
loss when incurred.<br />
2. Summary of Significant Accounting Policies (cont’d)<br />
f. Intangible Assets<br />
i. Goodwill<br />
Goodwill represents the excess of:<br />
• the fair value of the consideration transferred; plus<br />
•<br />
•<br />
the recognised amount of any non-controlling interests in the acquiree;<br />
plus if the business combination is achieved in stages, the fair value of the existing equity interest in the<br />
acquiree, less the net amount recognised (generally fair value) of the identifiable assets acquired and<br />
liabilities assumed.<br />
When the excess is negative, a bargain purchase gain is recognised immediately in profit or loss.<br />
Goodwill is measured at cost less accumulated impairment losses.<br />
Goodwill on acquisition of associates and joint ventures is included in investments in associates and joint<br />
ventures, respectively. An impairment loss on such investments is not allocated to any asset, including goodwill,<br />
that forms part of the carrying amount of the investments.<br />
Goodwill is tested for impairment on an annual basis in accordance with Note 2(m).<br />
ii. Goodwill / Negative Goodwill Previously Written Off Against Reserves<br />
Goodwill that has previously been taken to reserves is not taken to profit or loss when (i) the business is<br />
disposed of or discontinued or (ii) the goodwill is impaired. Similarly, negative goodwill that has previously<br />
been taken to reserves is not taken to profit or loss when the business is disposed of or discontinued.<br />
iii. Research and Development<br />
Expenditure on research activities, undertaken with the prospect of gaining new scientific or technical<br />
knowledge and understanding, is recognised in profit or loss as an expense as incurred.<br />
Expenditure on development activities, whereby research findings are applied to a plan or design for the<br />
production of new or substantially improved products and processes, is capitalised only if development costs<br />
can be measured reliably, the product or process is technically and commercially feasible, future economic<br />
benefits are probable, and the Group has sufficient resources to complete development and to use or sell the<br />
asset. The expenditure capitalised includes the cost of materials, direct labour and an appropriate proportion<br />
of overheads that are directly attributable to preparing the asset for its intended use. Other development<br />
expenditure is recognised in profit or loss as an expense as incurred.<br />
Capitalised development expenditure is measured at cost less accumulated amortisation and accumulated<br />
impairment losses.<br />
On disposal of an investment property, the difference between the net disposal proceeds and the carrying amount<br />
of the asset is recognised in profit or loss.<br />
150 SEMBCORP INDUSTRIES ANNUAL REPORT <strong>2011</strong><br />
GROWING SUSTAINABLE BUSINESSES 151
NOTES TO THE FINANCIAL STATEMENTS<br />
Year Ended December 31, <strong>2011</strong><br />
2. Summary of Significant Accounting Policies (cont’d)<br />
f. Intangible Assets (cont’d)<br />
iv. Service Concession Arrangements<br />
The Group recognises an intangible asset arising from a service concession arrangement when it has a right to<br />
charge for usage of the concession infrastructure. An intangible asset received as consideration for providing<br />
construction or upgrade services in a service concession arrangement is measured at fair value upon initial<br />
recognition. Subsequent to initial recognition, the intangible asset is measured at cost, which includes<br />
capitalised borrowing costs, less accumulated amortisation and accumulated impairment losses.<br />
The estimated useful life of an intangible asset in a service concession arrangement is the period when it is<br />
available for use to the end of the concession period.<br />
Amortisation is charged to profit or loss on a straight-line basis over the estimated useful lives of 25 to 30 years.<br />
v. Other Intangible Assets<br />
Other intangible assets with a finite life are measured at cost less accumulated amortisation and accumulated<br />
impairment losses. Expenditure on internally generated goodwill is recognised in profit or loss as an expense<br />
as incurred. Other intangible assets are amortised on a straight-line basis from the date the asset is available<br />
for use and over its estimated useful lives ranging from 3 to 30 years.<br />
vi. Subsequent Expenditure<br />
Subsequent expenditure on capitalised intangible assets is capitalised only when it increases the future<br />
economic benefits embodied in the specific asset to which it relates. All other expenditure is expensed as<br />
incurred.<br />
Intangible assets of indefinite life or not yet available for use are measured at cost less accumulated impairment<br />
losses. Such intangible assets are tested for impairment annually in accordance with Note 2(m).<br />
g. Financial Assets<br />
The Group initially recognises loans and receivables and deposits on the date that they are originated. All other<br />
financial assets (including assets designated at fair value through profit or loss) are recognised initially on the trade<br />
date, which is the date that the Group becomes a party to the contractual provisions of the instrument.<br />
The Group derecognises a financial asset when the contractual rights to the cash flows from the asset expire, or it<br />
transfers the rights to receive the contractual cash flows on the financial asset in a transaction in which substantially<br />
all the risks and rewards of ownership of the financial asset are transferred. Any interest in transferred financial<br />
assets that is created or retained by the Group is recognised as a separate asset or liability.<br />
Financial assets and liabilities are offset and the net amount presented in the balance sheets when, and only when,<br />
the Group has a legal right to offset the amounts and intends either to settle on a net basis or to realise the asset<br />
and settle the liability simultaneously.<br />
The Group classifies non-derivative financial assets into the following categories: financial assets at fair value<br />
through profit or loss; held to maturity investments; loans and receivables and available-for-sale financial assets.<br />
The classification depends on the purpose for which the financial assets are acquired or held. Management<br />
determines the classification of its financial assets at initial recognition and re-evaluates this designation at every<br />
reporting date. The designation of financial assets at fair value through profit or loss is irrevocable.<br />
2. Summary of Significant Accounting Policies (cont’d)<br />
g. Financial Assets (cont’d)<br />
i. Financial Assets at Fair Value Through Profit or Loss<br />
A financial asset is classified at fair value through profit or loss if it is classified as held for trading or is<br />
designated as such upon initial recognition. Financial assets are designated at fair value through profit or loss<br />
if the Group manages such investments and makes purchase and sale decisions based on their fair value in<br />
accordance with the Group’s documented risk management or investment strategy. Upon initial recognition,<br />
attributable transaction costs are recognised in profit or loss as incurred. Financial assets at fair value through<br />
profit or loss are measured at fair value, and changes therein are recognised in profit or loss.<br />
ii. Held to Maturity Investments<br />
Where the Group has the positive intent and ability to hold investments to maturity, then such investments are<br />
recognised initially at fair value plus any directly attributable transaction costs and subsequently measured at<br />
amortised cost using the effective interest method less impairment losses. During the year, the Group did not<br />
hold any investment in this category.<br />
iii. Loans and Receivables<br />
Loans and receivables are financial assets with fixed or determinable payments that are not quoted in an active<br />
market. They arise when the Group provides money, goods or services directly to a debtor with no intention of<br />
trading the receivable. They are included in current assets, except for maturities greater than 12 months after<br />
the balance sheet date for which they are classified as non-current assets. Loans and receivables are recognised<br />
initially at fair value plus any directly attributable transaction costs and subsequently measured at amortised<br />
cost using the effective interest method. Receivables with a short duration are not discounted. Loans and<br />
receivables are included in trade and other receivables in the balance sheet.<br />
Loans and receivables comprise cash and cash equivalents, trade and other receivables, including service<br />
concession receivables.<br />
Cash and Cash Equivalents<br />
Cash and cash equivalents comprise cash balances and bank deposits. For the purpose of the statement of cash<br />
flows, cash and cash equivalents are presented net of bank overdrafts which are repayable on demand. Bank<br />
overdrafts are shown within interest-bearing borrowings in current liabilities on the balance sheet.<br />
Service Concession Arrangement<br />
The Group recognises a financial asset arising from a service concession arrangement when it has an<br />
unconditional contractual right to receive cash or another financial asset from or at the direction of the<br />
grantor for the construction or upgrade services provided. Such financial assets are measured at fair value<br />
upon initial recognition. Subsequent to initial recognition, the financial assets are measured at amortised cost.<br />
If the Group is paid for the construction services partly by a financial asset and partly by an intangible asset,<br />
then each component of the consideration is accounted for separately and is recognised initially at the fair<br />
value of the consideration (see also Note 2(f)(iv)).<br />
152 SEMBCORP INDUSTRIES ANNUAL REPORT <strong>2011</strong><br />
GROWING SUSTAINABLE BUSINESSES 153
NOTES TO THE FINANCIAL STATEMENTS<br />
Year Ended December 31, <strong>2011</strong><br />
2. Summary of Significant Accounting Policies (cont’d)<br />
g. Financial Assets (cont’d)<br />
iv. Available-for-Sale Financial Assets<br />
Other financial assets held by the Group that are either designated in this category or not classified in any other<br />
category, are classified as being available-for-sale. They are included in non-current assets unless management<br />
intends to dispose of the investment within 12 months of the balance sheet date. They are recognised initially<br />
at fair value plus any directly attributable transaction costs. Subsequent to initial recognition, they are<br />
measured at fair value and changes therein, other than impairment losses and foreign currency differences are<br />
recognised directly in other comprehensive income. When these investments are derecognised, the cumulative<br />
gain or loss previously recognised directly in other comprehensive income, or part thereof, is recognised in<br />
profit or loss. Where these investments are interest-bearing, interest calculated using the effective interest<br />
method is recognised in profit or loss.<br />
Impairment<br />
The Group assesses at each balance sheet date whether there is objective evidence that a financial asset or<br />
a group of financial assets is impaired. A financial asset is impaired if objective evidence indicates that a loss<br />
event has occurred after the initial recognition of the asset, and that the loss event has a negative effect on<br />
the estimated future cash flows of that asset that can be estimated reliably.<br />
Objective evidence that financial assets (including equity securities) are impaired can include default or<br />
delinquency by a debtor, restructuring of an amount due to the Group on terms that the Group would<br />
not consider otherwise, indications that a debtor or issuer will enter bankruptcy, adverse changes in the<br />
payment status of borrowers or issuers in the Group, economic conditions that correlate with defaults or<br />
the disappearance of an active market for a security. In addition, for an investment in an equity security, a<br />
significant or prolonged decline in its fair value below its cost is objective evidence of impairment.<br />
When a decline in the fair value of an available-for-sale financial asset has been recognised directly in other<br />
comprehensive income and there is objective evidence that the value of the asset is impaired, the cumulative<br />
loss that had been recognised directly in other comprehensive income is recognised in profit or loss even<br />
though the financial asset has not been derecognised. The amount of the cumulative loss that is recognised<br />
in profit or loss is the excess of acquisition cost less any impairment loss on that financial asset previously<br />
recognised in profit or loss, over its current fair value.<br />
An impairment loss in respect of a financial asset measured at amortised cost is calculated as the difference<br />
between its carrying amount and the present value of the estimated future cash flows, discounted at the<br />
asset’s original effective interest rate. Losses are recognised in profit or loss and reflected in an allowance<br />
account against loans and receivables or held-to-maturity investment securities. Interest on the impaired asset<br />
continues to be recognised.<br />
Reversals of Impairment<br />
An impairment loss in respect of a held-to-maturity investment security or receivable carried at amortised cost<br />
is reversed if the subsequent increase in recoverable amount can be related objectively to an event occurring<br />
after the impairment loss was recognised. The decrease in impairment loss is reversed through profit or loss.<br />
An impairment loss once recognised in profit or loss in respect of an investment in an equity instrument<br />
classified as available-for-sale is not reversed through profit or loss. Any subsequent increase in fair value<br />
of such assets is recognised directly in other comprehensive income. If the fair value of a debt instrument<br />
classified as available-for-sale increases and the increase can be objectively related to an event occurring after<br />
the impairment loss was recognised in profit or loss, the impairment loss shall be reversed, with the amount of<br />
the reversal recognised in profit or loss.<br />
2. Summary of Significant Accounting Policies (cont’d)<br />
h. Derivatives<br />
Derivative financial instruments are used to manage exposures to foreign exchange, interest rate and commodity<br />
price risks arising from operational, financing and investment activities. Derivative financial instruments are not<br />
used for trading purposes. However, derivatives that do not qualify for hedge accounting are accounted for as<br />
trading instruments.<br />
Derivative financial instruments are recognised initially at fair value; attributable transaction costs are recognised<br />
in profit or loss as incurred. Subsequent to initial recognition, derivative financial instruments are remeasured at<br />
fair value. The gain or loss on remeasurement to fair value is recognised immediately in profit or loss. However,<br />
where derivatives qualify for hedge accounting, recognition of any resultant gain or loss depends on the nature of<br />
the item being hedged as described in Note 2(i).<br />
i. Hedging Activities<br />
The Group documents at the inception of the transaction the relationship between the hedging instruments and<br />
hedged items, together with the methods that will be used to assess the effectiveness of the hedge relationship,<br />
as well as its risk management objective and strategies for undertaking various hedge transactions. The Group also<br />
documents its assessment, both at hedge inception and on an ongoing basis, of whether the derivatives designated<br />
as hedging instruments are highly effective in offsetting changes in fair value or cash flows of the hedged items.<br />
i. Fair Value Hedges<br />
Where a derivative financial instrument hedges the changes in fair value of a recognised asset or liability or an<br />
unrecognised firm commitment (or an identified portion of such asset, liability or firm commitment), any gain<br />
or loss on the hedging instrument is recognised in profit or loss. The hedged item is also measured at fair value<br />
in respect of the risk being hedged, with any gain or loss recognised in profit or loss.<br />
ii. Cash Flow Hedges<br />
Where a derivative financial instrument is designated as a hedge of the variability in cash flows attributable<br />
to a particular risk associated with a recognised asset or liability, or a highly probable forecast transaction,<br />
the effective part of any gain or loss on the derivative financial instrument is recognised directly in other<br />
comprehensive income. The ineffective part of any gain or loss is recognised immediately in profit or loss.<br />
When the forecast transaction subsequently results in the recognition of a non-financial asset or nonfinancial<br />
liability, or the forecast transaction for a non-financial asset or non-financial liability becomes a<br />
firm commitment for which fair value hedge accounting is applied, the associated cumulative gain or loss<br />
is removed from equity and included in the initial cost or other carrying amount of the non-financial asset<br />
or liability. If a hedge of a forecast transaction subsequently results in the recognition of a financial asset or<br />
financial liability, the associated gains and losses that were recognised directly in other comprehensive income<br />
are reclassified into profit or loss in the same period or periods during which the asset acquired or liability<br />
assumed affects profit or loss.<br />
When a hedging instrument expires or is sold, terminated or exercised, or the entity revokes designation of<br />
the hedge relationship but the hedged forecast transaction is still expected to occur, then hedge accounting<br />
is discontinued prospectively. The cumulative gain or loss at that point remains in equity and is recognised in<br />
accordance with the above policy when the transaction occurs. If the hedged transaction is no longer expected<br />
to take place, the cumulative unrealised gain or loss recognised in equity is recognised immediately in profit<br />
or loss.<br />
154 SEMBCORP INDUSTRIES ANNUAL REPORT <strong>2011</strong><br />
GROWING SUSTAINABLE BUSINESSES 155
NOTES TO THE FINANCIAL STATEMENTS<br />
Year Ended December 31, <strong>2011</strong><br />
2. Summary of Significant Accounting Policies (cont’d)<br />
i. Hedging Activities (cont’d)<br />
iii. Hedge of Monetary Assets and Liabilities<br />
Where a derivative financial instrument is used to hedge economically the foreign exchange exposure of a<br />
recognised monetary asset or liability, no hedge accounting is applied and any gain or loss on the hedging<br />
instrument is recognised in profit or loss.<br />
iv. Hedge of Net Investment in a Foreign Operation<br />
The gain or loss on a financial instrument used to hedge a net investment in a foreign operation is recognised in<br />
the Company’s profit or loss. On consolidation, only the portion of the gain or loss on the hedging instrument<br />
that is determined to be an effective hedge is reclassified to other comprehensive income. This amount is<br />
recognised in the consolidated profit or loss on disposal of the foreign operation.<br />
v. Separable Embedded Derivatives<br />
Changes in the fair value of separable embedded derivatives are recognised immediately in profit or loss.<br />
j. Inventories<br />
i. Finished Goods and Components<br />
Inventories are measured at the lower of cost and net realisable value.<br />
2. Summary of Significant Accounting Policies (cont’d)<br />
k. Trade Receivables<br />
Trade receivables (including service concession receivables) are recognised initially at fair value and subsequently<br />
measured at amortised cost using the effective interest method.<br />
An allowance for impairment of trade receivables is established when there is objective evidence that the Group<br />
will not be able to collect all amounts due according to the original terms of the receivables. The amount of the<br />
allowance is the difference between the asset’s carrying amount and the present value of estimated future cash<br />
flows, discounted at the effective interest rate. The amount of the allowance is recognised in profit or loss.<br />
l. Government Grants<br />
i. Deferred Asset Grants<br />
Asset related grants are credited to a deferred asset grant account at fair value and are released to profit or<br />
loss on the straight-line basis over the estimated useful lives of the relevant assets.<br />
Non-monetary government grants and assets received are valued at fair value or nominal amounts.<br />
Grants that compensate the Group for expenses incurred are recognised in profit or loss as other income on a<br />
systematic basis in the same periods in which the expenses are recognised.<br />
ii.<br />
Cost is calculated using the weighted average cost formula and comprises all costs of purchase, costs of<br />
conversion and other costs incurred in bringing the inventories to their present location and condition. In the<br />
case of manufactured inventories and work-in-progress, cost includes an appropriate share of overheads based<br />
on normal operating capacity. Costs of inventories also include the transfer from other comprehensive income,<br />
if any, of gains or losses on qualifying cash flow hedges relating to purchases of raw materials.<br />
Net realisable value is the estimated selling price in the ordinary course of business less the estimated costs of<br />
completion and the estimated costs necessary to make the sale.<br />
Long-term Contracts<br />
The accounting policy for recognition of contract revenue is set out in Note 2(u)(ii).<br />
Long-term contracts-in-progress at the balance sheet date are recorded in the balance sheet at cost plus<br />
attributable profit less recognised losses, net of progress billings and allowance for foreseeable losses, and are<br />
presented in the balance sheet as “Work-in-progress” (as an asset) or “Excess of progress billings over workin-progress”<br />
(as a liability), as applicable. Long-term contract costs include the cost of direct materials, direct<br />
labour and costs incurred in connection with the project. When it is probable that total contract costs will<br />
exceed total contract revenue, the expected loss is recognised as an expense immediately.<br />
Progress billings not yet paid by the customer are included in the balance sheet under “Trade receivables”.<br />
Amounts received before progress billings are included in the balance sheet, as “Advance payments from<br />
customers”.<br />
ii. Jobs Credit Scheme<br />
Cash grants received from the government in relation to the Jobs Credit Scheme are recognised upon receipt.<br />
Such grants are provided to defray the wage costs incurred by the Group and are offset against staff costs in<br />
the financial statements.<br />
m. Impairment – Non-financial Assets<br />
The carrying amounts of the Group’s non-financial assets, other than inventories and deferred tax assets, are<br />
reviewed at each reporting date to determine whether there is any indication of impairment. If any such indication<br />
exists, the assets’ recoverable amounts are estimated. An impairment loss is recognised whenever the carrying<br />
amount of an asset or its cash-generating unit (CGU) exceeds its recoverable amount. A CGU is the smallest<br />
identifiable asset group that generates cash flows that largely are independent from other assets and groups.<br />
Impairment losses are recognised in profit or loss unless it reverses a previous revaluation that was credited to<br />
equity, in which case it is charged to equity. Impairment losses recognised in respect of CGUs are allocated first to<br />
reduce the carrying amount of any goodwill allocated to CGU (group of CGUs) and then, to reduce the carrying<br />
amount of the other assets in the CGU (group of CGUs) on a pro rata basis.<br />
Goodwill, intangible assets with indefinite useful lives and intangible assets not yet available for use are tested for<br />
impairment annually and as and when indicators of impairment occur.<br />
i. Calculation of Recoverable Amount<br />
The recoverable amount of an asset or CGU is the greater of its value in use and its fair value less costs to sell.<br />
In assessing value in use, the estimated future cash flows are discounted to their present value using a pre-tax<br />
discount rate that reflects current market assessments of the time value of money and the risks specific to the<br />
asset or CGU.<br />
Subject to an operating segment ceiling test, for the purposes of goodwill impairment testing, CGUs to which<br />
goodwill has been allocated are aggregated so that the level at which impairment testing is performed<br />
reflects the lowest level at which goodwill is monitored for internal reporting purposes. Goodwill acquired in<br />
a business combination is allocated to groups of CGUs that are expected to benefit from the synergies of the<br />
combination.<br />
156 SEMBCORP INDUSTRIES ANNUAL REPORT <strong>2011</strong><br />
GROWING SUSTAINABLE BUSINESSES 157
NOTES TO THE FINANCIAL STATEMENTS<br />
Year Ended December 31, <strong>2011</strong><br />
2. Summary of Significant Accounting Policies (cont’d)<br />
m. Impairment – Non-financial Assets (cont’d)<br />
ii. Reversals of Impairment<br />
An impairment loss in respect of goodwill is not reversed, even if it relates to an impairment loss recognised<br />
in an interim period that would have been reduced or avoided had the impairment assessment been made at<br />
a subsequent reporting or balance sheet date. In respect of other assets, impairment losses recognised in prior<br />
periods are assessed at each reporting date for any indications that the loss has decreased or no longer exists.<br />
An impairment loss is reversed if there has been a change in the estimates used to determine the recoverable<br />
amount. An impairment loss is reversed only to the extent that the assets’ carrying amount does not exceed<br />
the carrying amount that would have been determined, net of depreciation or amortisation, if no impairment<br />
loss had been recognised.<br />
Goodwill that forms part of the carrying amount of an investment in an associate or joint venture is not<br />
recognised separately, and therefore is not tested for impairment separately. Instead, the entire amount of the<br />
investment in an associate or joint venture is tested for impairment as a single asset when there is objective<br />
evidence that the investment in an associate or joint venture may be impaired.<br />
n. Non-derivative Financial Liabilities<br />
The Group initially recognises debt securities issued and subordinated liabilities on the date that they are originated.<br />
All other financial liabilities (including liabilities designated at fair value through profit or loss) are recognised<br />
initially on the trade date, which is the date that the Group becomes a party to the contractual provisions of the<br />
instrument.<br />
The Group derecognises a financial liability when its contractual obligations are discharged, cancelled or expired.<br />
The Group classifies non-derivative financial liabilities into the other financial liabilities category. Such financial<br />
liabilities are recognised initially at fair value plus any directly attributable transaction costs. Subsequent to initial<br />
recognition, these financial liabilities are measured at amortised cost using the effective interest method.<br />
Other financial liabilities comprise loans and borrowings, bank overdrafts, and trade and other payables.<br />
Bank overdrafts that are repayable on demand and form an integral part of the Group’s cash management are<br />
included as a component of cash and cash equivalents for the purpose of the statement of cash flows.<br />
o. Deferred Income<br />
When the Group receives advance payments from customers in respect of connection and capacity charges for the<br />
supply and delivery of gas and utilities, the Group recognises the deferred income to profit or loss on a straightline<br />
basis over the period stipulated in the respective customer contract commencing from the date of supply and<br />
delivery of gas and utilities.<br />
When the Group receives a deferred income and a financial asset as consideration for providing construction<br />
services in a service concession arrangement, the Group recognises the deferred income as the difference between<br />
the fair value of the construction services provided and the fair value of the financial asset received. The fair<br />
value of the construction services provided is estimated as the value of construction services at an arm’s length<br />
transaction between willing parties. The fair value of the financial asset received is estimated as the present value<br />
of the minimum guaranteed sum receivable from the grantor of the service concession which is discounted at the<br />
imputed rate of interest i.e. the prevailing rate of interest for a similar instrument of the grantor. On completion<br />
of the construction services, the deferred income in a service concession arrangement is amortised over the<br />
estimated useful life. Subsequent to initial recognition, the deferred income is measured at cost less accumulated<br />
amortisation.<br />
2. Summary of Significant Accounting Policies (cont’d)<br />
p. Employee Benefits<br />
i. Defined Contribution Plans<br />
Obligations for contributions to defined contribution plans are recognised as an expense in profit or loss as<br />
incurred.<br />
ii.<br />
Defined Benefit Plans<br />
The Group’s net obligation in respect of defined benefit pension plans is calculated separately for each defined<br />
benefit plan by estimating the amount of future benefit that employees have earned in return for their service<br />
in the current and prior periods; that benefit is discounted to determine the present value, and the fair value<br />
of any plan assets is deducted. The discount rate is the yield at balance sheet date on high quality bonds that<br />
have maturity dates approximating the terms of the Group’s obligations. The calculation is performed by a<br />
qualified actuary on a regular basis using a relevant actuarial method. In the intervening years the calculation<br />
is updated based on information received from the actuary.<br />
When the benefits of a plan change, the portion of the increased benefit relating to past service by employees<br />
is recognised as an expense in profit or loss on a straight-line basis over the average period until the benefits<br />
become vested. To the extent that the benefits vest immediately, the expense is recognised immediately in<br />
profit or loss.<br />
Actuarial gains and losses arise mainly from changes in actuarial assumptions and differences between actuarial<br />
assumptions and what has actually occurred. They are recognised in profit or loss, over the expected average<br />
remaining working lives of the employees participating in the plan, only to the extent that their cumulative<br />
amount exceeds 10% of the greater of the present value of the obligation and of the fair value of plan assets.<br />
Unrecognised actuarial gains and losses are reflected in the balance sheet.<br />
For defined benefit plans, the actuarial cost charged to profit or loss consists of current service cost, interest<br />
cost, expected return on plan assets and past service cost as well as actuarial gains or losses to the extent that<br />
they are recognised. The past service cost for the enhancement of pension benefits is accounted for when such<br />
benefit vests or becomes a constructive obligation.<br />
Where the calculation results in a benefit to the Group, the recognised asset is limited to the net total of any<br />
unrecognised actuarial losses and past service costs and the present value of any future refunds from the plan<br />
or reductions in future contributions to the plan.<br />
The Group recognises gains and losses on the curtailment or settlement of a defined benefit plan when the<br />
curtailment or settlement occurs. The gain or loss on curtailment comprises any resulting change in the fair<br />
value of plan assets, change in the present value of defined benefit obligation and any related actuarial gains<br />
and losses and past service cost that had not previously been recognised.<br />
iii. Short-term Employee Benefits<br />
Short-term employee benefit obligations are measured on an undiscounted basis and are expensed as the<br />
related employment service is provided.<br />
The amount expected to be paid is accrued when the Group has a present legal or constructive obligation<br />
to pay this amount as a result of past service provided by the employee and the obligation can be estimated<br />
reliably.<br />
158 SEMBCORP INDUSTRIES ANNUAL REPORT <strong>2011</strong><br />
GROWING SUSTAINABLE BUSINESSES 159
NOTES TO THE FINANCIAL STATEMENTS<br />
Year Ended December 31, <strong>2011</strong><br />
2. Summary of Significant Accounting Policies (cont’d)<br />
p. Employee Benefits (cont’d)<br />
iv. Staff Retirement Benefits<br />
Retirement benefits payable to certain categories of employees upon their retirement are provided for in<br />
the financial statements based on their entitlement under the staff retirement benefit plan or, in respect of<br />
unionised employees of a subsidiary who joined on or before December 31, 1988, based on an agreement with<br />
the union.<br />
The Group’s net obligation in respect of retirement benefits is the amount of future benefit that employees<br />
have earned in return for their service in the current and prior periods. The obligation is calculated using the<br />
projected future salary increase and is discounted to its present value and the fair value of any related assets<br />
is deducted.<br />
v. Equity and Equity-related Compensation Benefits<br />
Share Option Plan<br />
The share option programme allows the Group’s employees to acquire shares of the Group companies.<br />
The fair value is measured at grant date and spread over the period during which the employees become<br />
unconditionally entitled to the options. The fair value of options granted is recognised as an employee<br />
expense with a corresponding increase in equity. At each balance sheet date, the Company revises its estimates<br />
of the number of options that are expected to become exercisable. It recognises the impact of the revision<br />
of original estimates in employee expense and in a corresponding adjustment to equity over the remaining<br />
vesting period.<br />
The proceeds received net of any directly attributable transaction costs are credited to share capital when new<br />
shares are issued. The amount in the share-based payments reserve is retained when the option is exercised<br />
or expires.<br />
Where treasury shares are issued, the difference between the cost of treasury shares and the proceeds received<br />
net of any directly attributable costs are transferred to share-based payments reserve.<br />
Performance Share Plan<br />
The fair value of equity-related compensation is measured using the Monte Carlo simulation method as at the<br />
date of the grant. The method involves projecting future outcomes using statistical distributions of key random<br />
variables including the share prices and volatility of returns. This model takes into account the probability of<br />
achieving the performance conditions in the future.<br />
The fair value of the compensation cost is measured at grant date and amortised over the service period to<br />
which the performance criteria relates and the period during which the employees become unconditionally<br />
entitled to the shares. In estimating the fair value of the compensation cost, market-based performance<br />
conditions are taken into account. The compensation cost is charged to profit or loss with a corresponding<br />
increase in equity on a basis that fairly reflects the manner in which the benefits will accrue to the employee<br />
under the plan over the service period to which the performance period relates, irrespective of whether this<br />
performance condition is satisfied.<br />
2. Summary of Significant Accounting Policies (cont’d)<br />
p. Employee Benefits (cont’d)<br />
v. Equity and Equity-related Compensation Benefits (cont’d)<br />
Restricted Share Plan<br />
Similar to the Performance Share Plan, the fair value of equity-related compensation is measured using the<br />
Monte Carlo simulation method as at the date of the grant. The method involves projecting future outcomes<br />
using statistical distributions of key random variables including the share prices and volatility of returns. This<br />
model takes into account the probability of achieving the performance conditions in the future.<br />
The fair value of the compensation cost is measured at grant date and amortised over the service period to<br />
which the performance criteria relates and the period during which the employees become unconditionally<br />
entitled to the shares. In estimating the fair value of the compensation cost, non-market-based performance<br />
conditions are taken into account. The compensation cost is charged to profit or loss with a corresponding<br />
increase in equity on a basis that fairly reflects the manner in which the benefits will accrue to the employee<br />
under the plan over the service period to which the performance period relates.<br />
At the balance sheet date, the Company revises its estimates of the number of performance-based restricted<br />
shares that the employees are expected to receive based on the achievement of non-market performance<br />
conditions and the number of shares ultimately given. It recognises the impact of the revision of the original<br />
estimates in employee expense and in a corresponding adjustment to equity over the remaining vesting period.<br />
The share-based payments reserve relating to the restricted shares released is transferred to share capital when<br />
new shares are issued. When treasury shares are issued, the cost of treasury shares is transferred to share-based<br />
payments reserve.<br />
In the Company’s separate financial statements, the fair value of options, performance shares and restricted<br />
shares granted to employees of its subsidiaries is recognised as an increase in the cost of the Company’s<br />
investment in subsidiaries, with a corresponding increase in equity over the vesting period.<br />
vi. Cash-related Compensation Benefits<br />
<strong>Sembcorp</strong> Challenge Bonus<br />
The Group recognises a liability and an expense for bonuses and profit-sharing, based on a formula that<br />
takes into consideration the share price of the Company. The Group recognises a provision when contractually<br />
obliged to pay or where there is a past practice that has created a constructive obligation to pay.<br />
The compensation cost is measured at the fair value of the liability at each balance sheet date and spread<br />
over the service period to which the performance criteria relates and the period during which the employees<br />
become unconditionally entitled to the bonus. The liability takes into account the probability of achieving the<br />
performance conditions in the future.<br />
Until the liability is settled, the Group will re-measure the fair value of the liability at each balance sheet date<br />
and at the date of settlement with any changes in fair value recognised in profit or loss for the period.<br />
The share-based payments reserve relating to the performance shares released is transferred to share capital<br />
when new shares are issued. When treasury shares are issued, the cost of treasury shares is transferred to sharebased<br />
payments reserve.<br />
160 SEMBCORP INDUSTRIES ANNUAL REPORT <strong>2011</strong><br />
GROWING SUSTAINABLE BUSINESSES 161
NOTES TO THE FINANCIAL STATEMENTS<br />
Year Ended December 31, <strong>2011</strong><br />
2. Summary of Significant Accounting Policies (cont’d)<br />
q. Provisions<br />
A provision is recognised in the balance sheet when there is a present legal or constructive obligation as a result of<br />
a past event, the obligation can be reliably estimated and it is probable that an outflow of economic benefits will<br />
be required to settle the obligation. If the effect is material, provisions are determined by discounting the expected<br />
future cash flows at a pre-tax rate that reflects current market assessments of the time value of money and, where<br />
appropriate, the risks specific to the liability.<br />
r. Tax Expense<br />
Tax expense comprises current and deferred tax. Tax expense is recognised in profit or loss except to the extent<br />
that it relates to business combinations, or to items recognised directly in equity, in which case it is recognised in<br />
equity or in other comprehensive income.<br />
Current tax is the expected tax payable or receivable on the taxable income or loss for the year, using tax rates<br />
enacted or substantively enacted at the reporting date and any adjustment to tax payable in respect of previous<br />
years.<br />
Deferred tax is recognised in respect of temporary differences between the carrying amounts of assets and liabilities<br />
for financial reporting purposes and the amounts used for taxation purposes. Deferred tax is not recognised for the<br />
following temporary differences: the initial recognition of goodwill, the initial recognition of assets or liabilities<br />
in a transaction that is not a business combination and that affects neither accounting nor taxable profit or loss,<br />
and differences relating to investments in subsidiaries and joint ventures to the extent that they probably will not<br />
reverse in the foreseeable future. Deferred tax is measured at the tax rates that are expected to be applied to<br />
the temporary differences when they reverse, based on the laws that have been enacted or substantively enacted<br />
by the reporting date. Deferred tax assets and liabilities are offset if there is a legally enforceable right to offset<br />
current tax liabilities and assets and they relate to taxes levied by the same tax authority on the same taxable<br />
entity, or on different tax entities, but they intend to settle current tax liabilities and assets on a net basis or their<br />
tax assets and liabilities will be realised simultaneously.<br />
A deferred tax asset is recognised for unused tax losses, tax credits and deductible temporary differences, to the<br />
extent that it is probable that future taxable profits will be available against which they can be utilised. Deferred<br />
tax assets are reviewed at each reporting date and are reduced to the extent that it is no longer probable that the<br />
related tax benefit will be realised.<br />
s. Share Capital<br />
Ordinary shares are classified as equity.<br />
Incremental costs directly attributable to the issuance of new ordinary shares and share options are deducted<br />
against the share capital account, net of any tax effects.<br />
Where the Company’s ordinary shares are repurchased (treasury shares), the consideration paid, excluding any<br />
directly attributable incremental costs, is deducted from equity attributable to the Company’s equity holders and<br />
presented as reserve for own shares within equity, until they are cancelled, sold or reissued.<br />
When treasury shares are cancelled, the cost of treasury shares is deducted against the share capital account, if<br />
the shares are purchased out of capital of the Company, or against the accumulated profits of the Company, if the<br />
shares are purchased out of profits of the Company.<br />
2. Summary of Significant Accounting Policies (cont’d)<br />
s. Share Capital (cont’d)<br />
When treasury shares are subsequently sold or reissued pursuant to the Share-based Incentive Plans, the cost of the<br />
treasury shares is reversed from the reserve for own shares account and the realised gain or loss on sale or reissue,<br />
net of any directly attributable incremental transaction costs and related tax, is recognised as a change in equity<br />
of the Company. No gain or loss is recognised in profit or loss.<br />
Preference shares are classified as equity if it is non-redeemable. Preference shares are classified as a liability if they<br />
are redeemable on a specific date or at the option of the shareholders.<br />
t. Dividends<br />
Dividends on redeemable convertible preference share capital are recognised as a liability on an accrual basis.<br />
Dividends on ordinary shares are recognised when they are approved for payments.<br />
Dividends on redeemable convertible preference share capital classified as a liability are accounted for as finance<br />
costs. Dividends on ordinary shares and redeemable convertible preference share capital classified as equity are<br />
accounted for as movements in revenue reserve.<br />
u. Revenue Recognition<br />
i. Income on Goods Sold and Services Rendered<br />
Revenue from goods sold is recognised when the significant risks and rewards of ownership have been<br />
transferred to the buyer. Revenue from the provision of consultancy services is recognised using the percentage<br />
of completion method. The stage of completion is measured by reference to the percentage of cost incurred<br />
to-date to the estimated total costs for each project. Revenue on other service work is recognised when the<br />
work is completed. Revenue excludes goods and services or other sales taxes and is after deduction of any<br />
trade discounts. No revenue is recognised if there are significant uncertainties regarding recovery of the<br />
consideration due, associated costs or the possible return of goods.<br />
ii.<br />
Contract Revenue<br />
Revenue from repair work, engineering, overhaul, service work and marine and civil construction contracts<br />
is recognised based on percentage of completion. The percentage of completion is assessed by reference to<br />
surveys of work performed, or by reference to the ratio of costs incurred to-date to the estimated total costs for<br />
each contract, with due consideration given to the inclusion of only those costs that reflect work performed.<br />
When the outcome of a long-term contract can be estimated reliably, contract revenue and costs are recognised<br />
as income and expense respectively using the percentage of completion method. When the outcome of a longterm<br />
contract cannot be estimated reliably, revenue is recognised only to the extent of contract costs incurred<br />
that can probably be recovered and contract costs are recognised as an expense in the period in which they<br />
are incurred.<br />
iii. Sale of Electricity, Utilities and Gases<br />
Revenue from the sale of electricity, utilities and gases is measured at the fair value of the consideration received<br />
or receivable, net of returns and allowances, trade discounts and volume rebates. Revenue is recognised when<br />
electricity, utilities and gases are delivered based on contractual terms stipulated in respective agreements<br />
with customers.<br />
162 SEMBCORP INDUSTRIES ANNUAL REPORT <strong>2011</strong><br />
GROWING SUSTAINABLE BUSINESSES 163
NOTES TO THE FINANCIAL STATEMENTS<br />
Year Ended December 31, <strong>2011</strong><br />
2. Summary of Significant Accounting Policies (cont’d)<br />
u. Revenue Recognition (cont’d)<br />
iv. Service Concession Revenue<br />
Revenue relating to construction services under a service concession arrangement is recognised based on the<br />
stage of completion of the work performed, consistent with the Group’s accounting policy on recognising<br />
revenue on construction contracts (see (ii) above). Operation or service revenue is recognised in the period in<br />
which the services are provided by the Group. When the Group provides more than one service in a service<br />
concession arrangement, the consideration received is allocated by reference to the relative fair values of the<br />
services delivered.<br />
v. Rental Income<br />
Rental income receivable under operating lease is recognised in profit or loss on a straight-line basis over the<br />
term of the lease. Lease incentives granted are recognised as an integral part of total rental income, over the<br />
term of the lease.<br />
v. Dividend and Interest Income<br />
Dividend income is recognised in profit or loss on the date that the Group’s right to receive payment is established.<br />
Interest income is recognised as it accrues in profit or loss, using the effective interest rate method.<br />
w. Leases<br />
i. Operating Lease<br />
When entities within the Group are lessees of an operating lease<br />
Where the Group has the use of assets under operating leases, payments made under the leases are recognised<br />
in profit or loss on a straight-line basis over the term of the lease. Lease incentives received are recognised in<br />
profit or loss as an integral part of the total lease payments made.<br />
2. Summary of Significant Accounting Policies (cont’d)<br />
y. Segment <strong>Report</strong>ing<br />
An operating segment is a component of the Group that engages in business activities from which it may earn<br />
revenues and incur expenses, including revenues and expenses that relate to transactions with any of the Group’s<br />
other components. All operating segments’ operating results are reviewed regularly by the Group President &<br />
CEO to make decisions about resources to be allocated to the segment and assess its performance, and for which<br />
discrete financial information is available.<br />
Segment capital expenditure is the total cost incurred during the year to acquire property, plant and equipment,<br />
and intangible assets other than goodwill.<br />
z. Assets (or Disposal Groups) Held For Sale<br />
Non-current assets (or disposal groups) are classified as assets held for sale and measured at the lower of carrying<br />
amount and fair value less costs to sell if they are expected to be recovered principally through a sale transaction<br />
rather than through continuing use.<br />
Any impairment losses on initial classification and subsequent gains or losses on remeasurement are recognised in<br />
profit or loss. Subsequent increases in fair value less costs to sell are recognised in profit or loss (not exceeding the<br />
accumulated impairment loss that has been previously recognised).<br />
aa. Financial Guarantee Contracts<br />
Financial guarantee contracts are accounted for as insurance contracts and treated as contingent liabilities until<br />
such time as they become probable that the Company will be required to make a payment under the guarantee.<br />
A provision is recognised based on the Group’s estimate of the ultimate cost of settling all claims incurred but<br />
unpaid at the balance sheet date. The provision is assessed by reviewing individual claims and tested for adequacy<br />
by comparing the amount recognised and the amount that would be required to settle the guarantee contract.<br />
When entities within the Group are lessors of an operating lease<br />
Assets subject to operating leases are included in investment properties and are measured at cost less<br />
accumulated depreciation and impairment losses. Rental income (net of any incentives given to lessees) is<br />
recognised on a straight-line basis over the lease term.<br />
3. Share Capital<br />
Group and Company<br />
No. of ordinary shares<br />
Note <strong>2011</strong> 2010<br />
ii.<br />
Finance Lease<br />
When entities within the Group are lessors of a finance lease<br />
Amounts due from lessees under finance leases are recorded as receivables at the amount of the Group’s net<br />
investment in the leases. Finance lease income is allocated to accounting periods so as to reflect a constant<br />
periodic rate of return on the Group’s net investment outstanding in respect of the leases.<br />
Issued and fully paid, with no par value:<br />
At the beginning of the year 1,788,981,732 1,785,351,540<br />
Issue of shares (b) – 3,630,192<br />
Cancellation of shares (1,434,000) –<br />
At the end of the year 1,787,547,732 1,788,981,732<br />
x. Finance Costs<br />
Interest expense and similar charges are expensed in profit or loss in the period in which they are incurred, except<br />
to the extent that they are capitalised as being directly attributable to the acquisition, construction or production<br />
of an asset which necessarily takes a substantial period of time to prepare for its intended use or sale. The interest<br />
component of finance lease payments is recognised in profit or loss using the effective interest rate method.<br />
a. The holders of ordinary shares are entitled to receive dividends as declared from time to time and are entitled to one<br />
vote per share at meetings of the Company. All shares rank equally with regard to the Company’s residual assets.<br />
b. In 2010, 3,630,192 ordinary shares were issued as a result of acquisition of The China Water Company Limited<br />
(Note 38(ii)).<br />
c. Movements of the share capital account during the year are set out in the Consolidated Statement of Changes<br />
in Equity.<br />
164 SEMBCORP INDUSTRIES ANNUAL REPORT <strong>2011</strong><br />
GROWING SUSTAINABLE BUSINESSES 165
NOTES TO THE FINANCIAL STATEMENTS<br />
Year Ended December 31, <strong>2011</strong><br />
4. Share-based Incentive Plans<br />
The Company’s Performance Share Plan (SCI PSP 2010) and Restricted Share Plan (SCI RSP 2010) (collectively, the “2010<br />
Share Plans”) were approved and adopted by the shareholders at an Extraordinary General Meeting of the Company<br />
held on April 22, 2010. The 2010 Share Plans replaced the Share Plans which were approved and adopted by the<br />
shareholders at an Extraordinary General Meeting of the Company held on June 5, 2000 and expired in 2010.<br />
The Executive Resource & Compensation Committee (the “Committee”) of the Company has been designated as the<br />
Committee responsible for the administration of the Share Plans. The Committee comprises the following members,<br />
all of whom are directors:<br />
Ang Kong Hua (Chairman)<br />
Goh Geok Ling<br />
Margaret Lui<br />
The SCI RSP 2010 is the incentive scheme for directors and employees of the Group whereas SCI PSP 2010 is aimed<br />
primarily at key executives of the Group.<br />
The 2010 Share Plans are intended to increase the Company’s flexibility and effectiveness in its continuing efforts<br />
to attract, retain and incentivise participants to higher standards of performance and encourage greater dedication<br />
and loyalty by enabling the Company to give recognition to past contributions and services; as well as motivating<br />
participants to contribute to the long-term prosperity of the Group. The 2010 Share Plans will strengthen the Company’s<br />
competitiveness in attracting and retaining talented key senior management and senior executives.<br />
The SCI RSP 2010 is intended to apply to a broad base of senior executives as well as to the non-executive directors,<br />
while the SCI PSP 2010 is intended to apply to a select group of key senior management. Generally, it is envisaged that<br />
the range of performance targets to be set under the SCI RSP 2010 and the SCI PSP 2010 will be different, with the<br />
latter emphasising stretched or strategic targets aimed at sustaining longer term growth.<br />
The 2010 Share Plans will provide incentives to high performing key senior management and senior executives to excel<br />
in their performance and encourage greater dedication and loyalty to the Company. Through the 2010 Share Plans, the<br />
Company will be able to motivate key senior management and senior executives to continue to strive for the Group’s<br />
long-term shareholder value. In addition, the 2010 Share Plans aim to foster a greater ownership culture within the<br />
Group which align the interests of participants with the interests of shareholders, and to improve performance and<br />
achieve sustainable growth for the Company in the changing business environment.<br />
4. Share-based Incentive Plans (cont’d)<br />
A participant’s awards under the 2010 Share Plans will be determined at the sole discretion of the Committee. In<br />
considering an award to be granted to a participant, the Committee may take into account, inter alia, the participant’s<br />
performance during the relevant period, and his capability, entrepreneurship, scope of responsibility and skill set.<br />
Other information regarding the 2010 Share Plans and expired Share Plans is as follows:<br />
a. Share Option Plan<br />
Under the rules of the Share Option Plan, participants who ceased to be employed by the Group or the associated<br />
company by reason of ill health, injury or disability, redundancy, retirement at or after the legal retirement age,<br />
retirement before the legal retirement age, death, etc., or any other event approved by the Committee, may<br />
be allowed by the Committee to retain their unexercised options. The Committee may determine the number<br />
of shares comprised in that option which may be exercised and the period during which such option shall be<br />
exercisable, being a period not later than the expiry of the exercise period in respect of that option. Such option<br />
may be exercised at any time notwithstanding that the date of exercise of such option falls on a date prior to the<br />
first day of the exercise period in respect of such option.<br />
Other information regarding the Share Option Plans is as follows:<br />
i. The exercise price of the options can be set at market price or a discount to the market price not exceeding<br />
20% of the market price in respect of options granted at the time of grant. Market price is the volumeweighted<br />
average price for the shares on the Singapore Exchange Securities Trading Limited (SGX-ST) over the<br />
three consecutive trading days prior to grant date of that option. For all options granted to date, the exercise<br />
prices are set at market price.<br />
ii.<br />
After the first 12 months of lock-out period, the Group imposed a further vesting of 4 years for managers and<br />
above for retention purposes.<br />
iii. In <strong>2011</strong> and 2010, all options were settled by the issuance of treasury shares.<br />
iv. The options granted expire after 5 years for non-executive directors and associated company’s employees, and<br />
10 years for the employees of the Group. There are no outstanding share options for non-executive directors.<br />
The 2010 Share Plans use methods fairly common among major local and multinational companies to incentivise and<br />
motivate key senior management and senior executives to achieve pre-determined targets which create and enhance<br />
economic value for shareholders. The Company believes that the 2010 Share Plans will be effective tools in motivating<br />
key senior management and senior executives to strive to deliver long-term shareholder value.<br />
While the 2010 Share Plans cater principally to Group executives, it is recognised that there are other persons who can<br />
make significant contributions to the Group through their close working relationship with the Group. Such persons<br />
include employees of associated companies over which the Company has operational control.<br />
166 SEMBCORP INDUSTRIES ANNUAL REPORT <strong>2011</strong><br />
GROWING SUSTAINABLE BUSINESSES 167
NOTES TO THE FINANCIAL STATEMENTS<br />
Year Ended December 31, <strong>2011</strong><br />
4. Share-based Incentive Plans (cont’d)<br />
a. Share Option Plan (cont’d)<br />
At the end of the year, details of the options granted under the Share Option Plan on unissued ordinary shares of<br />
the Company are as follows:<br />
<strong>Sembcorp</strong> <strong>Industries</strong> Ltd<br />
Ordinary shares<br />
<strong>2011</strong><br />
Options<br />
Options cancelled / Options Options Options<br />
Date of grant Exercise price outstanding Options lapsed / outstanding exercisable exercisable<br />
of options per share at Jan 1, <strong>2011</strong> exercised not accepted at Dec 31, <strong>2011</strong> at Jan 1, <strong>2011</strong> at Dec 31, <strong>2011</strong> Exercise period<br />
19/04/2001 S$1.19 111,100 (81,100) (30,000) – 111,100 – 20/04/2002 to 19/04/<strong>2011</strong><br />
07/05/2002 S$1.23 160,750 (3,500) – 157,250 160,750 157,250 08/05/2003 to 07/05/2012<br />
17/10/2002 S$0.62 87,000 (34,500) – 52,500 87,000 52,500 18/10/2003 to 17/10/2012<br />
02/06/2003 S$0.78 97,600 (65,475) (1,125) 31,000 97,600 31,000 03/06/2004 to 02/06/2013<br />
18/11/2003 S$0.93 111,375 (37,375) (2,000) 72,000 111,375 72,000 19/11/2004 to 18/11/2013<br />
17/05/2004 S$0.99 206,750 (29,000) (3,500) 174,250 206,750 174,250 18/05/2005 to 17/05/2014<br />
22/11/2004 S$1.16 225,000 (44,250) (2,125) 178,625 225,000 178,625 23/11/2005 to 22/11/2014<br />
01/07/2005 S$2.37 792,700 (391,175) (17,875) 383,650 792,700 383,650 02/07/2006 to 01/07/2015<br />
21/11/2005 S$2.36 891,474 (222,349) (23,125) 646,000 891,474 646,000 22/11/2006 to 21/11/2015<br />
09/06/2006 S$2.52 175,000 (175,000) – – 175,000 – 10/06/2007 to 09/06/<strong>2011</strong><br />
09/06/2006 S$2.52 1,735,790 (519,376) (25,750) 1,190,664 1,735,790 1,190,664 10/06/2007 to 09/06/2016<br />
4,594,539 (1,603,100) (105,500) 2,885,939 4,594,539 2,885,939<br />
<strong>Sembcorp</strong> <strong>Industries</strong> Ltd<br />
Ordinary shares<br />
2010<br />
Options<br />
Options cancelled / Options Options Options<br />
Date of grant Exercise price outstanding Options lapsed / outstanding exercisable exercisable<br />
of options per share at Jan 1, 2010 exercised not accepted at Dec 31, 2010 at Jan 1, 2010 at Dec 31, 2010 Exercise period<br />
26/06/2000 S$1.63 188,723 (127,523) (61,200) – 188,723 – 27/06/2001 to 26/06/2010<br />
19/04/2001 S$1.19 122,750 (11,650) – 111,100 122,750 111,100 20/04/2002 to 19/04/<strong>2011</strong><br />
07/05/2002 S$1.23 189,125 (28,375) – 160,750 189,125 160,750 08/05/2003 to 07/05/2012<br />
17/10/2002 S$0.62 91,250 (4,250) – 87,000 91,250 87,000 18/10/2003 to 17/10/2012<br />
02/06/2003 S$0.78 105,225 (6,625) (1,000) 97,600 105,225 97,600 03/06/2004 to 02/06/2013<br />
18/11/2003 S$0.93 130,125 (18,750) – 111,375 130,125 111,375 19/11/2004 to 18/11/2013<br />
17/05/2004 S$0.99 292,275 (84,525) (1,000) 206,750 292,275 206,750 18/05/2005 to 17/05/2014<br />
22/11/2004 S$1.16 376,275 (148,275) (3,000) 225,000 376,275 225,000 23/11/2005 to 22/11/2014<br />
01/07/2005 S$2.37 91,875 (91,875) – – 91,875 – 02/07/2006 to 01/07/2010<br />
01/07/2005 S$2.37 1,316,952 (513,752) (10,500) 792,700 1,316,952 792,700 02/07/2006 to 01/07/2015<br />
21/11/2005 S$2.36 135,625 (135,625) – – 135,625 – 22/11/2006 to 21/11/2010<br />
21/11/2005 S$2.36 1,550,076 (645,602) (13,000) 891,474 1,550,076 891,474 22/11/2006 to 21/11/2015<br />
09/06/2006 S$2.52 385,000 (210,000) – 175,000 271,250 175,000 10/06/2007 to 09/06/<strong>2011</strong><br />
09/06/2006 S$2.52 2,742,135 (974,595) (31,750) 1,735,790 1,955,385 1,735,790 10/06/2007 to 09/06/2016<br />
7,717,411 (3,001,422) (121,450) 4,594,539 6,816,911 4,594,539<br />
168 SEMBCORP INDUSTRIES ANNUAL REPORT <strong>2011</strong><br />
GROWING SUSTAINABLE BUSINESSES 169
NOTES TO THE FINANCIAL STATEMENTS<br />
Year Ended December 31, <strong>2011</strong><br />
4. Share-based Incentive Plans (cont’d)<br />
a. Share Option Plan (cont’d)<br />
At the end of the financial year, details of the options granted under the Share Option Plan on unissued ordinary<br />
shares of <strong>Sembcorp</strong> Marine Ltd are as follows:<br />
<strong>Sembcorp</strong> Marine Ltd<br />
Ordinary shares<br />
<strong>2011</strong><br />
Options<br />
Options cancelled / Options Options Options<br />
Date of grant Exercise price outstanding at Options lapsed / outstanding exercisable exercisable<br />
of options per share Jan 1, <strong>2011</strong> exercised not accepted at Dec 31, <strong>2011</strong> at Jan 1, <strong>2011</strong> at Dec 31, <strong>2011</strong> Exercise period<br />
27/09/2001 S$0.47 54,810 (21,210) (33,600) – 54,810 – 28/09/2002 to 27/09/<strong>2011</strong><br />
07/11/2002 S$0.64 161,700 (31,500) (4,550) 125,650 161,700 125,650 08/11/2003 to 07/11/2012<br />
08/08/2003 S$0.71 216,470 (132,200) (10,850) 73,420 216,470 73,420 09/08/2004 to 08/08/2013<br />
10/08/2004 S$0.74 1,723,958 (1,427,648) (55,300) 241,010 1,723,958 241,010 11/08/2005 to 10/08/2014<br />
11/08/2005 S$2.11 4,213,877 (2,617,027) (93,100) 1,503,750 4,213,877 1,503,750 12/08/2006 to 11/08/2015<br />
02/10/2006 S$2.38 191,750 (191,750) – – 191,750 – 03/10/2007 to 02/10/<strong>2011</strong> *<br />
02/10/2006 S$2.38 4,918,409 (3,046,002) (15,925) 1,856,482 4,918,409 1,856,482 03/10/2007 to 02/10/2016<br />
11,480,974 (7,467,337) (213,325) 3,800,312 11,480,974 3,800,312<br />
* Applicable to non-executive directors of the Company only.<br />
<strong>Sembcorp</strong> Marine Ltd<br />
Ordinary shares<br />
2010<br />
Options<br />
Options cancelled / Options Options Options<br />
Date of grant Exercise price outstanding Options lapsed / outstanding exercisable exercisable<br />
of options per share at Jan 1, 2010 exercised not accepted at Dec 31, 2010 at Jan 1, 2010 at Dec 31, 2010 Exercise period<br />
08/09/2000 S$0.50 191,170 (53,890) (137,280) – 191,170 – 08/09/2001 to 07/09/2010<br />
27/09/2001 S$0.47 99,610 (42,000) (2,800) 54,810 99,610 54,810 28/09/2002 to 27/09/<strong>2011</strong><br />
07/11/2002 S$0.64 308,450 (142,550) (4,200) 161,700 308,450 161,700 08/11/2003 to 07/11/2012<br />
08/08/2003 S$0.71 878,220 (661,550) (200) 216,470 878,220 216,470 09/08/2004 to 08/08/2013<br />
10/08/2004 S$0.74 2,598,278 (868,920) (5,400) 1,723,958 2,598,278 1,723,958 11/08/2005 to 10/08/2004<br />
11/08/2005 S$2.11 203,000 (203,000) – – 203,000 – 12/08/2006 to 11/08/2010 *<br />
11/08/2005 S$2.11 7,035,787 (2,790,560) (31,350) 4,213,877 7,035,787 4,213,877 12/08/2006 to 11/08/2015<br />
02/10/2006 S$2.38 588,000 (396,250) – 191,750 453,250 191,750 03/10/2007 to 02/10/<strong>2011</strong> *<br />
02/10/2006 S$2.38 8,335,653 (3,311,179) (106,065) 4,918,409 5,774,379 4,918,409 03/10/2007 to 02/10/2016<br />
20,238,168 (8,469,899) (287,295) 11,480,974 17,542,144 11,480,974<br />
* Applicable to non-executive directors of the Company only.<br />
Except as disclosed above, there were no unissued shares of the Company or its subsidiaries under options granted<br />
by the Company or its subsidiaries as at the end of the financial year.<br />
170 SEMBCORP INDUSTRIES ANNUAL REPORT <strong>2011</strong><br />
GROWING SUSTAINABLE BUSINESSES 171
NOTES TO THE FINANCIAL STATEMENTS<br />
Year Ended December 31, <strong>2011</strong><br />
4. Share-based Incentive Plans (cont’d)<br />
a. Share Option Plan (cont’d)<br />
<strong>Sembcorp</strong> <strong>Industries</strong> Ltd’s options exercised in <strong>2011</strong> and 2010 were all settled by way of issuance of treasury shares.<br />
<strong>Sembcorp</strong> <strong>Industries</strong> Ltd’s options were exercised on a regular basis throughout the year. The weighted average<br />
share price during the year was S$4.65 (2010: S$4.26).<br />
<strong>Sembcorp</strong> Marine Ltd’s options exercised in <strong>2011</strong> resulted in 7,467,337 (2010: 8,469,899) ordinary shares being<br />
issued at a weighted average price of S$1.93 (2010: S$1.94). <strong>Sembcorp</strong> Marine Ltd’s options were exercised on a<br />
regular basis throughout the year. The weighted average share price during the year was S$3.84 (2010: S$4.12).<br />
Fair value of share options<br />
The fair value of services received is measured by reference to the fair value of share options granted.<br />
b. Performance Share Plan<br />
Under the Performance Share Plan (SCI PSP 2010), the awards granted conditional on performance targets are<br />
set based on medium-term corporate objectives at the start of each rolling three-year performance qualifying<br />
period. A specific number of performance shares shall be awarded at the end of the three-year performance cycle<br />
depending on the extent of the achievement of the performance conditions established at the onset.<br />
The performance levels were calibrated based on Wealth Added and Total Shareholder Return. A minimum<br />
threshold performance must be achieved to trigger an achievement factor, which in turn determines the number<br />
of shares to be finally awarded. Performance shares to be delivered will range between 0% to 150% of the<br />
conditional performance shares awarded.<br />
To create alignment between senior management and other employees at the time of vesting, SCI PSP 2010 has<br />
in place a plan trigger. Under this trigger mechanism, the performance shares for the performance period <strong>2011</strong> to<br />
2013 will be vested to the senior management participants only if the restricted shares for the performance period<br />
2012 to 2013 are vested, subject to the achievement of the performance conditions for the respective performance<br />
periods.<br />
Senior management participants are required to hold a minimum percentage of the shares released to them<br />
under the Performance Share Plan to maintain a beneficial ownership stake in the Group, for the duration of their<br />
employment or tenure with the Group. A maximum cap is set based on a multiple of the individual participant’s<br />
annual base salary. Any excess can be sold off, but in the event of a shortfall, they have a two calendar year period<br />
to meet the minimum percentage requirement.<br />
4. Share-based Incentive Plans (cont’d)<br />
b. Performance Share Plan (cont’d)<br />
i. <strong>Sembcorp</strong> <strong>Industries</strong> Ltd Performance Shares<br />
The details of the movement of the performance shares of <strong>Sembcorp</strong> <strong>Industries</strong> Ltd awarded during the year<br />
are as follows:<br />
<strong>2011</strong> 2010<br />
At January 1 2,611,665 2,640,862<br />
Conditional performance shares awarded 820,000 1,000,000<br />
Conditional performance shares lapsed (205,832) (761,578)<br />
Conditional performance shares released (592,500) (267,619)<br />
At December 31 2,633,333 2,611,665<br />
With the Committee’s approval on the achievement factor for the achievement of the performance targets<br />
for the performance period 2008 to 2010 (2010: performance period 2007 to 2009), a total of 592,500 (2010:<br />
267,619) performance shares were released via the issuance of treasury shares.<br />
The total number of performance shares in awards granted conditionally and representing 100% of targets<br />
to be achieved, but not released as at end <strong>2011</strong>, was 2,633,333 (2010: 2,611,665). Based on the multiplying<br />
factor, the actual release of the awards could range from zero to a maximum of 3,950,000 (2010: 3,917,498)<br />
performance shares.<br />
ii. Performance shares of a listed subsidiary<br />
The details of the movement of the performance shares of <strong>Sembcorp</strong> Marine Ltd awarded during the year are<br />
as follows:<br />
<strong>2011</strong> 2010<br />
At January 1 1,970,000 2,315,000<br />
Conditional performance shares awarded 585,000 635,000<br />
Conditional performance shares lapsed (242,916) –<br />
Additional performance shares awarded arising from targets met 385,000 235,200<br />
Conditional performance shares released (932,084) (1,215,200)<br />
At December 31 1,765,000 1,970,000<br />
No performance shares of <strong>Sembcorp</strong> Marine Ltd were awarded to the directors of the Company.<br />
With the <strong>Sembcorp</strong> Marine Ltd’s committee’s approval on the achievement factor for the achievement of the<br />
performance targets for the performance period 2008 to 2010 (2010: performance period 2007 to 2009), a total<br />
of 932,084 (2010: 1,215,200) performance shares were released via the issuance of treasury shares.<br />
In <strong>2011</strong>, there were additional 385,000 (2010: 235,200) performance shares awarded for over-achievement of<br />
the performance targets for the performance period 2008 to 2010 (2010: performance period 2007 to 2009).<br />
The total number of performance shares in awards granted conditionally and representing 100% of targets<br />
to be achieved, but not released as at December 31, <strong>2011</strong>, was 1,765,000 (2010: 1,970,000). Based on the<br />
multiplying factor, the actual release of the awards could range from zero to a maximum of 2,647,500 (2010:<br />
2,955,000) performance shares.<br />
172 SEMBCORP INDUSTRIES ANNUAL REPORT <strong>2011</strong><br />
GROWING SUSTAINABLE BUSINESSES 173
NOTES TO THE FINANCIAL STATEMENTS<br />
Year Ended December 31, <strong>2011</strong><br />
4. Share-based Incentive Plans (cont’d)<br />
b. Performance Share Plan (cont’d)<br />
Fair value of performance shares<br />
The fair values of the performance shares are estimated using a Monte Carlo simulation methodology at the grant<br />
dates.<br />
The fair values of performance shares granted during the year are as follows:<br />
Fair value of Fair value of Fair value of Fair value of<br />
<strong>Sembcorp</strong> <strong>Sembcorp</strong> <strong>Sembcorp</strong> <strong>Sembcorp</strong><br />
<strong>Industries</strong> Ltd <strong>Industries</strong> Ltd Marine Ltd Marine Ltd<br />
performance performance performance performance<br />
shares shares shares shares<br />
granted on granted on granted on granted on<br />
April 29, <strong>2011</strong> April 8, 2010 July 15, <strong>2011</strong> April 19, 2010<br />
Fair value at measurement date S$3.44 S$2.71 S$3.40 S$3.62<br />
Assumptions under the Monte Carlo model<br />
Share price S$5.40 S$4.19 S$5.28 S$4.36<br />
Expected volatility:<br />
<strong>Sembcorp</strong> <strong>Industries</strong> Ltd / <strong>Sembcorp</strong> Marine Ltd 33.4% 32.1% 29.8% 31.8%<br />
Morgan Stanley Capital International (MSCI)<br />
AC Asia Pacific excluding Japan Industrials Index 38.1% 22.4% 24.1% 21.4%<br />
Correlation with MSCI 85.8% 80.7% 85.1% 79.5%<br />
Risk-free interest rate 0.5% 0.7% 0.4% 0.7%<br />
Expected dividend 3.4% 3.8% 2.9% 3.4%<br />
The expected volatility is based on the historical volatility over the most recent period that is close to the expected<br />
life of the performance shares.<br />
During the year, the Group charged S$4,579,000 (2010: S$3,790,000) to the profit or loss based on the fair value of<br />
the performance shares at the grant date being expensed over the vesting period.<br />
c. Restricted Share Plan<br />
Under the Restricted Share Plan (SCI RSP 2010), the awards granted conditional on performance targets are set<br />
based on corporate objectives at the start of each rolling two-year performance qualifying period. The performance<br />
criteria for the restricted shares are calibrated based on Return on Total Assets (excluding <strong>Sembcorp</strong> Marine Ltd)<br />
and Group Profit from Operations (excluding <strong>Sembcorp</strong> Marine Ltd) for awards granted in <strong>2011</strong>.<br />
A minimum threshold performance must be achieved to trigger an achievement factor, which in turn determines<br />
the number of shares to be finally awarded. Based on the criteria, restricted shares to be delivered will range from<br />
0% to 150% of the conditional restricted shares awarded.<br />
The managerial participants of the Group will be awarded restricted shares under SCI RSP 2010, while the nonmanagerial<br />
participants of the Group will receive their awards in an equivalent cash value. This cash-settled<br />
notional restricted shares award for non-managerial participants is known as the <strong>Sembcorp</strong> Challenge Bonus.<br />
4. Share-based Incentive Plans (cont’d)<br />
c. Restricted Share Plan (cont’d)<br />
A specific number of restricted shares shall be awarded at the end of the two-year performance cycle depending<br />
on the extent of the achievement of the performance conditions established at the onset. There is a further vesting<br />
period of three years after the performance period, during which one-third of the awarded shares are released<br />
each year to managerial participants. Non-managerial participants will receive the equivalent in cash at the end of<br />
the two-year performance cycle, with no further vesting conditions.<br />
Senior management participants are required to hold a minimum percentage of the shares released to them<br />
under the Restricted Share Plan to maintain a beneficial ownership stake in the Group, for the duration of their<br />
employment or tenure with the Group. A maximum cap is set based on a multiple of the individual participant’s<br />
annual base salary. Any excess can be sold off, but in the event of a shortfall, they have a two calendar year period<br />
to meet the minimum percentage requirement.<br />
For the year 2010, the awards granted under the SCI RSP 2010 to non-executive directors were time-based shares<br />
which vest 1 year from the date of grant.<br />
To align the interests of the non-executive directors with the interests of shareholders, up to 30% of the aggregate<br />
directors’ fees approved by shareholders for a particular financial year may be paid out in the form of restricted<br />
share awards under the SCI RSP 2010.<br />
For year <strong>2011</strong>, non-executive directors were not awarded any shares except as part of their directors’ fees (except<br />
for Mr Tang Kin Fei, who is the Group President & CEO, and who does not receive any directors’ fees). The awards<br />
granted will consist of the grant of fully paid shares outright with no performance and vesting conditions attached,<br />
but with a selling moratorium. Non-executive directors are required to hold shares (including shares obtained by<br />
other means) worth at least one-time the annual base retainer; any excess may be sold as desired. A non-executive<br />
director can dispose of all of his shares one year after leaving the Board.<br />
The actual number of shares to be awarded to each non-executive director will be determined by reference to the<br />
volume-weighted average price of a share on the SGX-ST over the 14 trading days immediately following the date<br />
of the <strong>Annual</strong> General Meeting (AGM). The number of shares to be awarded will be rounded down to the nearest<br />
hundred and any residual balance will be settled in cash.<br />
i. <strong>Sembcorp</strong> <strong>Industries</strong> Ltd Restricted Shares<br />
The details of the movement of the restricted shares of <strong>Sembcorp</strong> <strong>Industries</strong> Ltd awarded during the year are<br />
as follows:<br />
<strong>2011</strong> 2010<br />
At January 1 5,515,446 5,038,846<br />
Conditional restricted shares awarded 2,305,800 2,268,500<br />
Conditional restricted shares lapsed (267,668) (330,628)<br />
Additional restricted shares awarded arising from targets met 399,560 –<br />
Conditional restricted shares released (1,782,809) (1,461,272)<br />
At December 31 6,170,329 5,515,446<br />
174 SEMBCORP INDUSTRIES ANNUAL REPORT <strong>2011</strong><br />
GROWING SUSTAINABLE BUSINESSES 175
NOTES TO THE FINANCIAL STATEMENTS<br />
Year Ended December 31, <strong>2011</strong><br />
4. Share-based Incentive Plans (cont’d)<br />
c. Restricted Share Plan (cont’d)<br />
i. <strong>Sembcorp</strong> <strong>Industries</strong> Ltd Restricted Shares (cont’d)<br />
With the Committee’s approval on the achievement factor for the achievement of the performance targets for<br />
the performance period 2009 to 2010, a total of 872,309 restricted shares were released in <strong>2011</strong>. For awards<br />
in relation to the performance period 2008 to 2009, a total of 548,312 (2010: 736,370) restricted shares were<br />
released in <strong>2011</strong>. For awards in relation to the performance period 2007 to 2008, a total of 279,488 (2010:<br />
359,706) restricted shares were released in <strong>2011</strong>. For awards in relation to the performance period 2006 to<br />
2007, nil (2010: 311,950) restricted shares were released in <strong>2011</strong>. In <strong>2011</strong>, there were 82,700 shares released to<br />
non-executive directors. In 2010, there were additional 53,246 restricted shares released to employees upon<br />
retirement. The restricted shares were released via the issuance of treasury shares.<br />
In <strong>2011</strong>, additional 399,560 (2010: nil) restricted shares were awarded for the over-achievement of the<br />
performance targets for the performance period 2009 to 2010 (2010: performance period 2008 to 2009).<br />
The total number of restricted shares outstanding, including award(s) achieved but not released, as at end <strong>2011</strong>,<br />
was 6,170,329 (2010: 5,515,446). Of this, the total number of restricted shares in awards granted conditionally<br />
and representing 100% of targets to be achieved, but not released was 4,244,200 (2010: 4,097,300). Based on<br />
the multiplying factor, the actual release of the conditional awards could range from zero to a maximum of<br />
6,366,300 (2010: 6,145,950) restricted shares.<br />
<strong>Sembcorp</strong> Challenge Bonus<br />
With the Committee’s approval on the achievement factor for the achievement of the performance targets<br />
for the performance period 2009 to 2010 (2010: performance period 2008 to 2009), a total of S$2,661,000,<br />
equivalent to 494,042 (2010: S$1,511,000, equivalent to 358,784) notional restricted shares, were paid. A total<br />
of 600,000 (2010: 600,000) notional restricted shares of <strong>Sembcorp</strong> <strong>Industries</strong> Ltd’s shares were awarded in <strong>2011</strong><br />
for the <strong>Sembcorp</strong> Challenge Bonus.<br />
The total number of notional restricted shares in awards for the <strong>Sembcorp</strong> Challenge Bonus granted<br />
conditionally and representing 100% of targets to be achieved, but not released as at end <strong>2011</strong>, was 1,200,000<br />
(2010: 1,200,000). Based on the multiplying factor, the number of notional restricted shares to be converted<br />
into the funding pool could range from zero to a maximum of 1,800,000 (2010: 1,800,000).<br />
ii. Restricted shares of a listed subsidiary<br />
The details of the movement of the restricted shares of <strong>Sembcorp</strong> Marine Ltd awarded during the year are as<br />
follows:<br />
4. Share-based Incentive Plans (cont’d)<br />
c. Restricted Share Plan (cont’d)<br />
ii. Restricted shares of a listed subsidiary (cont’d)<br />
With the <strong>Sembcorp</strong> Marine Ltd’s committee’s approval on the achievement factor for the achievement of the<br />
performance targets for the performance period 2009 to 2010, a total of 1,888,581 restricted shares were<br />
released in <strong>2011</strong>. For awards in relation to the performance period 2008 to 2009, a total of 1,531,500 (2010:<br />
1,791,238) restricted shares were released in <strong>2011</strong>. For awards in relation to the performance period 2007 to<br />
2008, a total of 1,502,177 (2010: 1,561,953) restricted shares were released in <strong>2011</strong>. For awards in relation to<br />
the performance period 2006 to 2007, a total of 16,413 (2010: 575,764) restricted shares were released in <strong>2011</strong>.<br />
In <strong>2011</strong>, there were 103,600 restricted shares released to non-executive directors. The restricted shares were<br />
either released via the issuance of treasury shares or the issuance of new shares.<br />
In <strong>2011</strong>, additional 1,641,205 (2010: 1,675,250) <strong>Sembcorp</strong> Marine Ltd’s restricted shares were awarded for the<br />
over-achievement of the performance targets for the performance period 2009 to 2010 (2010: performance<br />
period 2008 to 2009).<br />
The total number of <strong>Sembcorp</strong> Marine Ltd’s restricted shares outstanding, including awards achieved but not<br />
released, as at December 31, <strong>2011</strong>, was 10,150,285 (2010: 11,380,303). Of this, the total number of restricted<br />
shares in awards granted conditionally and representing 100% of targets to be achieved, but not released was<br />
6,242,400 (2010: 6,615,930). Based on the multiplying factor, the actual release of the awards could range from<br />
zero to a maximum of 9,363,600 (2010: 9,923,895) restricted shares.<br />
Challenge Bonus of a listed subsidiary<br />
With the <strong>Sembcorp</strong> Marine Ltd’s committee’s approval on the achievement factor for the achievement of the<br />
performance targets for the performance period 2009 to 2010 (2010: performance period 2008 to 2009), a<br />
total of S$7,336,725 (2010: S$3,785,714), equivalent to 1,373,250 (2010: 1,030,600) notional restricted shares,<br />
were paid.<br />
A total of 1,122,200 (2010: 1,234,400) notional restricted shares were awarded on July 15, <strong>2011</strong> (2010: April 19,<br />
2010) for the <strong>Sembcorp</strong> Marine Challenge Bonus.<br />
The total number of notional restricted shares in awards for the <strong>Sembcorp</strong> Marine Challenge Bonus granted<br />
conditionally and representing 100% of targets to be achieved, but not released as at December 31, <strong>2011</strong>, was<br />
2,167,200 (2010: 2,149,950). Based on the multiplying factor, the number of notional restricted shares to be<br />
converted into the funding pool could range from zero to a maximum of 3,250,800 (2010: 3,224,925).<br />
<strong>2011</strong> 2010<br />
At January 1 11,380,303 10,406,962<br />
Conditional restricted shares awarded 3,085,800 3,494,200<br />
Conditional restricted shares lapsed (914,752) (267,154)<br />
Additional restricted shares awarded arising from targets met 1,641,205 1,675,250<br />
Conditional restricted shares released (5,042,271) (3,928,955)<br />
At December 31 10,150,285 11,380,303<br />
176 SEMBCORP INDUSTRIES ANNUAL REPORT <strong>2011</strong><br />
GROWING SUSTAINABLE BUSINESSES 177
NOTES TO THE FINANCIAL STATEMENTS<br />
Year Ended December 31, <strong>2011</strong><br />
4. Share-based Incentive Plans (cont’d)<br />
c. Restricted Share Plan (cont’d)<br />
ii. Restricted shares of a listed subsidiary (cont’d)<br />
Fair value of restricted shares<br />
The fair values of the restricted shares are estimated using a Monte Carlo simulation methodology at the grant<br />
dates.<br />
The fair values of restricted shares granted during the year are as follows:<br />
Fair value of Fair value of Fair value of Fair value of<br />
<strong>Sembcorp</strong> <strong>Sembcorp</strong> <strong>Sembcorp</strong> <strong>Sembcorp</strong><br />
<strong>Industries</strong> Ltd <strong>Industries</strong> Ltd Marine Ltd Marine Ltd<br />
restricted shares restricted shares restricted shares restricted shares<br />
granted on granted on granted on granted on<br />
April 29, <strong>2011</strong> April 8, 2010 July 15, <strong>2011</strong> April 19, 2010<br />
Fair value at measurement date S$3.94 S$2.48 S$4.36 S$2.62<br />
Assumptions under the Monte Carlo model<br />
Share price S$5.40 S$4.19 S$5.28 S$4.36<br />
Expected volatility:<br />
<strong>Sembcorp</strong> <strong>Industries</strong> Ltd / <strong>Sembcorp</strong> Marine Ltd 33.4% 32.1% 29.8% 31.8%<br />
Risk-free interest rate 0.4% – 0.7% 0.6% – 0.9% 0.3% – 0.5% 0.5% – 0.8%<br />
Expected dividend 3.4% 3.8% 2.9% 3.4%<br />
The expected volatility is based on the historical volatility over the most recent period that is close to the<br />
expected life of the restricted shares.<br />
During the year, the Group charged S$21,980,000 (2010: S$17,839,000) to the profit or loss based on the fair<br />
value of restricted shares at the grant date being expensed over the vesting period.<br />
Fair value of <strong>Sembcorp</strong> Challenge Bonus<br />
During the year, the Group charged S$6,761,000 (2010: S$11,580,000) to the profit or loss based on the market<br />
values of the shares at the balance sheet date. The fair value of the compensation cost is based on the notional<br />
number of restricted shares awarded for <strong>Sembcorp</strong> Challenge Bonus and the market price at the vesting date.<br />
5. (Deficit) / Surplus in Other Reserves<br />
Group<br />
Company<br />
<strong>2011</strong> 2010 <strong>2011</strong> 2010<br />
Note S$’000 S$’000 S$’000 S$’000<br />
Reserve for own shares (a) (18,455) (5,668) (18,455) (5,668)<br />
Currency translation reserve (b) (229,340) (230,754) – –<br />
Other reserves (c) 201,473 393,010 8,571 15,537<br />
(46,322) 156,588 (9,884) 9,869<br />
5. (Deficit) / Surplus in Other Reserves<br />
b. Currency Translation Reserve<br />
The currency translation reserve comprises:<br />
i. foreign exchange differences arising from the translation of the financial statements of foreign operations<br />
whose functional currencies are different from the presentation currency of the Group;<br />
ii.<br />
exchange differences on monetary items which form part of the Group’s net investment in foreign operations;<br />
and<br />
iii. gains or losses on instruments used to hedge the Company’s net investment in foreign operations that are<br />
determined to be effective hedges.<br />
c. Other Reserves<br />
Group<br />
Company<br />
Share-based<br />
Share-based<br />
Capital Merger payments Fair value Hedging payments<br />
reserve reserve reserve reserve reserve Total reserve<br />
S$’000 S$’000 S$’000 S$’000 S$’000 S$’000 S$’000<br />
At January 1, <strong>2011</strong> 338,152 29,201 12,753 96,216 (83,312) 393,010 15,537<br />
Share-based payments – – 19,564 – – 19,564 9,010<br />
Treasury shares transferred<br />
to employees – – (15,976) – – (15,976) (15,976)<br />
Treasury shares of a subsidiary (6,413) – (19,443) – – (25,856) –<br />
Realisation of reserve<br />
upon disposal<br />
of investments 2,846 – 14 9 – 2,869 –<br />
Net change in fair value<br />
of cash flow hedges – – – – (58,836) (58,836) –<br />
Net change in fair value<br />
of cash flow hedges<br />
transferred to profit or loss – – – – (27,112) (27,112) –<br />
Net change in fair value<br />
of available-for-sale<br />
financial assets – – – (80,331) – (80,331) –<br />
Share of other<br />
comprehensive income<br />
of associates<br />
and joint ventures – – – – (5,859) (5,859) –<br />
At December 31, <strong>2011</strong> 334,585 29,201 (3,088) 15,894 (175,119) 201,473 8,571<br />
a. Reserve for Own Shares<br />
At December 31, <strong>2011</strong>, the Company held 3,929,773 (2010: 1,231,692) of its own uncancelled shares as treasury<br />
shares.<br />
178 SEMBCORP INDUSTRIES ANNUAL REPORT <strong>2011</strong><br />
GROWING SUSTAINABLE BUSINESSES 179
NOTES TO THE FINANCIAL STATEMENTS<br />
Year Ended December 31, <strong>2011</strong><br />
5. (Deficit) / Surplus in Other Reserves (cont’d)<br />
c. Other Reserves (cont’d)<br />
Group<br />
Company<br />
5. (Deficit) / Surplus in Other Reserves (cont’d)<br />
c. Other Reserves (cont’d)<br />
Other reserves include:<br />
Share-based<br />
Share-based<br />
Capital Merger payments Fair value Hedging payments<br />
reserve reserve reserve reserve reserve Total reserve<br />
S$’000 S$’000 S$’000 S$’000 S$’000 S$’000 S$’000<br />
At January 1, 2010 332,988 29,201 22,676 34,651 (74,601) 344,915 20,405<br />
Share-based payments – – 15,829 – – 15,829 7,364<br />
Treasury shares transferred<br />
to employees – – (12,232) – – (12,232) (12,232)<br />
Treasury shares of<br />
a subsidiary 15,498 – (13,520) – – 1,978 –<br />
Acquisition of non-controlling<br />
interests without a<br />
change in control (10,486) – – – – (10,486) –<br />
Net change in fair value<br />
of cash flow hedges – – – – (7,458) (7,458) –<br />
Net change in fair value<br />
of cash flow hedges<br />
transferred to<br />
profit or loss – – – – (6,570) (6,570) –<br />
Net change in fair value<br />
of cash flow hedges<br />
transferred to<br />
initial carrying value<br />
of hedged items – – – – 2,798 2,798 –<br />
Net change in fair value<br />
of available-for-sale<br />
financial assets – – – 61,565 – 61,565 –<br />
Share of other comprehensive<br />
income of associates<br />
and joint ventures 152 – – – 2,519 2,671 –<br />
At December 31, 2010 338,152 29,201 12,753 96,216 (83,312) 393,010 15,537<br />
i. Capital reserve comprises acquisitions and disposals with non-controlling interests that do not result in a<br />
change of control, capitalisation of accumulated profits for the issue of bonus shares, capital reserve (net of<br />
goodwill) on consolidation and equity accounting, capital redemption reserve, convertible loan stock reserve<br />
and transfer from revenue reserve in accordance with the regulations of the foreign jurisdiction in which the<br />
Group’s subsidiaries, associates and joint ventures operate, and treasury shares of a subsidiary.<br />
ii.<br />
Merger reserve represents the difference between the value of shares issued by the Company in exchange for<br />
the value of shares acquired in respect of the acquisition of subsidiaries accounted for under the pooling-ofinterest<br />
method.<br />
iii. Share-based payments reserve comprises the cumulative value of services received from employees recorded<br />
on grant of equity-settled share options, performance shares and performance based restricted shares. The<br />
expense for service received is recognised over the performance period and / or vesting period.<br />
iv. Fair value reserve includes the cumulative net change in the fair value of available-for-sale investments until<br />
the investments are derecognised.<br />
v. Hedging reserve comprises the effective portion of the cumulative net change in the fair value of cash flow<br />
hedging instruments related to hedged transactions that have not yet occurred.<br />
180 SEMBCORP INDUSTRIES ANNUAL REPORT <strong>2011</strong><br />
GROWING SUSTAINABLE BUSINESSES 181
NOTES TO THE FINANCIAL STATEMENTS<br />
Year Ended December 31, <strong>2011</strong><br />
6. Property, Plant and Equipment<br />
Leasehold and<br />
Furniture,<br />
freehold land, Tools and fittings and Capital<br />
wet berthage Improvements Quays and Plant and workshop office work-inand<br />
buildings to premises dry docks Infrastructure machinery Marine vessels equipment equipment Motor vehicles progress Total<br />
Note S$’000 S$’000 S$’000 S$’000 S$’000 S$’000 S$’000 S$’000 S$’000 S$’000 S$’000<br />
Group<br />
Cost / Valuation<br />
Balance at January 1, <strong>2011</strong> 791,557 41,020 356,232 251,282 2,737,946 16,738 39,904 120,351 53,508 807,980 5,216,518<br />
Translation adjustments (4,156) (218) (1) (7,151) (2,088) – (27) (352) (843) 4,741 (10,095)<br />
Additions 5,462 2,745 520 14,697 88,924 496 4,318 9,186 8,948 918,018 1,053,314<br />
Reclassification 22,741 1,464 – 387 183,011 116 (506) 525 305 (208,043) –<br />
Transfer from / (to) intangible assets 16 3,858 – – 822 (573) – – 23 88 (214) 4,004<br />
Disposals / Write-offs (10,824) (491) (257) (7,803) (22,259) – (309) (6,160) (5,463) (384) (53,950)<br />
Balance at December 31, <strong>2011</strong> 808,638 44,520 356,494 252,234 2,984,961 17,350 43,380 123,573 56,543 1,522,098 6,209,791<br />
Accumulated Depreciation<br />
and Impairment Losses<br />
Balance at January 1, <strong>2011</strong> 287,171 25,527 168,268 3,489 1,113,048 9,476 31,938 98,901 40,121 – 1,777,939<br />
Translation adjustments (2,430) (271) – (1,424) (2,871) – (13) (245) (448) – (7,702)<br />
Depreciation for the year 35(b) 26,613 2,581 20,244 7,226 146,476 847 3,637 10,840 3,955 – 222,419<br />
Reclassification (1,143) (8) – 79 1,283 – (236) 5 20 – –<br />
Transfer from / (to) intangible assets 16 1,864 – – 146 (1,253) – – (4) (3) – 750<br />
Disposals / Write-offs (8,990) (486) (49) (6,345) (21,177) – (306) (5,828) (5,158) – (48,339)<br />
Allowance (reversed) /<br />
made for impairment – net 35(b) (186) – – – 15,335 – – – – – 15,149<br />
Balance at December 31, <strong>2011</strong> 302,899 27,343 188,463 3,171 1,250,841 10,323 35,020 103,669 38,487 – 1,960,216<br />
Carrying Amount<br />
At December 31, <strong>2011</strong> 505,739 17,177 168,031 249,063 1,734,120 7,027 8,360 19,904 18,056 1,522,098 4,249,575<br />
182 SEMBCORP INDUSTRIES ANNUAL REPORT <strong>2011</strong><br />
GROWING SUSTAINABLE BUSINESSES 183
NOTES TO THE FINANCIAL STATEMENTS<br />
Year Ended December 31, <strong>2011</strong><br />
6. Property, Plant and Equipment (cont’d)<br />
Leasehold and<br />
Furniture,<br />
freehold land, Tools and fittings and Capital<br />
wet berthage Improvements Quays and Plant and workshop office work-inand<br />
buildings to premises dry docks Infrastructure machinery Marine vessels equipment equipment Motor vehicles progress Total<br />
Note S$’000 S$’000 S$’000 S$’000 S$’000 S$’000 S$’000 S$’000 S$’000 S$’000 S$’000<br />
Group<br />
Cost / Valuation<br />
Balance at January 1, 2010 787,356 38,969 329,794 – 2,614,767 16,219 36,234 112,317 54,399 336,381 4,326,436<br />
Translation adjustments (12,699) (149) (13) (4,431) (66,089) – (94) (1,204) (463) (37,568) (122,710)<br />
Additions 2,858 169 26,451 5,912 17,746 305 668 6,214 6,095 592,389 658,807<br />
Reclassification (93,978) 2,091 – (418) 172,390 309 3,276 1,273 (1,435) (83,508) –<br />
Transfer to assets held for sale 21 – – – – (80,864) – – – – – (80,864)<br />
Disposals / Write-offs (3,062) (60) – (853) (16,526) (95) (180) (2,343) (9,731) (2,997) (35,847)<br />
Acquisition of subsidiaries 38 111,082 – – 251,072 96,522 – – 4,094 4,643 3,283 470,696<br />
Balance at December 31, 2010 791,557 41,020 356,232 251,282 2,737,946 16,738 39,904 120,351 53,508 807,980 5,216,518<br />
Accumulated Depreciation<br />
and Impairment Losses<br />
Balance at January 1, 2010 272,509 22,965 148,964 – 1,012,667 8,674 28,797 93,385 41,527 2,872 1,632,360<br />
Translation adjustments (2,647) (70) (9) (203) (20,759) – (69) (868) (273) (36) (24,934)<br />
Depreciation for the year 35(b) 27,328 2,463 19,313 4,337 165,598 809 3,377 9,909 3,263 – 236,397<br />
Reclassification (9,137) 77 – 39 8,772 – – (824) 1,073 – –<br />
Transfer to assets held for sale 21 – – – – (44,648) – – – – – (44,648)<br />
Disposals / Write-offs (2,913) (60) – (684) (9,059) (7) (167) (2,231) (8,520) (2,836) (26,477)<br />
Allowance made for impairment – net 35(b) 2,031 152 – – 477 – – (470) 3,051 – 5,241<br />
Balance at December 31, 2010 287,171 25,527 168,268 3,489 1,113,048 9,476 31,938 98,901 40,121 – 1,777,939<br />
Carrying Amount<br />
At December 31, 2010 504,386 15,493 187,964 247,793 1,624,898 7,262 7,966 21,450 13,387 807,980 3,438,579<br />
184 SEMBCORP INDUSTRIES ANNUAL REPORT <strong>2011</strong><br />
GROWING SUSTAINABLE BUSINESSES 185
NOTES TO THE FINANCIAL STATEMENTS<br />
Year Ended December 31, <strong>2011</strong><br />
6. Property, Plant and Equipment (cont’d)<br />
Leasehold and<br />
Furniture,<br />
freehold land, fittings and Capital<br />
wet berthage Improvements Quays and Plant and office work-inand<br />
buildings to premises dry docks machinery equipment Motor vehicles progress Total<br />
Note S$’000 S$’000 S$’000 S$’000 S$’000 S$’000 S$’000 S$’000<br />
Company<br />
Cost<br />
Balance at January 1, <strong>2011</strong> 19,828 2,243 8,280 510,495 11,488 929 1,978 555,241<br />
Additions 29 1,759 – 10,460 1,405 – 19,319 32,972<br />
Reclassification – – – 1,431 201 – (1,632) –<br />
Transfer to intangible assets 16 – – – – (113) – (100) (213)<br />
Intercompany transfer – – – – (2) – – (2)<br />
Disposals / Write-offs (37) (5) (54) (287) (504) – (187) (1,074)<br />
Balance at December 31, <strong>2011</strong> 19,820 3,997 8,226 522,099 12,475 929 19,378 586,924<br />
Accumulated Depreciation<br />
and Impairment Losses<br />
Balance at January 1, <strong>2011</strong> 2,765 2,097 1,222 86,644 8,714 455 – 101,897<br />
Depreciation for the year 965 356 405 31,390 1,707 170 – 34,993<br />
Transfer to intangible assets 16 – – – – (3) – – (3)<br />
Intercompany transfer – – – – (1) – – (1)<br />
Disposals / Write-offs (7) – (8) (101) (505) – – (621)<br />
Allowance made for impairment – net – – – 394 – – – 394<br />
Balance at December 31, <strong>2011</strong> 3,723 2,453 1,619 118,327 9,912 625 – 136,659<br />
Carrying Amount<br />
At December 31, <strong>2011</strong> 16,097 1,544 6,607 403,772 2,563 304 19,378 450,265<br />
Company<br />
Cost<br />
Balance at January 1, 2010 19,832 2,193 8,280 492,874 9,777 929 16,967 550,852<br />
Additions – 1 – 2,553 1,475 – 2,634 6,663<br />
Reclassification – 110 – 16,329 621 – (17,060) –<br />
Disposals / Write-offs (4) (61) – (1,261) (385) – (563) (2,274)<br />
Balance at December 31, 2010 19,828 2,243 8,280 510,495 11,488 929 1,978 555,241<br />
Accumulated Depreciation<br />
and Impairment Losses<br />
Balance at January 1, 2010 1,801 2,099 814 55,768 7,415 280 – 68,177<br />
Depreciation for the year 966 58 408 31,042 1,681 175 – 34,330<br />
Disposals / Write-offs (2) (60) – (166) (382) – – (610)<br />
Balance at December 31, 2010 2,765 2,097 1,222 86,644 8,714 455 – 101,897<br />
Carrying Amount<br />
At December 31, 2010 17,063 146 7,058 423,851 2,774 474 1,978 453,344<br />
186 SEMBCORP INDUSTRIES ANNUAL REPORT <strong>2011</strong><br />
GROWING SUSTAINABLE BUSINESSES 187
NOTES TO THE FINANCIAL STATEMENTS<br />
Year Ended December 31, <strong>2011</strong><br />
6. Property, Plant and Equipment (cont’d)<br />
Group<br />
During the year, management noted indications of impairment with respect to a plant due to changes in projected<br />
operating costs updated based on market movements and management expectations. The Group tested the plant<br />
for impairment. The recoverable amount of the plant was based on calculations of its value-in-use (VIU) and was<br />
determined by discounting the future cash flows generated from the continuing use of the plant. These calculations<br />
use cash flow projections from years 2012 to 2021, which are based on financial budgets / forecasts approved by<br />
management. No terminal value was assumed and a pre-tax discount rate of 5.6% has been used. Forward HSFO rates<br />
were used to estimate the variable revenue and costs of direct materials for the cash flow projections. The impairment<br />
loss of S$14,935,000 was recognised in cost of sales.<br />
i. Property, plant and equipment with the following net book values have been pledged to secure loan facilities<br />
granted to subsidiaries:<br />
ii.<br />
Group<br />
<strong>2011</strong> 2010<br />
Freehold land and buildings 23,152 24,506<br />
Leasehold land and buildings 40,481 39,627<br />
Plant and machinery 548,963 438,912<br />
Capital work-in-progress 635,020 368,496<br />
Other assets 1,091 1,241<br />
1,248,707 872,782<br />
Assets with net book value of S$10,868,000 (2010: S$14,485,000) were acquired under finance lease.<br />
iii. Included in the cost of leasehold land and buildings, quays and dry docks and plant and machinery are amounts<br />
of S$120,866,000, S$100,900,000 and S$667,000 (2010: S$120,866,000, S$100,900,000 and S$667,000) respectively<br />
which were measured at valuation as determined by firms of professional valuers. Also included in the cost of quays<br />
and dry docks is an amount of S$25,152,000 (2010: S$25,152,000) which was measured at Directors’ valuation.<br />
These revaluations were done on a one-off basis prior to January 1, 1997.<br />
iv. During the year, interest and direct staff costs amounting to S$64,729,000 (2010: S$28,767,000) and S$8,225,000<br />
(2010: S$5,133,000), respectively were capitalised as capital work-in-progress.<br />
S$’000<br />
S$’000<br />
7. Investment Properties<br />
Group<br />
<strong>2011</strong> 2010<br />
Note S$’000 S$’000<br />
Cost<br />
Balance at January 1 45,802 46,703<br />
Translation adjustments (153) (901)<br />
Disposals (28) –<br />
Balance at December 31 45,621 45,802<br />
Accumulated Depreciation and Impairment Losses<br />
Balance at January 1 21,690 20,100<br />
Depreciation for the year 35(b) 924 1,027<br />
Allowance made for impairment – net 35(b) – 563<br />
Balance at December 31 22,614 21,690<br />
Carrying Amount<br />
At December 31 23,007 24,112<br />
Investment properties with net book value of S$9,211,000 (2010: S$9,392,000) have been pledged to secure loan<br />
facilities granted to a subsidiary. See Note 29 for details on pledge on investment properties.<br />
The fair value of the investment properties as at the balance sheet date is S$54,485,000 (2010: S$53,563,000). The fair<br />
values are mostly determined by independent professional valuers. In the absence of current prices in an active market,<br />
the fair values are determined by considering the aggregate of the estimated cash flow expected to be received from<br />
renting out the properties or Directors’ valuation. A yield that reflects the specific risks inherent in the cash flows is<br />
then applied to the net annual cash flows to obtain the fair values.<br />
8. Investments in Subsidiaries<br />
Company<br />
<strong>2011</strong> 2010<br />
At cost and carrying value:<br />
Quoted equity shares 713,048 713,048<br />
Unquoted equity shares 453,912 453,912<br />
Preference shares 387,500 387,500<br />
Share-based payments reserve 6,779 8,786<br />
1,561,239 1,563,246<br />
S$’000<br />
S$’000<br />
The fair value of the equity interest of the listed subsidiary with carrying amount of S$713,048,000 (2010: S$713,048,000),<br />
amounts to S$4,833,716,318 (2010: S$6,795,041,002) based on the last transacted market price as at December 31, <strong>2011</strong><br />
(December 31, 2010).<br />
Details of significant subsidiaries are set out in Note 48.<br />
188 SEMBCORP INDUSTRIES ANNUAL REPORT <strong>2011</strong><br />
GROWING SUSTAINABLE BUSINESSES 189
NOTES TO THE FINANCIAL STATEMENTS<br />
Year Ended December 31, <strong>2011</strong><br />
9. Interests in Associates<br />
Group<br />
<strong>2011</strong> 2010<br />
S$’000<br />
S$’000<br />
10. Interests in Joint Ventures<br />
Group<br />
<strong>2011</strong> 2010<br />
S$’000<br />
S$’000<br />
Interests in associates 843,127 686,601<br />
The carrying value as at year end includes goodwill on acquisition as follows:<br />
Interests in joint ventures 501,573 347,427<br />
The carrying value as at year end includes goodwill on acquisition as follows:<br />
Group<br />
<strong>2011</strong> 2010<br />
Balance at beginning of the year 358 55<br />
Addition during the year – 303<br />
Balance at end of the year 358 358<br />
The fair value of the equity interest of a listed associate, with a carrying amount of S$205,025,000 (2010: S$203,240,000),<br />
amounts to S$138,494,000 (2010: S$282,758,000) based on the last transacted market price as at December 31, <strong>2011</strong><br />
(December 31, 2010).<br />
Summarised financial information of associates is as follows:<br />
S$’000<br />
Group<br />
S$’000<br />
<strong>2011</strong> 2010<br />
Combined results<br />
Turnover 6,444,647 5,080,801<br />
Profit for the year 266,272 250,796<br />
Combined assets and liabilities<br />
Total assets 11,928,662 10,392,303<br />
Total liabilities 8,478,677 7,280,760<br />
The summarised financial information relating to associates disclosed above is not adjusted for the percentage of<br />
ownership held by the Group.<br />
The Group’s interest in an associate has been pledged to banks to secure credit facilities granted to the associate.<br />
Details of the significant associates are set out in Note 49.<br />
S$’000<br />
S$’000<br />
Group<br />
<strong>2011</strong> 2010<br />
Balance at beginning of the year 1,740 1,855<br />
Translation during the year (5) (115)<br />
Balance at end of the year 1,735 1,740<br />
Summarised financial information of joint ventures, representing the Group’s share, is as follows:<br />
S$’000<br />
Group’s share<br />
S$’000<br />
<strong>2011</strong> 2010<br />
Combined results<br />
Turnover 458,402 364,690<br />
Expenses (364,900) (281,330)<br />
Profit before tax 93,502 83,360<br />
Tax expense (13,556) (8,900)<br />
Profit for the year 79,946 74,460<br />
Combined assets and liabilities<br />
Non-current assets 598,262 435,569<br />
Current assets 406,943 286,584<br />
Current liabilities (164,980) (131,298)<br />
Non-current liabilities (331,961) (240,514)<br />
Non-controlling interests (8,426) (4,654)<br />
Net assets 499,838 345,687<br />
Capital commitments 65,892 37,451<br />
The Group’s interest in a joint venture with a carrying amount of S$56,736,000 (2010: S$55,439,000) as at the balance<br />
sheet date has been pledged to banks to secure credit facilities granted to the joint venture entity.<br />
S$’000<br />
S$’000<br />
Details of significant joint ventures are set out in Note 49.<br />
190 SEMBCORP INDUSTRIES ANNUAL REPORT <strong>2011</strong><br />
GROWING SUSTAINABLE BUSINESSES 191
NOTES TO THE FINANCIAL STATEMENTS<br />
Year Ended December 31, <strong>2011</strong><br />
11. Other Financial Assets<br />
Group<br />
Company<br />
<strong>2011</strong> 2010 <strong>2011</strong> 2010<br />
S$’000 S$’000 S$’000 S$’000<br />
a. Non-current Assets<br />
Available-for-sale financial assets:<br />
– Equity shares 131,607 291,512 – –<br />
– Unit trusts and funds 1,300 1,382 – –<br />
132,907 292,894 – –<br />
Financial assets at fair value through profit or loss,<br />
on initial recognition:<br />
– Interest rate swaps 11,412 – – –<br />
– Equity shares 17 12 – –<br />
Cash flow hedges:<br />
– Forward foreign exchange contracts 885 31,767 – –<br />
– Fuel oil swaps 59 256 – –<br />
145,280 324,929 – –<br />
b. Current Assets<br />
Financial assets at fair value through profit or loss,<br />
on initial recognition:<br />
– Forward foreign exchange contracts 330 2,335 – 24<br />
– Foreign exchange swap contracts 3,914 2,614 – –<br />
Cash flow hedges:<br />
– Forward foreign exchange contracts 7,842 38,653 – –<br />
– Fuel oil swaps 4,459 2,680 – –<br />
16,545 46,282 – 24<br />
12. Long-term Receivables and Prepayments<br />
Group<br />
Company<br />
<strong>2011</strong> 2010 <strong>2011</strong> 2010<br />
Note S$’000 S$’000 S$’000 S$’000<br />
Long-term trade receivables 13 881 645 – –<br />
Service concession receivables (a) 253,438 223,917 – –<br />
Finance lease receivables due after 12 months 14 6,999 10,832 – –<br />
Amounts due from related parties 15 79,483 79,311 – –<br />
Staff loans 92 125 – –<br />
Loan and receivables 41(b) 340,893 314,830 – –<br />
Prepayments (b) 36,080 28,385 7,730 729<br />
Defined benefit assets 28(b) 3,491 2,490 – –<br />
380,464 345,705 7,730 729<br />
12. Long-term Receivables and Prepayments (cont’d)<br />
a. Service concession receivables<br />
The subsidiaries in Singapore, Chile and Panama each has entered into service concession arrangements with<br />
the local Governments. Under these arrangements, the subsidiaries are to supply treated water to the local<br />
Governments for periods ranging from 25 years to 30 years. All of these arrangements fall within the scope of INT<br />
FRS 112.<br />
The significant aspects of the service concession arrangements are as follows:<br />
i. The service concession agreements entered into with the respective local Governments ranges from 25 years to<br />
30 years;<br />
ii.<br />
Under the terms of the agreements, the subsidiaries will receive a minimum guaranteed sum from the grantors<br />
in exchange for services performed. The subsidiaries recognised these as financial receivables as they have<br />
contractual rights under the concession arrangements. The financial receivables are measured on initial<br />
recognition at their fair value using interest rates ranging from 3.5% to 12.0%; and<br />
iii. Upon expiry of the concession arrangements, the assets are to be transferred to the local Governments.<br />
b. Prepayments<br />
Prepayments relate primarily to:<br />
Group<br />
i. Connection fees prepaid under the Generation Connection and Use of System Agreement for the use of the<br />
transmission lines; and<br />
ii.<br />
Service fees prepaid under the Gasoil Supply and Storage Agreement for the usage of the tank.<br />
Company<br />
i. Prepayments relate to connection and capacity charges prepaid for the use of pipelines and piperacks.<br />
ii.<br />
Prepayments are charged to profit or loss on a straight-line basis over the period of prepayments.<br />
13. Trade Receivables<br />
Group<br />
Company<br />
<strong>2011</strong> 2010 <strong>2011</strong> 2010<br />
Note S$’000 S$’000 S$’000 S$’000<br />
Trade receivables including work completed<br />
but unbilled 563,153 314,440 33,686 24,810<br />
Allowance for doubtful receivables (19,195) (19,061) – –<br />
543,958 295,379 33,686 24,810<br />
Trade receivables due within 1 year 19 (543,077) (294,734) (33,686) (24,810)<br />
12 881 645 – –<br />
192 SEMBCORP INDUSTRIES ANNUAL REPORT <strong>2011</strong><br />
GROWING SUSTAINABLE BUSINESSES 193
NOTES TO THE FINANCIAL STATEMENTS<br />
Year Ended December 31, <strong>2011</strong><br />
14. Finance Lease Receivables<br />
Minimum Estimated Total gross Unearned Net value<br />
lease residual investment interest of lease<br />
payment value in lease income receivables<br />
Note S$’000 S$’000 S$’000 S$’000 S$’000<br />
Group<br />
<strong>2011</strong><br />
Within 1 year 4,219 – 4,219 (386) 3,833<br />
After 1 year but within 5 years 4,219 3,000 7,219 (220) 6,999<br />
8,438 3,000 11,438 (606) 10,832<br />
Amount due within 1 year 19 (4,219) – (4,219) 386 (3,833)<br />
12 4,219 3,000 7,219 (220) 6,999<br />
2010<br />
Within 1 year 4,218 – 4,218 (545) 3,673<br />
After 1 year but within 5 years 8,438 3,000 11,438 (606) 10,832<br />
12,656 3,000 15,656 (1,151) 14,505<br />
Amount due within 1 year 19 (4,218) – (4,218) 545 (3,673)<br />
12 8,438 3,000 11,438 (606) 10,832<br />
Under the terms of the lease agreements, no contingent rents are recognised. These lease receivables relate mainly to<br />
leases of marine vessels, whereby the lessees have the option to purchase the marine vessels during the term of the<br />
leases.<br />
15. Amounts Due from Related Parties<br />
Associates Joint ventures Related companies Non-controlling interests Total<br />
<strong>2011</strong> 2010 <strong>2011</strong> 2010 <strong>2011</strong> 2010 <strong>2011</strong> 2010 <strong>2011</strong> 2010<br />
Note S$’000 S$’000 S$’000 S$’000 S$’000 S$’000 S$’000 S$’000 S$’000 S$’000<br />
Group<br />
Amounts due from:<br />
Trade 4,028 4,888 18,966 6,860 986 – 31 38 24,011 11,786<br />
Non-trade 1,719 3,091 13,582 13,702 – – – – 15,301 16,793<br />
Loans 31,365 46,225 49,154 38,426 – – – – 80,519 84,651<br />
37,112 54,204 81,702 58,988 986 – 31 38 119,831 113,230<br />
Allowance for<br />
doubtful receivables (1,709) (7,928) (13,246) (13,219) 38 – – – (14,917) (21,147)<br />
35,403 46,276 68,456 45,769 1,024 – 31 38 104,914 92,083<br />
Amount due within 1 year 19 (5,074) (5,391) (19,302) (7,343) (1,024) – (31) (38) (25,431) (12,772)<br />
12 30,329 40,885 49,154 38,426 – – – – 79,483 79,311<br />
The non-trade amount due from related parties are unsecured, repayable on demand and interest-free.<br />
The loans to associates are unsecured, not expected to be repaid in the next 12 months and bear interest rates of 0.88%<br />
(2010: 0.39% to 0.93%) per annum.<br />
The loan to a joint venture is unsecured, not expected to be repaid in the next 12 months and bears interest at floating<br />
rates of 0.14% to 0.39% (2010: 0.56%) per annum.<br />
194 SEMBCORP INDUSTRIES ANNUAL REPORT <strong>2011</strong><br />
GROWING SUSTAINABLE BUSINESSES 195
NOTES TO THE FINANCIAL STATEMENTS<br />
Year Ended December 31, <strong>2011</strong><br />
15. Amounts Due from Related Parties (cont’d)<br />
Subsidiaries Associates Joint ventures Related companies Total<br />
<strong>2011</strong> 2010 <strong>2011</strong> 2010 <strong>2011</strong> 2010 <strong>2011</strong> 2010 <strong>2011</strong> 2010<br />
Note S$’000 S$’000 S$’000 S$’000 S$’000 S$’000 S$’000 S$’000 S$’000 S$’000<br />
16. Intangible Assets (cont’d)<br />
Service<br />
concession<br />
Goodwill arrangement Others Total<br />
Note S$’000 S$’000 S$’000 S$’000<br />
Company<br />
Amounts due from<br />
related parties 8,435 5,738 104 523 304 119 232 – 9,075 6,380<br />
19 8,435 5,738 104 523 304 119 232 – 9,075 6,380<br />
The amounts due from related parties are unsecured, repayable on demand and interest-free.<br />
16. Intangible Assets<br />
Service Intellectual<br />
concession property<br />
Goodwill arrangement rights Others Total<br />
Note S$’000 S$’000 S$’000 S$’000 S$’000<br />
Group<br />
Cost<br />
Balance at January 1, <strong>2011</strong> 141,708 127,749 – 52,741 322,198<br />
Translation adjustments (1) (2,900) – (2,434) (5,335)<br />
Additions – 3,740 33,559 1,279 38,578<br />
Transfer (to) / from property,<br />
plant and equipment 6 – (4,336) – 332 (4,004)<br />
Reclassification – 24,013 – (24,013) –<br />
Write-offs 35(b) – – – (86) (86)<br />
Balance at December 31, <strong>2011</strong> 141,707 148,266 33,559 27,819 351,351<br />
Accumulated Amortisation<br />
and Impairment Losses<br />
Balance at January 1, <strong>2011</strong> 1,980 2,775 – 5,609 10,364<br />
Translation adjustments (79) (489) – (993) (1,561)<br />
Amortisation charge for the year 35(b) – 6,394 2,685 2,394 11,473<br />
Impairment loss 35(b) – – – 5 5<br />
Transfer (to) / from property,<br />
plant and equipment 6 – (758) – 8 (750)<br />
Reclassification – 2,183 – (2,183) –<br />
Write-offs 35(b) – – – (63) (63)<br />
Balance at December 31, <strong>2011</strong> 1,901 10,105 2,685 4,777 19,468<br />
Carrying Amount<br />
At December 31, <strong>2011</strong> 139,806 138,161 30,874 23,042 331,883<br />
Group<br />
Cost<br />
Balance at January 1, 2010 109,896 – 7,910 117,806<br />
Translation adjustments (2,491) (6,490) 168 (8,813)<br />
Acquisition of subsidiaries 38 34,303 132,241 43,818 210,362<br />
Additions – 1,998 962 2,960<br />
Disposals – – (10) (10)<br />
Write-offs 35(b) – – (107) (107)<br />
Balance at December 31, 2010 141,708 127,749 52,741 322,198<br />
Accumulated Amortisation and Impairment Losses<br />
Balance at January 1, 2010 – – 3,567 3,567<br />
Translation adjustments – (401) 508 107<br />
Amortisation charge for the year 35(b) – 3,176 1,539 4,715<br />
Impairment loss 35(b) 1,980 – – 1,980<br />
Write-offs 35(b) – – (5) (5)<br />
Balance at December 31, 2010 1,980 2,775 5,609 10,364<br />
Carrying Amount<br />
At December 31, 2010 139,728 124,974 47,132 311,834<br />
Goodwill Others Total<br />
Note S$’000 S$’000 S$’000<br />
Company<br />
Cost<br />
Balance at January 1, <strong>2011</strong> 18,946 179 19,125<br />
Additions – 410 410<br />
Transfer from property, plant and equipment 6 – 213 213<br />
Balance at December 31, <strong>2011</strong> 18,946 802 19,748<br />
Accumulated Amortisation and Impairment Losses<br />
Balance at January 1, <strong>2011</strong> – 28 28<br />
Amortisation charge for the year – 202 202<br />
Transfer from property, plant and equipment 6 – 3 3<br />
Balance at December 31, <strong>2011</strong> – 233 233<br />
Carrying Amount<br />
At December 31, <strong>2011</strong> 18,946 569 19,515<br />
196 SEMBCORP INDUSTRIES ANNUAL REPORT <strong>2011</strong><br />
GROWING SUSTAINABLE BUSINESSES 197
NOTES TO THE FINANCIAL STATEMENTS<br />
Year Ended December 31, <strong>2011</strong><br />
16. Intangible Assets (cont’d)<br />
16. Intangible Assets (cont’d)<br />
• Upon expiry of the concession, the assets are to be transferred to the local municipality at no cost. Goodwill Others Total<br />
Service concession arrangements (cont’d)<br />
S$’000 S$’000 S$’000<br />
• The tariffs in the South Africa subsidiaries are subject to review every 5 years. The tariffs are adjusted annually<br />
with an escalation formula based on costs specified in the contract. Tariff adjustments have to be approved by the<br />
Company<br />
Cost<br />
Balance at January 1, 2010 18,946 90 19,036<br />
Local Municipality in the city where the project is located; the tariffs in China are regulated by the Administrative<br />
Measures on Pricing of Municipal Water Supply issued by the State Development and Reform Commission (SDRC).<br />
Tariffs adjustments have to be approved by the Water Supply Company and Price Bureau, the local institution<br />
Additions – 170 170<br />
controlling prices under the SDRC, in the city where the project is located. The tariff adjustment is based on the<br />
Write-offs – (81) (81)<br />
previous year consumer price index as stipulated in the concession agreements.<br />
Balance at December 31, 2010 18,946 179 19,125<br />
Accumulated Amortisation and Impairment Losses<br />
Balance at January 1, 2010 – – –<br />
Goodwill<br />
Group<br />
Impairment Testing for Goodwill<br />
Amortisation charge for the year – 28 28<br />
For the purpose of impairment testing, goodwill is allocated to the Group’s operating divisions which represent the<br />
Balance at December 31, 2010 – 28 28<br />
lowest level within the Group at which the goodwill is monitored for internal management purposes.<br />
Carrying Amount<br />
At December 31, 2010 18,946 151 19,097<br />
The aggregate carrying amounts of goodwill allocated to each unit are as follows:<br />
Group<br />
Service concession arrangements<br />
<strong>2011</strong> 2010<br />
The subsidiaries in South Africa and China have service concession agreements with the local municipalities in<br />
Note S$’000 S$’000<br />
Mbombela and Ilembe in South Africa; and Fuzhou, Xinmin, Yanjiao and Qitaihe in People’s Republic of China. Under<br />
these agreements, the subsidiaries are to supply drinking water to the local communities for periods of 25 to 30 years.<br />
All of these arrangements fall within the scope of INT FRS 112.<br />
Cash-generating Unit (CGU)<br />
SUT Division (a) 18,946 18,946<br />
<strong>Sembcorp</strong> Cogen Pte Ltd (b) 26,378 26,378<br />
In January <strong>2011</strong>, a new agreement was signed by Qitaihe with the local Government for an additional period of<br />
<strong>Sembcorp</strong> Gas Pte Ltd (c) 41,986 41,986<br />
15 years and the Build-Own-Operate-Transfer (BOOT) arrangement was replaced with Build-Own-Operate (BOO)<br />
Water Segment comprising South Africa, United Kingdom and The Americas (d) 31,765 31,889<br />
arrangement. This arrangement does not fall within the scope of INT FRS 112. As such, the assets with carrying amount<br />
Multiple units of insignificant goodwill 20,731 20,529<br />
of S$3,578,000 have been reclassified to property, plant and equipment.<br />
139,806 139,728<br />
The significant aspects of the above service concession arrangements are as follows:<br />
The recoverable amounts are determined using value-in-use calculations. Cash flow projections used in the value-in-use<br />
• The arrangements are 25 to 30 years concession arrangements for water treatment with the respective municipal<br />
governments. The Group has a total of 3 BOOT arrangements and 3 concession contracts as at the end of the<br />
reporting period.<br />
calculations were prepared with management’s past experience in operating the business and forward market outlook<br />
over the long term nature of the business. Pre-tax discount rates ranging from 4.7% to 12.0% (2010: 5.6% to 12.0%)<br />
have been used.<br />
• Under the BOOT arrangement, the operator is required to design, construct, own as well as operate, manage and<br />
maintain the assets and water services works for the supply of water.<br />
At the balance sheet date, based on the following key assumptions, the recoverable amounts exceed their carrying<br />
amounts.<br />
• Under the concession contract, the operator has a right of use of all assets of the local authority concerning<br />
water and sanitation. Concessional rights include rights to possess, use, operate, manage, maintain, rehabilitate,<br />
redesign, improve and expand existing assets and water services, as well as rights to own, design, construct any<br />
new assets and water services works within the geographical scope of concession.<br />
198 SEMBCORP INDUSTRIES ANNUAL REPORT <strong>2011</strong><br />
GROWING SUSTAINABLE BUSINESSES 199
NOTES TO THE FINANCIAL STATEMENTS<br />
Year Ended December 31, <strong>2011</strong><br />
16. Intangible Assets (cont’d)<br />
Goodwill (cont’d)<br />
a. SUT Division<br />
i. Use cash flow projections over a period of 10 years;<br />
ii.<br />
Estimation of demand and supply for industrial utilities and services are computed based on long term secured<br />
contracts with customers updated with new contracts signed over the financial year;<br />
16. Intangible Assets (cont’d)<br />
Goodwill (cont’d)<br />
d. Water Segment comprising South Africa, United Kingdom and The Americas<br />
i. These calculations use cash flow projections from years 2012 to 2016, which are based on financial budgets /<br />
forecasts approved by management. Terminal value is assumed based on cash flow in 2016 with nil growth.<br />
Where service concession arrangements are in place, cash flow is determined till the expiry of the concession<br />
instead of till perpetuity;<br />
iii. Scheduled plant maintenance and its associated costs have been accounted for in the forecast. Yearly<br />
maintenance cost is assumed to range from 3% to 4% of the asset value;<br />
ii.<br />
Tariff increases ranging from 2% to 15%. Where tariff increases are not certain as to timing and / or amount,<br />
assumptions are based on local management’s judgement;<br />
iv. Expected capital expenditure for replenishment of parts has been included in the forecasts in accordance with<br />
plant maintenance programme;<br />
v. Inflation rate assumption ranging from 5% to 6% has been used to project overheads and other general<br />
expenses; and<br />
vi. Cash flows are estimated based on the anticipated offtake with its secured customers over the remaining<br />
contractual period.<br />
b. <strong>Sembcorp</strong> Cogen Pte Ltd<br />
i. Use cash flow projections over a period of 10 years;<br />
ii. Estimation of demand and supply of electricity and electricity margin is derived based on forecasted market<br />
conditions leading to pool price movement;<br />
iii. Scheduled plant maintenance and its associated costs have been accounted for in the forecast. Yearly<br />
maintenance cost is assumed to range from 6% to 10% of the asset value;<br />
iv. Expected capital expenditure for replenishment of parts has been included in the forecasts in accordance with<br />
plant maintenance programme; and<br />
v. Inflation rate assumption ranging from 5% to 6% has been used to project overheads and other general expenses.<br />
c. <strong>Sembcorp</strong> Gas Pte Ltd<br />
i. Use cash flow projections over a period of 10 years;<br />
ii.<br />
Forward depreciating USD / SGD exchange rate and High Sulphur Fuel Oil prices against current financial year<br />
were assumed in the forecast performance;<br />
iii. Projected maintenance cost to service the gas pipelines has been included in the forecast;<br />
iv. Inflation rate assumption ranging from 5% to 6% has been used to project overheads and other general<br />
expenses; and<br />
v. Cash flows are estimated based on the sale and purchases quantities of gas over the remaining contractual<br />
period of the existing contracts.<br />
iii. Prevailing inflation rates in local economies ranging from 2% to 7% have been used as the assumption for<br />
growth in most cost categories;<br />
iv. Energy costs increase ranging from 4% to 29%; and<br />
v. Staff cost increases at rate ranging from 3% to 7%.<br />
Company<br />
The Company’s goodwill relates to goodwill of SUT on the acquisition of the SUT Division in 2008.<br />
17. Deferred Tax Assets and Liabilities<br />
Movements in deferred tax assets and liabilities (prior to offsetting of balances) during the year are as follows:<br />
Recognised<br />
in profit or loss Recognised Translation<br />
At Jan 1 (Note 34) in equity adjustments At Dec 31<br />
S$’000 S$’000 S$’000 S$’000 S$’000<br />
Group<br />
<strong>2011</strong><br />
Deferred tax liabilities<br />
Property, plant and equipment 357,155 12,098 – (5,431) 363,822<br />
Interests in associates 4,387 2,916 – 1 7,304<br />
Fair value adjustments 63,978 25 (33,681) – 30,322<br />
Trade and other receivables 5,792 (6) – (386) 5,400<br />
Other items 11,480 (4,779) – 1,379 8,080<br />
Total 442,792 10,254 (33,681) (4,437) 414,928<br />
Deferred tax assets<br />
Property, plant and equipment (25,657) 4,443 – (1,482) (22,696)<br />
Inventories (23) (350) – – (373)<br />
Trade receivables (629) 164 – 3 (462)<br />
Trade and other payables (7,520) 5,056 – (16) (2,480)<br />
Tax losses (1,619) 29 – 112 (1,478)<br />
Provisions (11,342) (5,774) – 934 (16,182)<br />
Fair value adjustments – (52) (14,381) 25 (14,408)<br />
Retirement benefit obligations – (3,754) – (114) (3,868)<br />
Other items (24,625) (573) – (787) (25,985)<br />
Total (71,415) (811) (14,381) (1,325) (87,932)<br />
200 SEMBCORP INDUSTRIES ANNUAL REPORT <strong>2011</strong><br />
GROWING SUSTAINABLE BUSINESSES 201
NOTES TO THE FINANCIAL STATEMENTS<br />
Year Ended December 31, <strong>2011</strong><br />
17. Deferred Tax Assets and Liabilities (cont’d)<br />
Recognised<br />
Acquisition of<br />
in profit or loss Recognised subsidiaries Translation<br />
At Jan 1 (Note 34) in equity (Note 38) adjustments At Dec 31<br />
S$’000 S$’000 S$’000 S$’000 S$’000 S$’000<br />
Group<br />
2010<br />
Deferred tax liabilities<br />
Property, plant and equipment 296,758 (36,795) (812) 111,637 (13,633) 357,155<br />
Interests in associates 2,488 2,160 – (281) 20 4,387<br />
Fair value adjustments 70,984 (26,760) 19,754 – – 63,978<br />
Trade and other receivables 368 3,551 – 1,997 (124) 5,792<br />
Trade and other payables 364 (191) – – (173) –<br />
Other items 7,751 7,919 (3,323) 30 (897) 11,480<br />
Total 378,713 (50,116) 15,619 113,383 (14,807) 442,792<br />
Deferred tax assets<br />
Property, plant and equipment (15,713) (3,049) – (7,685) 790 (25,657)<br />
Inventories – 2 – – (25) (23)<br />
Trade receivables – (253) – (378) 2 (629)<br />
Trade and other payables (897) 4,302 145 (11,340) 270 (7,520)<br />
Tax losses (150) 851 – (2,188) (132) (1,619)<br />
Provisions (15,037) 11,245 – (8,221) 671 (11,342)<br />
Fair value adjustments (39,722) 26,446 13,276 – – –<br />
Other items (19,214) 762 (7,586) (98) 1,511 (24,625)<br />
Total (90,733) 40,306 5,835 (29,910) 3,087 (71,415)<br />
Recognised<br />
Recognised<br />
At Jan 1, 2010 in profit or loss At Dec 31, 2010 in profit or loss At Dec 31, <strong>2011</strong><br />
S$’000 S$’000 S$’000 S$’000 S$’000<br />
Company<br />
Deferred tax liabilities<br />
Property, plant and equipment 56,848 (14,764) 42,084 (186) 41,898<br />
17. Deferred Tax Assets and Liabilities (cont’d)<br />
Deferred tax liabilities and assets are set off when there is a legally enforceable right to set off current tax assets against<br />
current tax liabilities and when the deferred taxes relate to the same taxation authority. The amounts determined after<br />
appropriate offsetting included in the balance sheet are as follows:<br />
Group<br />
Company<br />
<strong>2011</strong> 2010 <strong>2011</strong> 2010<br />
S$’000 S$’000 S$’000 S$’000<br />
Deferred tax liabilities 387,651 419,539 40,349 40,535<br />
Deferred tax assets (60,655) (48,162) – –<br />
326,996 371,377 40,349 40,535<br />
Deferred tax assets have not been recognised in respect of the following items:<br />
Group<br />
<strong>2011</strong> 2010<br />
Deductible temporary differences 6,975 8,498<br />
Tax losses 20,086 32,906<br />
Capital allowances 6,287 20,903<br />
33,348 62,307<br />
Tax losses of the Group amounting to S$12,745,000 (2010: S$9,957,000) will expire between 2012 and 2017 (2010:<br />
<strong>2011</strong> and 2015). Deductible temporary differences of the Group amounting to S$1,865,000 (2010: S$1,608,000) will<br />
expire in 2012 (2010: between <strong>2011</strong> and 2015). The capital allowances, and the remaining tax losses and the deductible<br />
temporary differences do not expire under current tax legislation.<br />
Deferred tax assets have not been recognised under the following circumstances:<br />
a. Where they qualified for offset against the tax liabilities of member companies within the Group under the Loss<br />
Transfer System of Group Relief but the terms of the transfer have not been ascertained as at year end; and<br />
b. Where it is uncertain that future taxable profit will be available against which the Group can utilise the benefits.<br />
S$’000<br />
S$’000<br />
Deferred tax assets<br />
Provisions – 1,549 1,549 – 1,549<br />
202 SEMBCORP INDUSTRIES ANNUAL REPORT <strong>2011</strong><br />
GROWING SUSTAINABLE BUSINESSES 203
NOTES TO THE FINANCIAL STATEMENTS<br />
Year Ended December 31, <strong>2011</strong><br />
18. Inventories and Work-In-Progress<br />
Group<br />
Company<br />
<strong>2011</strong> 2010 <strong>2011</strong> 2010<br />
Note S$’000 S$’000 S$’000 S$’000<br />
20. Other Receivables and Deposits<br />
Group<br />
Company<br />
<strong>2011</strong> 2010 <strong>2011</strong> 2010<br />
Note S$’000 S$’000 S$’000 S$’000<br />
Raw materials 89,317 95,291 3,306 2,354<br />
Finished goods 101,149 86,324 5,466 5,063<br />
190,466 181,615 8,772 7,417<br />
Allowance for inventory obsolescence (16,139) (8,123) – –<br />
174,327 173,492 8,772 7,417<br />
Work-in-progress (a) 903,942 742,441 329 –<br />
1,078,269 915,933 9,101 7,417<br />
a. Work-in-progress:<br />
Costs and attributable profits less allowance<br />
for foreseeable losses 4,052,154 3,301,990 329 1,343<br />
Progress billings (3,503,512) (3,223,658) – (1,343)<br />
548,642 78,332 329 –<br />
Comprising:<br />
Work-in-progress 903,942 742,441 329 –<br />
Excess of progress billings over work-in-progress (355,300) (664,109) – –<br />
548,642 78,332 329 –<br />
19. Trade and Other Receivables<br />
Group<br />
Company<br />
<strong>2011</strong> 2010 <strong>2011</strong> 2010<br />
Note S$’000 S$’000 S$’000 S$’000<br />
Trade receivables 13 543,077 294,734 33,686 24,810<br />
Current portion of finance lease 14 3,833 3,673 – –<br />
Service concession receivables 12(a) 10,686 17,960 – –<br />
Amounts due from related parties 15 25,431 12,772 9,075 6,380<br />
Other receivables and deposits 20 433,295 362,384 52,239 33,739<br />
Loans and receivables 41(b) 1,016,322 691,523 95,000 64,929<br />
Prepayments 41,050 65,582 5,715 5,549<br />
Advance to suppliers 32,887 3,432 149 449<br />
1,090,259 760,537 100,864 70,927<br />
Deposits 6,751 17,977 1,703 1,040<br />
Sundry receivables (a) 71,466 47,556 2,775 1,248<br />
Unbilled receivables (b) 348,386 293,202 46,758 31,335<br />
Loan receivables 4,153 4,231 – –<br />
Recoverable 6,509 5,032 1,077 524<br />
Interest receivable 499 446 – –<br />
437,764 368,444 52,313 34,147<br />
Allowance for doubtful receivables (4,469) (6,060) (74) (408)<br />
Other receivables and deposits 19 433,295 362,384 52,239 33,739<br />
a. Sundry receivables represent mainly GST receivables.<br />
b. Unbilled receivables represent revenue accrued for sale of utilities services, electricity, gas and other related<br />
products.<br />
21. Assets Held For Sale<br />
Group<br />
<strong>2011</strong> 2010<br />
Property, plant and equipment 24,437 36,813<br />
In 2010, according to the contractual agreement with a customer of a subsidiary, certain property, plant and equipment<br />
were classified to assets held for sale. In <strong>2011</strong>, the carrying value of the assets is presented net of the provision of<br />
S$11.7 million made in previous year to reflect the agreed consideration amount.<br />
22. Cash and Cash Equivalents<br />
Group<br />
S$’000<br />
Company<br />
S$’000<br />
<strong>2011</strong> 2010 <strong>2011</strong> 2010<br />
S$’000 S$’000 S$’000 S$’000<br />
Fixed deposits with banks 2,135,152 2,846,963 – –<br />
Cash and bank balances 860,326 640,913 629,074 310,342<br />
Cash and cash equivalents in the consolidated<br />
statement of cash flows 2,995,478 3,487,876 629,074 310,342<br />
Included in the Company’s cash and cash equivalents at the balance sheet date are amounts of S$621.8 million (2010:<br />
S$303.4 million) placed with a bank under a Group’s cash pooling arrangement by a subsidiary.<br />
204 SEMBCORP INDUSTRIES ANNUAL REPORT <strong>2011</strong><br />
GROWING SUSTAINABLE BUSINESSES 205
NOTES TO THE FINANCIAL STATEMENTS<br />
Year Ended December 31, <strong>2011</strong><br />
23. Trade and Other Payables<br />
Group<br />
Company<br />
<strong>2011</strong> 2010 <strong>2011</strong> 2010<br />
Note S$’000 S$’000 S$’000 S$’000<br />
Trade payables 1,888,872 1,377,298 2,872 7,702<br />
Advance payments from customers 40,640 50,227 17 618<br />
Amounts due to related parties 25 41,508 11,046 51,220 50,438<br />
Other payables and accrued charges 26 775,253 829,545 125,774 96,343<br />
2,746,273 2,268,116 179,883 155,101<br />
24. Provisions<br />
Obligations<br />
relating to<br />
Loan disposal Onerous Restoration<br />
undertakings of business Claims contracts costs Warranty Others Total<br />
S$’000 S$’000 S$’000 S$’000 S$’000 S$’000 S$’000 S$’000<br />
Group<br />
<strong>2011</strong><br />
Balance at beginning<br />
of the year 14,748 1,010 53,131 4,140 31,456 56,914 – 161,399<br />
Translation adjustments – – (29) – 23 (459) 99 (366)<br />
Provisions<br />
(written back) /<br />
made during<br />
the year, net (14,748) – 29,437 – 837 (7,144) 4,705 13,087<br />
Provisions utilised<br />
during the year – – (17,227) – – (2,284) – (19,511)<br />
Balance at end<br />
of the year – 1,010 65,312 4,140 32,316 47,027 4,804 154,609<br />
Provisions due:<br />
– within 1 year – 1,010 65,312 2,528 – 46,855 1,817 117,522<br />
– after 1 year – – – 1,612 32,316 172 2,987 37,087<br />
– 1,010 65,312 4,140 32,316 47,027 4,804 154,609<br />
24. Provisions (cont’d)<br />
Obligations<br />
relating to<br />
Loan disposal of Onerous Restoration<br />
undertakings business Claims contracts costs Warranty Total<br />
S$’000 S$’000 S$’000 S$’000 S$’000 S$’000 S$’000<br />
Group<br />
2010<br />
Balance at beginning of the year 14,748 11,454 15,349 7,180 6,493 60,124 115,348<br />
Translation adjustments – – (191) – (55) (1,291) (1,537)<br />
Provisions (written back) /<br />
made during the year, net – (1,706) 35,394 – 25,018 (1,585) 57,121<br />
Provisions utilised during the year – (8,738) (932) (3,040) – (334) (13,044)<br />
Acquisition of subsidiaries – – 3,511 – – – 3,511<br />
Balance at end of the year 14,748 1,010 53,131 4,140 31,456 56,914 161,399<br />
Provisions due:<br />
– within 1 year 14,748 1,010 49,620 2,579 – 54,913 122,870<br />
– after 1 year – – 3,511 1,561 31,456 2,001 38,529<br />
14,748 1,010 53,131 4,140 31,456 56,914 161,399<br />
Obligations<br />
relating to<br />
disposal of<br />
Restoration<br />
business Claims costs Total<br />
S$’000 S$’000 S$’000 S$’000<br />
Company<br />
<strong>2011</strong><br />
Balance at beginning of the year 1,010 6,236 500 7,746<br />
Provisions (written back) / made during the year, net – 13,547 93 13,640<br />
Provisions utilised during the year – (27) – (27)<br />
Balance at end of the year 1,010 19,756 593 21,359<br />
Provisions due:<br />
– within 1 year 1,010 19,756 – 20,766<br />
– after 1 year – – 593 593<br />
1,010 19,756 593 21,359<br />
2010<br />
Balance at beginning of the year 11,454 1,424 500 13,378<br />
Provisions (written back) / made during the year, net (1,706) 5,715 – 4,009<br />
Provisions utilised during the year (8,738) (903) – (9,641)<br />
Balance at end of the year 1,010 6,236 500 7,746<br />
Provisions due:<br />
– within 1 year 1,010 6,236 – 7,246<br />
– after 1 year – – 500 500<br />
1,010 6,236 500 7,746<br />
206 SEMBCORP INDUSTRIES ANNUAL REPORT <strong>2011</strong><br />
GROWING SUSTAINABLE BUSINESSES 207
NOTES TO THE FINANCIAL STATEMENTS<br />
Year Ended December 31, <strong>2011</strong><br />
24. Provisions (cont’d)<br />
Loan Undertakings<br />
This relates to the Group’s share of loan undertakings of associates.<br />
Obligations Relating to Disposal of Business<br />
This relates to the disposal of a business in which the Group and the Company retains certain obligations in respect of<br />
contracts pursuant to the Sale and Purchase Agreement.<br />
Claims<br />
This provision relates to the obligations arising from contractual and commercial arrangements in the Group’s and<br />
the Company’s operations, based on the best estimate of the possible outflow considering both contractual and<br />
commercial factors.<br />
Onerous Contracts<br />
The provision for onerous contracts relates to the Group’s exposure to the unavoidable cost of meeting its obligations<br />
under the contracts, which exceeds the expected benefits to be derived by the Group. The provision is measured at the<br />
present value of the lower of the expected cost of terminating the contract and the expected net cost of continuing<br />
with the contract. Before a provision is established, the Group recognises any impairment loss on the assets associated<br />
with the contracts.<br />
Restoration Costs<br />
Restoration costs relate to cost of dismantling and removing assets and restoring the premises to its original condition<br />
as stipulated in the operating lease agreements. The subsidiaries expect to incur the liability upon termination of the<br />
lease.<br />
Warranty<br />
The provision for warranty is based on estimates made from historical warranty data associated with similar projects.<br />
25. Amounts Due to Related Parties<br />
Non-controlling<br />
Associates Joint ventures Related companies interests Total<br />
25. Amounts Due to Related Parties (cont’d)<br />
Subsidiaries Joint ventures Total<br />
<strong>2011</strong> 2010 <strong>2011</strong> 2010 <strong>2011</strong> 2010<br />
Note S$’000 S$’000 S$’000 S$’000 S$’000 S$’000<br />
Company<br />
Amounts due to related parties (i) 51,220 50,434 – 4 51,220 50,438<br />
Loans from a related party (ii) 644,700 646,700 – – 644,700 646,700<br />
695,920 697,134 – 4 695,920 697,138<br />
Amounts due after 1 year 30 (644,700) (646,700) – – (644,700) (646,700)<br />
23 51,220 50,434 – 4 51,220 50,438<br />
i. The amounts due to related parties are unsecured, interest-free and repayable on demand.<br />
ii. The loans from a related party of S$644,700,000 (2010: S$646,700,000) bear effective interest rate of 3.09% (2010:<br />
3.14%) per annum, are unsecured and repayable from December 31, 2013 onwards.<br />
26. Other Payables and Accrued Charges<br />
Group<br />
Company<br />
<strong>2011</strong> 2010 <strong>2011</strong> 2010<br />
Note S$’000 S$’000 S$’000 S$’000<br />
Accrued operating expenses 667,536 738,366 122,146 90,606<br />
Deposits 18,522 21,955 342 342<br />
Accrued interest payable 11,334 12,165 – –<br />
Other payables 77,861 57,059 3,286 5,395<br />
23 775,253 829,545 125,774 96,343<br />
<strong>2011</strong> 2010 <strong>2011</strong> 2010 <strong>2011</strong> 2010 <strong>2011</strong> 2010 <strong>2011</strong> 2010<br />
Note S$’000 S$’000 S$’000 S$’000 S$’000 S$’000 S$’000 S$’000 S$’000 S$’000<br />
Group<br />
Amounts due to:<br />
Trade – 3,129 2,424 3,839 78 – 26 68 2,528 7,036<br />
Non-trade 459 388 2,852 2,798 – – – 10 3,311 3,196<br />
Advance payment<br />
– trade 2,341 – 32,510 – – – – – 34,851 –<br />
Loans – – – – – – 140,410 140,457 140,410 140,457<br />
2,800 3,517 37,786 6,637 78 – 140,436 140,535 181,100 150,689<br />
Amounts due<br />
after 1 year 30 – – – – (1) – (139,591) (139,643) (139,592) (139,643)<br />
23 2,800 3,517 37,786 6,637 77 – 845 892 41,508 11,046<br />
Loans from non-controlling interests of S$139,591,000 (2010: S$139,643,000) bear interest at rates ranging from 3.53%<br />
to 8.35% (2010: 3.53% to 8.35%) per annum, are unsecured and not expected to be repaid in the next 12 months.<br />
The remaining non-trade amounts and loans due to related parties are unsecured, interest-free and repayable on demand.<br />
208 SEMBCORP INDUSTRIES ANNUAL REPORT <strong>2011</strong><br />
GROWING SUSTAINABLE BUSINESSES 209
NOTES TO THE FINANCIAL STATEMENTS<br />
Year Ended December 31, <strong>2011</strong><br />
27. Other Financial Liabilities<br />
Group<br />
<strong>2011</strong> 2010<br />
S$’000<br />
S$’000<br />
28. Retirement Benefit Obligations (cont’d)<br />
b. Defined Benefit Obligations<br />
Certain subsidiaries provide pension arrangements to its full time employees through defined benefit plans and<br />
the related costs are assessed in accordance with the advice of professionally qualified actuaries.<br />
Current Liabilities<br />
Financial liabilities at fair value through profit or loss, on initial recognition:<br />
– Interest rate swaps – 101<br />
– Forward foreign exchange contracts 67 4<br />
– Foreign exchange swap contracts 4,359 1,392<br />
Cash flow hedges:<br />
– Interest rate swaps 7,797 7,878<br />
– Forward foreign exchange contracts 8,776 7,658<br />
– Fuel oil swaps 1,510 76<br />
22,509 17,109<br />
Non-current Liabilities<br />
Financial liabilities at fair value through profit or loss, on initial recognition:<br />
– Interest rate swaps 11,412 –<br />
Cash flow hedges:<br />
– Interest rate swaps 161,477 54,401<br />
– Forward foreign exchange contracts 13,664 130<br />
– Fuel oil swaps 772 77<br />
187,325 54,608<br />
28. Retirement Benefit Obligations<br />
Group<br />
<strong>2011</strong> 2010<br />
Note S$’000 S$’000<br />
Provision for retirement gratuities (a) 1,343 1,110<br />
Defined benefit obligations (b) 16,397 18,863<br />
17,740 19,973<br />
Non-current 17,740 19,973<br />
a. Provision for Retirement Gratuities<br />
Group<br />
<strong>2011</strong> 2010<br />
Balance at beginning of the year 1,110 1,500<br />
Provision made during the year 646 –<br />
Less: Amount due within 12 months (413) (390)<br />
Balance at end of the year 1,343 1,110<br />
S$’000<br />
S$’000<br />
One of the pension schemes has been closed to future accruals from April 1, 2010 with all active members at the<br />
closure date becoming entitled to leaving service benefits. Following the closure of the scheme, a curtailment gain<br />
of S$11,390,000 was recognised in 2010.<br />
The numbers shown below have been based on calculations carried out by qualified independent actuaries to take<br />
into account of the requirements of FRS 19 in order to assess the liabilities of the schemes at December 31, <strong>2011</strong>.<br />
The present values of the funded defined benefit obligations, the related current service cost and, where applicable,<br />
past service cost were measured using the projected unit credit method. Details of the schemes are as follows:<br />
Group<br />
<strong>2011</strong> 2010<br />
Present value of funded defined benefit obligations 327,785 318,015<br />
Fair value of plan assets (311,237) (307,617)<br />
Deficit in scheme 16,548 10,398<br />
Unrecognised actuarial (losses) / gains (3,642) 5,975<br />
Net liability recognised in the balance sheet 12,906 16,373<br />
The amounts included in the balance sheet are as follows:<br />
S$’000<br />
Group<br />
S$’000<br />
<strong>2011</strong> 2010<br />
Note S$’000 S$’000<br />
Defined benefit obligations 16,397 18,863<br />
Defined benefit assets 12 (3,491) (2,490)<br />
12,906 16,373<br />
The proportion of fair value of plan assets at the balance sheet is analysed as follows:<br />
Group<br />
<strong>2011</strong> 2010<br />
% %<br />
Equity instruments 35.20 37.24<br />
Debt instruments 55.10 53.69<br />
Other assets 9.70 9.07<br />
100.00 100.00<br />
210 SEMBCORP INDUSTRIES ANNUAL REPORT <strong>2011</strong><br />
GROWING SUSTAINABLE BUSINESSES 211
NOTES TO THE FINANCIAL STATEMENTS<br />
Year Ended December 31, <strong>2011</strong><br />
28. Retirement Benefit Obligations (cont’d)<br />
b. Defined Benefit Obligations (cont’d)<br />
The plan assets do not include any of the Group’s own financial instruments, nor any property occupied by, or other<br />
assets used by the Group. Changes in the present value of defined benefit obligations are as follows:<br />
Group<br />
<strong>2011</strong> 2010<br />
Note S$’000 S$’000<br />
Opening defined benefit obligations 318,015 209,474<br />
Translation adjustments (4,904) (21,054)<br />
Current service cost 1,440 1,302<br />
Past service cost 91 132<br />
Interest cost 16,118 14,217<br />
Actuarial losses / (gains) 11,214 (616)<br />
Curtailment – (11,390)<br />
Acquisition of subsidiaries 38 – 140,246<br />
Benefits paid (14,469) (14,470)<br />
Employee contributions 280 174<br />
327,785 318,015<br />
Changes in the fair value of plan assets are as follows:<br />
Group<br />
<strong>2011</strong> 2010<br />
Note S$’000 S$’000<br />
Opening fair value of plan assets 307,617 187,686<br />
Translation adjustments (4,745) (19,333)<br />
Expected return on plan assets 16,605 14,260<br />
Actuarial gains 1,529 15,198<br />
Contributions by employer 4,420 4,999<br />
Acquisition of subsidiaries 38 – 119,103<br />
Benefits paid (14,469) (14,470)<br />
Employee contributions 280 174<br />
311,237 307,617<br />
Expenses / (income) recognised in the profit or loss are as follows:<br />
Group<br />
<strong>2011</strong> 2010<br />
Current service cost 1,440 1,302<br />
Past service cost 91 132<br />
Interest cost 16,118 14,217<br />
Expected return on plan assets (16,605) (14,260)<br />
Curtailment – (11,390)<br />
Net actuarial losses recognised during the year – 586<br />
1,044 (9,413)<br />
S$’000<br />
S$’000<br />
28. Retirement Benefit Obligations (cont’d)<br />
b. Defined Benefit Obligations (cont’d)<br />
The expense / (income) is recognised in the following line items in the profit or loss:<br />
Group<br />
<strong>2011</strong> 2010<br />
Cost of sales 1,200 1,080<br />
Administrative expenses 331 354<br />
Other expenses (include curtailment gain) (487) (10,847)<br />
1,044 (9,413)<br />
Actual return in value of plan assets 18,134 29,458<br />
Principal actuarial assumptions<br />
The main financial assumptions used by the independent qualified actuaries to calculate the liabilities under FRS<br />
19 were as follows:<br />
S$’000<br />
Group<br />
S$’000<br />
<strong>2011</strong> 2010<br />
% %<br />
Discount rate at December 31 4.7 5.4 – 5.5<br />
Expected return on plan assets at December 31 5.3 – 5.7 5.9 – 6.4<br />
Future rate of annual salary increases 3.3 4.2 – 4.4<br />
Future rate of pension increases 2.1 – 3.6 2.5 – 2.8<br />
Past service cost and net actuarial results are amortised over the estimated service life of the employees under plan<br />
benefits. The estimated service life for pension plans is 9 to 12 years (2010: 9 years).<br />
Assumptions regarding future mortality are based on published statistics and mortality tables. The expected<br />
remaining life expectancy of an individual retiring at age 65 is 22 (2010: 21) for male and 24 (2010: 24) for female.<br />
In 2010, the expected remaining life expectancy of an individual retiring at age 60 was 27 for male and 29 for<br />
female.<br />
The overall expected long-term rate of return on assets is 5.3% to 5.7% (2010: 5.9% to 6.4 %). The expected rate of<br />
return on plan assets is a weighted average of the individual expected rate of return on each asset class.<br />
The history of existing plans as of December 31 is as follows:<br />
<strong>2011</strong> 2010 2009 2008 2007<br />
S$’000 S$’000 S$’000 S$’000 S$’000<br />
Group<br />
Present value of funded defined<br />
benefit obligations 327,785 318,015 209,474 151,053 244,774<br />
Fair value of plan assets (311,237) (307,617) (187,686) (158,761) (253,504)<br />
Deficit / (surplus) in scheme 16,548 10,398 21,788 (7,708) (8,730)<br />
212 SEMBCORP INDUSTRIES ANNUAL REPORT <strong>2011</strong><br />
GROWING SUSTAINABLE BUSINESSES 213
NOTES TO THE FINANCIAL STATEMENTS<br />
Year Ended December 31, <strong>2011</strong><br />
29. Interest-bearing Borrowings<br />
Group<br />
Company<br />
<strong>2011</strong> 2010 <strong>2011</strong> 2010<br />
Note S$’000 S$’000 S$’000 S$’000<br />
Current liabilities<br />
Secured term loans (a) 40,822 32,454 – –<br />
Unsecured term loans (b) 142,596 13,857 – –<br />
Finance lease liabilities (c) 2,655 2,634 94 88<br />
186,073 48,945 94 88<br />
Non-current liabilities<br />
Secured term loans (a) 987,868 616,043 – –<br />
Unsecured term loans (b) 861,384 927,730 – –<br />
Finance lease liabilities (c) 7,113 9,352 156 250<br />
1,856,365 1,553,125 156 250<br />
2,042,438 1,602,070 250 338<br />
Maturity of liabilities (excluding finance lease liabilities)<br />
Group<br />
Company<br />
<strong>2011</strong> 2010 <strong>2011</strong> 2010<br />
S$’000 S$’000 S$’000 S$’000<br />
Within 1 year 183,418 46,311 – –<br />
After 1 year but within 5 years 618,388 575,247 – –<br />
After 5 years 1,230,864 968,526 – –<br />
Total borrowings 2,032,670 1,590,084 – –<br />
a. Secured Term Loans<br />
The secured loans are collaterised by the following assets:<br />
Group<br />
Net book value<br />
<strong>2011</strong> 2010<br />
Note S$’000 S$’000<br />
Property, plant and equipment 6(i) 1,248,707 872,782<br />
Investment property 7 9,211 9,392<br />
Net assets of a subsidiary 157,714 277,562<br />
1,415,632 1,159,736<br />
b. Unsecured Term Loans<br />
Included in the unsecured term loans are the following medium term notes of the Group:<br />
A wholly-owned subsidiary of the Company, <strong>Sembcorp</strong> Financial Services Pte Ltd (SFS), has a S$1.5 billion<br />
Multicurrency Multi-Issuer Debt Issuance Programme (the “Programme”), pursuant to which, the Company,<br />
together with SFS and other certain subsidiaries of the Company (the “Issuing Subsidiaries”), may from time to<br />
time issue debt under the Programme subject to availability of funds from the market. The obligations of the<br />
Issuing Subsidiaries under the notes are fully guaranteed by the Company.<br />
29. Interest-bearing Borrowings (cont’d)<br />
b. Unsecured Term Loans (cont’d)<br />
SFS has issued the following notes under the Programme:<br />
Principal<br />
Nominal Year of Year of amount<br />
interest rate issue maturity S$’000<br />
S$ medium term notes 5.00% 2009 2014 200,000<br />
S$ medium term notes 3.7325% 2010 2020 300,000<br />
S$ medium term notes 4.25% 2010 2025 100,000<br />
S$ medium term notes 6 month SOR + 0.55% 2010 2017 100,000<br />
700,000<br />
In <strong>2011</strong>, no new medium term notes were issued during the year.<br />
A subsidiary, <strong>Sembcorp</strong> Marine Ltd (SCM) has a S$2 billion Multicurrency Multi-Issuer Debt Issuance Programme<br />
(the “Programme”) pursuant to which SCM, together with its subsidiaries, Jurong Shipyard Pte Ltd, Sembawang<br />
Shipyard Pte Ltd and SMOE Pte Ltd (“Issuing SCM Subsidiaries”), may from time to time issue the notes, subject<br />
to availability of funds from the market. The obligations of Issuing SCM Subsidiaries under the notes are fully<br />
guaranteed by SCM.<br />
Under the Programme, SCM or any of the Issuing SCM Subsidiaries may from time to time issue notes in series or<br />
tranches in Singapore Dollars or any other currency. Such notes are listed on the Singapore Exchange Securities<br />
Trading Limited and are cleared through the Central Depository (Pte) Ltd. The notes are redeemable at par.<br />
As at December 31, <strong>2011</strong> and 2010, there were no outstanding notes.<br />
c. Finance Lease Liabilities<br />
The Group has obligations under finance leases that are payable as follows:<br />
<strong>2011</strong> 2010<br />
Payments Interest Principal Payments Interest Principal<br />
S$’000 S$’000 S$’000 S$’000 S$’000 S$’000<br />
Group<br />
Within 1 year 2,699 44 2,655 2,716 82 2,634<br />
After 1 year but within 5 years 7,150 37 7,113 9,452 100 9,352<br />
Total 9,849 81 9,768 12,168 182 11,986<br />
Under the terms of the lease agreements, no contingent rents are payable. The interest rates range from 0.51% to<br />
6.09% (2010: 0.51% to 6.09%) per annum.<br />
214 SEMBCORP INDUSTRIES ANNUAL REPORT <strong>2011</strong><br />
GROWING SUSTAINABLE BUSINESSES 215
NOTES TO THE FINANCIAL STATEMENTS<br />
Year Ended December 31, <strong>2011</strong><br />
29. Interest-bearing Borrowings (cont’d)<br />
c. Finance Lease Liabilities (cont’d)<br />
The Company has obligations under finance leases that are payable as follows:<br />
<strong>2011</strong> 2010<br />
31. Other Comprehensive Income<br />
Tax effects relating to each component of other comprehensive income:<br />
Group<br />
Group<br />
<strong>2011</strong> 2010<br />
Payments Interest Principal Payments Interest Principal<br />
S$’000 S$’000 S$’000 S$’000 S$’000 S$’000<br />
Company<br />
Within 1 year 107 13 94 107 19 88<br />
After 1 year but within 5 years 164 8 156 271 21 250<br />
Total 271 21 250 378 40 338<br />
Under the terms of the lease agreements, no contingent rents are payable. The effective interest rate is 6.09%<br />
(2010: 6.09%) per annum.<br />
30. Other Long-term Liabilities<br />
Group<br />
Company<br />
<strong>2011</strong> 2010 <strong>2011</strong> 2010<br />
Note S$’000 S$’000 S$’000 S$’000<br />
Deferred income (a) 162,607 165,304 9,262 10,031<br />
Deferred grants (b) 4,461 3,743 – –<br />
Other long-term payables (c) 21,638 12,328 – –<br />
Amounts due to related parties 25 139,592 139,643 644,700 646,700<br />
328,298 321,018 653,962 656,731<br />
a. Deferred income relates mainly to advance payments received from customers in respect of connection and<br />
capacity charges for the supply and delivery of gas and utilities, the difference between the fair value of the<br />
construction services provided and the fair value of the financial asset receivable.<br />
b. Deferred grants relate to government grants for capital assets.<br />
c. Other long-term payables relate primarily to retention monies of subsidiaries, lease payables and deposits /<br />
advances from customers.<br />
Before tax Tax expense Net of tax Before tax Tax expense Net of tax<br />
S$’000 S$’000 S$’000 S$’000 S$’000 S$’000<br />
Foreign currency translation<br />
differences for<br />
foreign operations 13,192 – 13,192 (131,504) – (131,504)<br />
Exchange differences on<br />
monetary items forming<br />
part of net investment<br />
in a foreign operation (223) – (223) (3,663) – (3,663)<br />
Share of other comprehensive<br />
income of associates<br />
and joint ventures (5,869) – (5,869) 2,520 – 2,520<br />
Cash flow hedges:<br />
net movement in<br />
hedging reserves (Note (a)) (164,731) 23,019 (141,712) (2,852) (3,462) (6,314)<br />
Available-for-sale financial assets:<br />
net movement in<br />
fair value reserve (Note (b)) (156,177) 23,957 (132,220) 119,091 (17,992) 101,099<br />
Other comprehensive income (313,808) 46,976 (266,832) (16,408) (21,454) (37,862)<br />
Group<br />
<strong>2011</strong> 2010<br />
a. Cash flow hedges:<br />
Net change in fair value of hedging instruments (131,658) 2,784<br />
Amount transferred to initial carrying amount of hedged items – 2,798<br />
Amount transferred to profit or loss (33,073) (8,434)<br />
Tax 23,019 (3,462)<br />
Net movement in the hedging reserve during the year<br />
recognised in other comprehensive income (141,712) (6,314)<br />
S$’000<br />
S$’000<br />
b. Available-for-sale financial assets:<br />
Changes in fair value (156,177) 119,091<br />
Tax 23,957 (17,992)<br />
Net change in fair value during the year recognised<br />
in other comprehensive income (132,220) 101,099<br />
216 SEMBCORP INDUSTRIES ANNUAL REPORT <strong>2011</strong><br />
GROWING SUSTAINABLE BUSINESSES 217
NOTES TO THE FINANCIAL STATEMENTS<br />
Year Ended December 31, <strong>2011</strong><br />
32. Turnover<br />
Group<br />
<strong>2011</strong> 2010<br />
S$’000<br />
S$’000<br />
34. Tax Expense (cont’d)<br />
Group<br />
<strong>2011</strong> 2010<br />
S$’000<br />
S$’000<br />
Sale of gas, water, electricity and related services 4,771,780 3,909,799<br />
Ship and rig repair, building, conversion and related services 3,921,807 4,514,248<br />
Construction and engineering related activities 152,519 169,365<br />
Service concession revenue 87,475 37,988<br />
Others 113,485 132,214<br />
9,047,066 8,763,614<br />
33. Finance Costs<br />
Group<br />
<strong>2011</strong> 2010<br />
Interest paid and payable to:<br />
– banks and others 60,977 50,367<br />
Amortisation of capitalised transaction costs and transactions costs written off 4,793 9,916<br />
Interest rate swap<br />
– fair value through profit or loss (101) (426)<br />
– ineffectiveness of cash flow hedge (1) 1,272<br />
65,668 61,129<br />
34. Tax Expense<br />
S$’000<br />
Group<br />
S$’000<br />
<strong>2011</strong> 2010<br />
Current tax expense<br />
Current year 185,798 211,137<br />
Over provided in prior years (70,472) (6,949)<br />
115,326 204,188<br />
Deferred tax expense<br />
Movements in temporary differences 18,451 7,051<br />
Under / (over) provided in prior years 1,609 (12,062)<br />
Changes in tax rates (10,617) (4,799)<br />
9,443 (9,810)<br />
Tax expense 124,769 194,378<br />
S$’000<br />
S$’000<br />
Reconciliation of effective tax rate<br />
Profit for the year 1,145,810 1,172,951<br />
Total tax expense 124,769 194,378<br />
Share of results of associates and joint ventures (170,573) (160,095)<br />
Profit before share of results of associates and joint ventures, and tax expense 1,100,006 1,207,234<br />
Tax using Singapore tax rate of 17% 187,001 205,230<br />
Effect of changes in tax rates (10,617) (4,799)<br />
Effect of different tax rates in foreign jurisdictions 5,092 6,814<br />
Tax incentives and income not subject to tax (11,384) (19,786)<br />
Expenses not deductible for tax purposes 22,742 29,630<br />
Utilisation of deferred tax benefits not previously recognised (1,091) (2,402)<br />
Overprovided in prior years * (68,863) (19,011)<br />
Deferred tax benefits not recognised 4,547 3,039<br />
Others (2,658) (4,337)<br />
Tax expense 124,769 194,378<br />
* In <strong>2011</strong>, a subsidiary of the Company had been allowed tax deduction of its losses from foreign exchange transactions for tax purposes for the<br />
Years of Assessment 2008 and 2009. Accordingly, the Group reversed tax provision of S$54,392,000 which had been provided for in 2007 and 2008.<br />
35. Profit For The Year<br />
The following items have been included in arriving at profit for the year:<br />
Group<br />
<strong>2011</strong> 2010<br />
a. Staff costs<br />
Staff costs 753,527 736,467<br />
Included in staff costs are:<br />
Equity-settled share-based payments 26,559 21,085<br />
Cash-settled share-based payments 6,761 11,580<br />
Contributions to:<br />
– defined benefit plan 1,530 1,434<br />
– defined contribution plan 36,063 33,356<br />
Jobs Credit Scheme, offset against staff costs – (3,205)<br />
S$’000<br />
S$’000<br />
218 SEMBCORP INDUSTRIES ANNUAL REPORT <strong>2011</strong><br />
GROWING SUSTAINABLE BUSINESSES 219
NOTES TO THE FINANCIAL STATEMENTS<br />
Year Ended December 31, <strong>2011</strong><br />
35. Profit For The Year (cont’d)<br />
Group<br />
<strong>2011</strong> 2010<br />
Note S$’000 S$’000<br />
35. Profit For The Year (cont’d)<br />
Group<br />
<strong>2011</strong> 2010<br />
Note S$’000 S$’000<br />
b. Other expenses<br />
Allowance made / (written back) for impairment losses<br />
– property, plant and equipment 6 15,149 5,241<br />
– associate 99 –<br />
– joint ventures 921 –<br />
– interests in other investments 82 149<br />
– goodwill 16 – 1,980<br />
– receivables 1,567 (5,579)<br />
– investment properties 7 – 563<br />
– inventory obsolescence 8,074 (564)<br />
– others 16 5 –<br />
Amortisation of intangible assets 16 11,473 4,715<br />
Audit fees paid / payable<br />
– auditors of the Company 1,215 1,483<br />
– overseas affiliates of the auditors of the Company 1,205 342<br />
– other auditors 270 947<br />
Non-audit fees paid / payable<br />
– auditors of the Company 329 88<br />
– overseas affiliates of the auditors of the Company 81 13<br />
– other auditors 318 139<br />
Depreciation<br />
– property, plant and equipment 6 222,419 236,397<br />
– investment properties 7 924 1,027<br />
Professional fee paid to directors or a firm in which a director is a member 294 130<br />
Operating lease expenses 28,529 30,943<br />
Property, plant and equipment written off 1,643 3,398<br />
Intangible assets written off 16 23 102<br />
Bad debts written off 181 94<br />
d. Non-operating expenses (net)<br />
Net exchange loss (6,569) (41,865)<br />
Net change in fair value of derivative instruments (7,280) 6,310<br />
Ineffectiveness of cash flow hedge – 6,118<br />
Gain / (loss) from disposal of<br />
– property, plant and equipment (net) 980 1,576<br />
– investment properties 822 –<br />
– subsidiaries (63) –<br />
– other investments and financial assets 355 142<br />
– assets held for sale 163 (1)<br />
e. Other significant items included in:<br />
Non-operating expenses (net)<br />
Full and final settlement of disputed foreign exchange transactions<br />
in a wholly-owned subsidiary of <strong>Sembcorp</strong> Marine Ltd (i) – 52,640<br />
Less: Non-controlling interests – (20,558)<br />
– 32,082<br />
i. In 2010, a subsidiary of <strong>Sembcorp</strong> Marine Ltd (SCM), Jurong Shipyard Pte Ltd (JSPL), reached an agreement,<br />
strictly on a commercial basis with Societe Generale (SG) for a full and final amicable settlement of the<br />
disputed foreign exchange transactions. Arising from this settlement, SG had made a payment of US$40.0<br />
million (S$52.64 million) to JSPL on the basis that there is no admission of liability by either party and S$52.64<br />
million had been recognised in the consolidated income statement in 2010.<br />
c. Other income<br />
Grants received<br />
– income related 2,491 1,225<br />
Gross dividend income 4,650 3,544<br />
Interest income<br />
– associates and joint ventures 1,345 1,486<br />
– banks and others 63,223 30,990<br />
220 SEMBCORP INDUSTRIES ANNUAL REPORT <strong>2011</strong><br />
GROWING SUSTAINABLE BUSINESSES 221
NOTES TO THE FINANCIAL STATEMENTS<br />
Year Ended December 31, <strong>2011</strong><br />
36. Earnings Per Share<br />
Group<br />
<strong>2011</strong> 2010<br />
a. Basic earnings per share<br />
Basic earnings per share is based on:<br />
i. Profit attributable to shareholders of the Company 809,282 792,871<br />
ii.<br />
S$’000<br />
No. of shares<br />
S$’000<br />
No. of shares<br />
’000 ’000<br />
Weighted average number of ordinary shares:<br />
Issued ordinary shares at beginning of the year 1,787,750 1,780,229<br />
Effect of share options exercised, performance shares<br />
and restricted shares released 3,192 3,487<br />
Effect of own shares held (4,739) (58)<br />
Effect of shares issued as acquisition consideration – 605<br />
Effect of shares cancelled (532) –<br />
Weighted average number of ordinary shares at the end of the year 1,785,671 1,784,263<br />
Group<br />
<strong>2011</strong> 2010<br />
b. Diluted earnings per share<br />
Diluted earnings per share is based on:<br />
i. Profit attributable to shareholders of the Company 809,282 792,871<br />
The weighted average number of ordinary shares adjusted for the unissued ordinary shares under the Share<br />
Option Plan was arrived at as follows:<br />
ii.<br />
S$’000<br />
No. of shares<br />
S$’000<br />
No. of shares<br />
’000 ’000<br />
Weighted average number of shares issued used<br />
in the calculation of basic earnings per share 1,785,671 1,784,263<br />
Weighted average number of unissued ordinary shares from:<br />
– share options 3,277 5,444<br />
– performance shares 3,642 3,723<br />
– restricted shares 8,296 6,976<br />
Number of shares that would have been issued at fair value (1,501) (2,757)<br />
Weighted average number of ordinary shares 1,799,385 1,797,649<br />
36. Earnings Per Share (cont’d)<br />
b. Diluted earnings per share (cont’d)<br />
For the purpose of calculating diluted earnings per ordinary share, the weighted average number of ordinary<br />
shares outstanding are adjusted for the effects of all dilutive potential ordinary shares. The Company has three<br />
categories of dilutive potential ordinary shares: share options, performance shares and restricted shares.<br />
For share options, the weighted average number of ordinary shares in issue is adjusted to take into account the<br />
dilutive effect arising from the exercise of all outstanding share options granted to employees where such shares<br />
would be issued at a price lower than the fair value (average share price during the year). The difference between<br />
the weighted average number of shares to be issued at the exercise prices under the options and the weighted<br />
average number of shares that would have been issued at the fair value based on assumed proceeds from the issue<br />
of these shares are treated as ordinary shares issued for no consideration. The number of such shares issued for no<br />
consideration is added to the number of ordinary shares outstanding in the computation of diluted earnings per<br />
share. No adjustment is made to the profit attributable to shareholders of the Company.<br />
For performance shares and restricted shares, the weighted average number of ordinary shares in issue is adjusted<br />
as if all dilutive performance shares and restricted shares are released. No adjustment is made to the profit<br />
attributable to shareholders of the Company.<br />
37. Dividends<br />
Subject to the approval by the shareholders at the next <strong>Annual</strong> General Meeting, the directors have proposed a final<br />
one-tier tax exempt dividend of 17.0 cents comprising a final ordinary one-tier tax exempt dividend of 15.0 cents per<br />
share and a final bonus one-tier tax exempt dividend of 2.0 cents (2010: one-tier tax exempt dividend of 17.0 cents<br />
comprising ordinary one-tier tax exempt dividend of 15.0 cents and bonus one-tier tax exempt dividend of 2.0 cents)<br />
per share amounting to an estimated net dividend of S$303,215,000 (2010: S$303,918,000) in respect of the year ended<br />
December 31, <strong>2011</strong>, based on the number of issued shares as at December 31, <strong>2011</strong>.<br />
The proposed dividend of 17.0 (2010: 17.0) cents per share has not been included as a liability in the financial statements.<br />
38. Acquisition of Subsidiary and Non-controlling Interests<br />
Acquisition of Subsidiary<br />
On July 9, 2010, the Group acquired 92.26% equity interest in Cascal N.V. (Cascal). Cascal was delisted from the New<br />
York Stock Exchange on August 5, 2010 and deregistered from the Securities and Exchange Commission on November<br />
3, 2010. Squeeze-out proceedings under the Dutch Civil Code are now ongoing for the Group to achieve full ownership<br />
of the company.<br />
The principal activity of Cascal was that of specialist investor and operator of water and wastewater systems. This<br />
acquisition was strategic to the Group and has transformed the Group into a global water player with enhanced<br />
capabilities to provide the total water and wastewater solutions to both industrial and municipal customers.<br />
a. Effect on cash flows of the Group<br />
Cash paid 269,186<br />
Less: Cash and cash equivalents in subsidiary acquired (72,183)<br />
Cash outflow on acquisition 197,003<br />
2010<br />
S$’000<br />
222 SEMBCORP INDUSTRIES ANNUAL REPORT <strong>2011</strong><br />
GROWING SUSTAINABLE BUSINESSES 223
NOTES TO THE FINANCIAL STATEMENTS<br />
Year Ended December 31, <strong>2011</strong><br />
38. Acquisition of Subsidiary and Non-controlling Interests (cont’d)<br />
Acquisition of Subsidiary (cont’d)<br />
Note<br />
2010<br />
At fair value<br />
b. Identifiable assets acquired and liabilities assumed<br />
Cash and cash equivalents 72,183<br />
Service concession arrangements 16 132,241<br />
Financial assets 38,219<br />
Other intangible assets and water rights 16 43,818<br />
Property, plant and equipment 6 470,696<br />
Interests in joint ventures 9,409<br />
Interests in associates 24,773<br />
Deferred tax assets 17 29,910<br />
Tax recoverable 8,603<br />
Inventories 3,543<br />
Trade and other receivables 77,149<br />
Total assets 910,544<br />
Trade and other payables 71,345<br />
Current tax payable 9,072<br />
Borrowings 341,849<br />
Finance lease liabilities 9,003<br />
Deferred tax liabilities 17 113,383<br />
Defined benefit obligations 28 21,143<br />
Provisions 24 3,511<br />
Deferred income 70,927<br />
Total liabilities 640,233<br />
Total net identifiable assets 270,311<br />
Less: Non-controlling interests (35,428)<br />
Add: Goodwill 16 34,303<br />
Consideration transferred for the business 269,186<br />
c. Acquisition-related costs<br />
Acquisition-related costs of S$11,417,000 were included in administrative expenses in the consolidated income<br />
statement.<br />
d. Acquired receivables<br />
The fair value of trade and other receivables was S$77,149,000 and included trade receivables with a fair value of<br />
S$51,859,000. The gross contractual amount for trade receivables due was S$59,980,000, of which S$8,121,000 was<br />
expected to be uncollectible.<br />
e. Non-controlling interests<br />
The Group had elected to measure the non-controlling interests at the non-controlling interests’ proportionate<br />
share of Cascal’s net identifiable assets.<br />
S$’000<br />
38. Acquisition of Subsidiary and Non-controlling Interests (cont’d)<br />
Acquisition of Subsidiary (cont’d)<br />
f. Goodwill<br />
The goodwill of S$34,303,000 recognised on the acquisition was attributable to the value of the water segment<br />
comprising South Africa, United Kingdom and The Americas. It also included the value of the industry and local<br />
market knowledge residing in the experienced workforce which cannot be separately recognised as intangible<br />
asset from goodwill.<br />
g. Revenue and profit contribution<br />
The acquired business contributed revenue of S$118,292,000 and profit for the year of S$11,744,000 to the Group<br />
for the period from July 9, 2010 to December 31, 2010.<br />
Had Cascal been consolidated from January 1, 2010, consolidated revenue and consolidated profit for the year<br />
ended December 31, 2010 would have been S$8,870,454,000 and S$1,173,806,000 respectively.<br />
Acquisition of Non-controlling Interests<br />
i. On August 10, 2010, the Group acquired an additional 5.40% equity interest in Cascal. As a result of this acquisition,<br />
the Group’s stake in Cascal rose to 97.66%.<br />
ii.<br />
The following summarised the effect of the change in the Group’s ownership interest in Cascal on the equity<br />
attributable to owners of the Company:<br />
Consideration paid for the acquisition of non-controlling interests 15,766<br />
Decrease in equity attributable to non-controlling interests (13,775)<br />
Decrease in equity attributable to owners of the Company 1,991<br />
In 2010, the Group acquired all remaining shares in The China Water Company Limited (CWC) not already held by<br />
its municipal water subsidiary from Waterloo Industrial Limited, CWC’s only other shareholder, for S$17,062,000.<br />
The consideration was satisfied by the allotment and issue of 3,630,192 new shares in the Company.<br />
The following summarised the effect of the change in the Group’s ownership interest in CWC on the equity<br />
attributable to owners of the Company:<br />
Equity instruments issued (3,630,192 shares) 17,062<br />
Repayment of Waterloo Industrial Limited’s loan (1,573)<br />
Decrease in equity attributable to non-controlling interests (6,994)<br />
Decrease in equity attributable to owners of the Company 8,495<br />
The fair value of the ordinary shares issued was based on the listed share price of the Company at October 22, 2010<br />
of S$4.70 per share.<br />
2010<br />
S$’000<br />
2010<br />
S$’000<br />
224 SEMBCORP INDUSTRIES ANNUAL REPORT <strong>2011</strong><br />
GROWING SUSTAINABLE BUSINESSES 225
NOTES TO THE FINANCIAL STATEMENTS<br />
Year Ended December 31, <strong>2011</strong><br />
39. Non-controlling Interests<br />
On May 15, 2010, our subsidiary, <strong>Sembcorp</strong> Marine Ltd (SCM) commenced proceedings in the High Court of Singapore<br />
against PPL Holdings Pte Ltd and its wholly-owned subsidiary, E-Interface Holdings Limited to seek the transfer for the<br />
remaining 15 per cent of the shares in PPL Shipyard Pte Ltd (PPLS) to SCM. Pending the outcome of the Court’s decision,<br />
SCM has continued to consolidate its 85 per cent interest in PPLS and separately accounted for the 15 per cent as a<br />
“non-controlling interest”.<br />
40. Related Parties<br />
Group<br />
a. Related party transactions<br />
The Group had the following significant transactions with related parties during the year:<br />
Group<br />
<strong>2011</strong> 2010<br />
Related Corporations<br />
Sales 77,644 106,917<br />
Purchases including rental 29,725 17,545<br />
Payment on behalf 7,602 19,588<br />
Purchase of investment and property, plant and equipment 3,141 9,246<br />
Associates and Joint Ventures<br />
Sales 41,288 48,003<br />
Purchases including rental 13,569 8,077<br />
Sale of investment and property, plant and equipment – 3,400<br />
Payment on behalf 3,627 475<br />
Others – 908<br />
b. Compensation of key management personnel<br />
The Group considers the directors of the Company (including the Group President & CEO of the Company), the<br />
President & CEO of <strong>Sembcorp</strong> Marine Ltd, the Executive Vice President of ASEAN and Singapore (Utilities), the<br />
Executive Chairman of <strong>Sembcorp</strong> Industrial Parks Ltd, the Group Chief Financial Officer and the Executive Vice<br />
President of Group Business & Strategic Development to be key management personnel in accordance with FRS<br />
24 Related Party Disclosures. These persons have the authority and responsibility for planning, directing and<br />
controlling the activities of the Group.<br />
The key management personnel compensation is as follows:<br />
S$’000<br />
Group<br />
S$’000<br />
<strong>2011</strong> 2010<br />
Directors’ fees and remuneration 6,191 6,172<br />
Other key management personnel remuneration 10,580 11,771<br />
16,771 17,943<br />
Fair value of share-based compensation 4,425 3,876<br />
S$’000<br />
S$’000<br />
40. Related Parties<br />
b. Compensation of key management personnel (cont’d)<br />
Remuneration includes salary (which includes allowances, fees and other emoluments) and bonus (which includes<br />
AWS, discretionary bonus and performance targets bonus).<br />
In addition to the above, the Company provides medical benefits to all employees including key management<br />
personnel.<br />
The Group adopts an incentive compensation plan, which is tied to the creation of Economic Value Added (EVA),<br />
as well as to attainment of individual and Group performance goals for its key executives. A “bonus bank” is used<br />
to hold incentive compensation credited in any year. Typically, one-third of the available balance is paid out in cash<br />
each year, with the balance being carried forward to the following year. The balances of the bonus bank in future<br />
will be adjusted by the yearly EVA performance of the Group and its subsidiaries and the payouts made from the<br />
bonus bank.<br />
The fair value of share-based compensation relates to performance shares and restricted shares granted that were<br />
charged to the profit or loss.<br />
41. Financial Instruments<br />
Financial risk management objectives and policies<br />
The Group’s activities expose it to market risk (including interest rate risk, foreign currency risk and price risk), credit<br />
risk and liquidity risk.<br />
As part of the Group’s Enterprise Risk Management framework, Group treasury policies and financial authority limits<br />
are documented and reviewed periodically. The policies set out the parameters for management of Group liquidity,<br />
counterparty risk, foreign exchange and derivative transactions and financing.<br />
The Group utilises foreign exchange contracts, foreign exchange swaps, interest rate swaps, interest rate options,<br />
contracts for difference and various financial instruments to manage exposures to interest rate, foreign exchange<br />
and commodity price risks arising from operating, financing and investment activities. Exposures to foreign currency<br />
risks are also hedged naturally by a matching sale or purchase of a matching asset or liability of the same currency<br />
and amount where possible. All such transactions must involve underlying assets or liabilities and no speculative<br />
transactions are allowed.<br />
The financial authority limits seek to limit and mitigate transactional risks by setting out the threshold of approvals<br />
required for the entry into contractual obligations and investments.<br />
a. Market risk<br />
Market risk is the risk that changes in market prices, such as interest rates, foreign exchange rates and prices<br />
will affect the Group’s income or the value of its holdings of financial instruments. The objective of market risk<br />
management is to manage and reduce market risk exposures within acceptable parameters.<br />
i. Interest rate risk<br />
The Group’s policy is to maintain an efficient and optimal interest cost structure using a mix of fixed and<br />
variable rate debts and long-term and short-term borrowings.<br />
The Group enters into interest rate swaps to reduce its exposure to interest rate volatility. In accordance with<br />
the Group’s policy, the duration of such interest rate swaps must not exceed the tenor of the underlying debt.<br />
226 SEMBCORP INDUSTRIES ANNUAL REPORT <strong>2011</strong><br />
GROWING SUSTAINABLE BUSINESSES 227
NOTES TO THE FINANCIAL STATEMENTS<br />
Year Ended December 31, <strong>2011</strong><br />
41. Financial Instruments (cont’d)<br />
a. Market risk (cont’d)<br />
i. Interest rate risk (cont’d)<br />
Effective interest rates and repricing analysis<br />
In respect of interest-earning financial assets and interest-bearing financial liabilities, the following table<br />
indicates effective interest rates at balance sheet date and the periods in which they are repriced:<br />
Fixed Interest Rate Repricing<br />
Effective<br />
interest Floating Within Between After<br />
rate interest 1 year 1 to 5 years 5 years Total<br />
Note % S$’000 S$’000 S$’000 S$’000 S$’000<br />
Group<br />
<strong>2011</strong><br />
Financial assets<br />
Finance lease receivables 14 4.25 3,833 – 6,999 – 10,832<br />
Balances with related parties 0.50 30,537 50,410 – – 80,947<br />
Loan receivables 5.25 18 – – – 18<br />
Other receivables 2.64 93 500 92 – 685<br />
Fixed deposits and bank balances 0.45 1,519,258 1,395,089 – – 2,914,347<br />
1,553,739 1,445,999 7,091 – 3,006,829<br />
Financial liabilities<br />
Secured term loans:<br />
– Floating rate loans 4.64 (933,017) – – – (933,017)<br />
– Effect of interest rate swaps 4.29 648,827 (17,597) (164,873) (466,357) –<br />
(284,190) (17,597) (164,873) (466,357) (933,017)<br />
– Fixed rate loans 8.10 – (1,456) (27,196) (104,737) (133,389)<br />
Total secured term loans (284,190) (19,053) (192,069) (571,094) (1,066,406)<br />
Unsecured term loans:<br />
– Floating rate loans 1.41 (267,200) – – – (267,200)<br />
– Effect of interest rate swaps 1.79 199,848 (106,218) (93,630) – –<br />
(67,352) (106,218) (93,630) – (267,200)<br />
– Fixed rate loans 1.70 – (35,111) – (1,793) (36,904)<br />
Bonds & notes 3.70 (100,000) – (200,000) (400,000) (700,000)<br />
– Effect of interest rate swaps 3.06 120,000 – (120,000) – –<br />
Total unsecured term loans (47,352) (141,329) (413,630) (401,793) (1,004,104)<br />
Lease liabilities 29 2.09 (6,463) (1,114) (2,191) – (9,768)<br />
Balances with related parties 8.10 – – (139,842) – (139,842)<br />
(338,005) (161,496) (747,732) (972,887) (2,220,120)<br />
41. Financial Instruments (cont’d)<br />
a. Market risk (cont’d)<br />
i. Interest rate risk (cont’d)<br />
Effective interest rates and repricing analysis (cont’d)<br />
Fixed Interest Rate Repricing<br />
Effective<br />
interest Floating Within Between After<br />
rate interest 1 year 1 to 5 years 5 years Total<br />
Note % S$’000 S$’000 S$’000 S$’000 S$’000<br />
Group<br />
2010<br />
Financial assets<br />
Finance lease receivables 14 4.25 – 3,673 10,832 – 14,505<br />
Balances with related parties 0.72 41,195 – – – 41,195<br />
Loan receivables 5.25 – 45 – – 45<br />
Other receivables 2.95 12 575 125 – 712<br />
Fixed deposits and bank balances 2.40 599,413 2,360,693 – – 2,960,106<br />
640,620 2,364,986 10,957 – 3,016,563<br />
Financial liabilities<br />
Secured term loans:<br />
– Floating rate loans 4.69 (613,324) – – – (613,324)<br />
– Effect of interest rate swaps 3.94 310,375 (12,884) (96,056) (201,435) –<br />
(302,949) (12,884) (96,056) (201,435) (613,324)<br />
– Fixed rate loans 5.83 – (4,877) (15,711) (47,726) (68,314)<br />
Total secured term loans (302,949) (17,761) (111,767) (249,161) (681,638)<br />
Unsecured term loans:<br />
– Floating rate loans 1.94 (241,336) – – – (241,336)<br />
– Effect of interest rate swaps 1.08 208,438 (8,000) (200,438) – –<br />
(32,898) (8,000) (200,438) – (241,336)<br />
– Fixed rate loans 5.59 – (1,960) – (1,794) (3,754)<br />
Bonds & notes 3.78 (100,000) – (200,000) (400,000) (700,000)<br />
– Effect of interest rate swaps 2.49 120,000 – (120,000) – –<br />
Total unsecured term loans (12,898) (9,960) (520,438) (401,794) (945,090)<br />
Lease liabilities 29 2.06 (7,722) (1,130) (3,134) – (11,986)<br />
Balances with related parties 8.10 (10) – (132,376) (7,717) (140,103)<br />
(323,579) (28,851) (767,715) (658,672) (1,778,817)<br />
Sensitivity analysis<br />
It is estimated that a one percentage point change in interest rate at the reporting date would increase /<br />
(decrease) equity and profit before tax by the following amounts. This analysis assumes that all other variables,<br />
in particular foreign currency rates, remain constant.<br />
228 SEMBCORP INDUSTRIES ANNUAL REPORT <strong>2011</strong><br />
GROWING SUSTAINABLE BUSINESSES 229
NOTES TO THE FINANCIAL STATEMENTS<br />
Year Ended December 31, <strong>2011</strong><br />
41. Financial Instruments (cont’d)<br />
a. Market risk (cont’d)<br />
i. Interest rate risk (cont’d)<br />
Effective interest rates and repricing analysis (cont’d)<br />
Profit before tax<br />
Equity<br />
100 bp 100 bp 100 bp 100 bp<br />
Increase Decrease Increase Decrease<br />
S$’000 S$’000 S$’000 S$’000<br />
Group<br />
December 31, <strong>2011</strong><br />
Variable rate financial instruments 12,157 (12,157) 75,297 (75,297)<br />
December 31, 2010<br />
Variable rate financial instruments 3,170 (3,170) 72,530 (72,530)<br />
Notional amount<br />
At December 31, <strong>2011</strong>, the Group had interest rate swaps with an aggregate notional amount of S$1,254,000,000<br />
(2010: S$1,170,961,000) of which S$285,325,000 (2010: S$532,148,000) are interest rate swaps with forward<br />
starting date. The Group receives a variable interest rate and pays a fixed rate interest ranging from 2.74% to<br />
4.35% (2010: 2.56% to 6.1%) per annum on the notional amount. The Company designates these interest rate<br />
swaps as cash flow hedges.<br />
Fixed Interest Rate Repricing<br />
Effective<br />
interest Floating Within Between After<br />
rate interest 1 year 1 to 5 years 5 years Total<br />
% S$’000 S$’000 S$’000 S$’000 S$’000<br />
Company<br />
<strong>2011</strong><br />
Financial assets<br />
Fixed deposits and bank balances 0.14 629,074 – – – 629,074<br />
Financial liabilities<br />
Lease liabilities 6.09 – (94) (156) – (250)<br />
Balances with related parties 3.09 (227,100) – (317,600) (100,000) (644,700)<br />
(227,100) (94) (317,756) (100,000) (644,950)<br />
2010<br />
Financial assets<br />
Fixed deposits and bank balances 0.07 310,342 – – – 310,342<br />
Financial liabilities<br />
Lease liabilities 6.09 – (88) (250) – (338)<br />
Balances with related parties 3.14 (229,100) – (317,600) (100,000) (646,700)<br />
(229,100) (88) (317,850) (100,000) (647,038)<br />
Sensitivity analysis<br />
It is estimated that a one percentage point change in interest rate at the reporting date would increase /<br />
(decrease) equity and profit before tax by the following amounts. This analysis assumes that all other variables,<br />
in particular foreign currency rates, remain constant.<br />
230 SEMBCORP INDUSTRIES ANNUAL REPORT <strong>2011</strong><br />
Company<br />
December 31, <strong>2011</strong><br />
Variable rate financial instruments 4,020 (4,020) – –<br />
December 31, 2010<br />
Variable rate financial instruments 812 (812) – –<br />
ii. Foreign currency risk<br />
The Group operates globally and is exposed to foreign currency exchange rate volatility primarily for Singapore<br />
dollars (SGD), United States dollars (USD), euros (EURO) and pounds sterling (GBP) on sales and purchases of assets<br />
and liabilities, which arise from the daily course of operations. Such risks are hedged either by forward foreign<br />
exchange contracts in respect of actual or forecasted currency exposures which are reasonably certain or hedged<br />
naturally by a matching sale or purchase of a matching asset or liability of the same currency and amount.<br />
The Group’s gross exposure to foreign currencies is as follows:<br />
SGD USD EURO GBP Others<br />
S$’000 S$’000 S$’000 S$’000 S$’000<br />
Group<br />
<strong>2011</strong><br />
Financial assets<br />
Cash and cash equivalents 68,474 691,729 124,347 1,450 19,503<br />
Trade and other receivables 21,839 487,908 13,618 74,584 1,094<br />
Other financial assets – – – – 28,884<br />
90,313 1,179,637 137,965 76,034 49,481<br />
Financial liabilities<br />
Trade and other payables 175,872 336,470 54,451 2,444 25,802<br />
Interest-bearing borrowings – 314,649 – – 10,597<br />
175,872 651,119 54,451 2,444 36,399<br />
Net financial (liabilities) / assets (85,559) 528,518 83,514 73,590 13,082<br />
Less: Foreign exchange contract – – – (74,477) –<br />
Net currency exposure of financial<br />
(liabilities) / assets net of those<br />
denominated in the respective<br />
entities’ functional currencies (85,559) 528,518 83,514 (887) 13,082<br />
Cash flow hedges for future<br />
dated transactions<br />
Foreign exchange forward contracts 289,478 (1,697,452) 139,757 – 29,035<br />
Foreign exchange swap agreements – 2,263 134,539 – –<br />
Fuel oil swap contracts – 201,517 – – –<br />
289,478 (1,493,672) 274,296 – 29,035<br />
GROWING SUSTAINABLE BUSINESSES 231
NOTES TO THE FINANCIAL STATEMENTS<br />
Year Ended December 31, <strong>2011</strong><br />
41. Financial Instruments (cont’d)<br />
a. Market risk (cont’d)<br />
ii. Foreign currency risk (cont’d)<br />
SGD USD EURO GBP Others<br />
S$’000 S$’000 S$’000 S$’000 S$’000<br />
41. Financial Instruments (cont’d)<br />
a. Market risk (cont’d)<br />
ii. Foreign currency risk (cont’d)<br />
USD EURO GBP Others<br />
S$’000 S$’000 S$’000 S$’000<br />
Group<br />
2010<br />
Financial assets<br />
Cash and cash equivalents 68,255 418,242 88,359 1,722 21,467<br />
Trade and other receivables 16,431 497,968 1,100 89,988 3,689<br />
Other financial assets – – – – 46,705<br />
84,686 916,210 89,459 91,710 71,861<br />
Financial liabilities<br />
Trade and other payables 173,611 392,902 59,266 3,696 10,756<br />
Interest-bearing borrowings – 106,196 – – 13,235<br />
173,611 499,098 59,266 3,696 23,991<br />
Net financial (liabilities) / assets (88,925) 417,112 30,193 88,014 47,870<br />
Less: Foreign exchange contract – – – (89,946) –<br />
Net currency exposure of financial<br />
(liabilities) / assets net of those<br />
denominated in the respective<br />
entities’ functional currencies (88,925) 417,112 30,193 (1,932) 47,870<br />
Cash flow hedges for future<br />
dated transactions<br />
Foreign exchange forward contracts 111,000 (1,414,212) 46,749 – –<br />
Foreign exchange swap agreements – (95,780) 78 – –<br />
Fuel oil swap contracts – 153,855 – – –<br />
111,000 (1,356,137) 46,827 – –<br />
The Company’s gross exposure to foreign currencies is as follows:<br />
USD EURO GBP Others<br />
S$’000 S$’000 S$’000 S$’000<br />
Company<br />
<strong>2011</strong><br />
Financial assets<br />
Cash and cash equivalents 6,488 – 15 –<br />
Trade and other receivables 17,589 – – –<br />
24,077 – 15 –<br />
Financial liabilities<br />
Trade and other payables 22,279 17 – 39<br />
Net financial assets / (liabilities) 1,798 (17) 15 (39)<br />
2010<br />
Financial assets<br />
Cash and cash equivalents 1,849 – 3 –<br />
Trade and other receivables 886 – – –<br />
2,735 – 3 –<br />
Financial liabilities<br />
Trade and other payables 18,168 117 226 778<br />
Net financial liabilities (15,433) (117) (223) (778)<br />
Foreign exchange contracts<br />
Foreign exchange forward contracts 25,269 – – –<br />
Foreign exchange swap agreements – – – –<br />
25,269 – – –<br />
Sensitivity analysis<br />
A 10% strengthening of the following currencies against the functional currencies of the Company and its<br />
subsidiaries at the balance sheet date would have increased / (decreased) equity and profit before tax by<br />
the amounts shown below. The analysis assumes that all other variables, in particular interest rates, remain<br />
constant. The analysis is performed on the same basis for 2010.<br />
Group<br />
Profit<br />
Company<br />
Profit<br />
Equity before tax Equity before tax<br />
S$’000 S$’000 S$’000 S$’000<br />
<strong>2011</strong><br />
SGD 9,232 9,370 – –<br />
USD (114,020) 40,047 – 180<br />
EURO 11,536 19,384 – (2)<br />
GBP – (37) – 2<br />
Others 4,806 (1,579) – (4)<br />
2010<br />
SGD (5,217) (8,995) – –<br />
USD (103,201) 34,797 – 986<br />
EURO 4,203 4,551 – (12)<br />
GBP 10 (126) – (22)<br />
Others 3,660 388 – (78)<br />
A 10% weakening of the above currencies against the functional currencies of the Company and its subsidiaries<br />
at the balance sheet date would have had the equal but opposite effect on the above currencies to the<br />
amounts shown above, on the basis that all other variables remain constant.<br />
232 SEMBCORP INDUSTRIES ANNUAL REPORT <strong>2011</strong><br />
GROWING SUSTAINABLE BUSINESSES 233
NOTES TO THE FINANCIAL STATEMENTS<br />
Year Ended December 31, <strong>2011</strong><br />
41. Financial Instruments (cont’d)<br />
a. Market risk (cont’d)<br />
iii. Price risk<br />
Equity securities price risk<br />
The Group is exposed to equity securities price risk because of the investments held by the Group which are<br />
classified on the consolidated balance sheet either as available-for-sale or at fair value through profit or loss.<br />
Sensitivity analysis<br />
If prices for equity securities increase by 10% with all other variables held constant, the increase in equity and<br />
profit before tax will be:<br />
Group<br />
<strong>2011</strong> 2010<br />
Equity 13,291 29,289<br />
Profit before tax 2 1<br />
A 10% decrease in the underlying equity prices would have had the equal but opposite effect to the amounts<br />
shown above. The analysis is performed on the same basis for 2010 and assumes that all other variables remain<br />
constant.<br />
Commodity risk<br />
The Group hedges against fluctuations in commodity prices that affect revenue and cost. Exposures are<br />
managed via swaps, options, contracts for differences, fixed price and forward contracts.<br />
Contracts for differences are entered into with a counterparty at a strike price, with or without fixing the<br />
quantity upfront, to hedge against adverse price movements on the sale of electricity. Naphtha swaps are<br />
entered into for fixed quantity to hedge revenue indexed to naphtha. Exposure to price fluctuations arising<br />
on the purchase of fuel is managed via fuel oil swaps where the price of fuel is indexed to a benchmark fuel<br />
price index, for example Singapore High Sulphur Fuel Oil 180 CST fuel oil.<br />
Sensitivity analysis<br />
If prices for commodities increase by 10% with all other variables held constant, the increase in equity and<br />
profit before tax will be:<br />
S$’000<br />
Group<br />
S$’000<br />
<strong>2011</strong> 2010<br />
Equity 19,989 12,476<br />
Profit before tax – –<br />
A 10% decrease in the prices for commodities would have had the equal but opposite effect to the amounts<br />
shown above. The analysis is performed on the same basis for 2010 and assumes that all other variables remain<br />
constant.<br />
S$’000<br />
S$’000<br />
41. Financial Instruments (cont’d)<br />
a. Market risk (cont’d)<br />
iii. Price risk (cont’d)<br />
Notional amount<br />
At the balance sheet date, the Group had financial instruments with the following notional contract amounts:<br />
Group<br />
<strong>2011</strong> 2010<br />
Notional<br />
amount<br />
S$’000<br />
Notional<br />
amount<br />
Fuel oil swap agreements 238,594 153,855<br />
b. Credit risk<br />
The Group monitors its exposure to credit risks arising from sales to trade customers on an on-going basis, and<br />
credit evaluations are done on customers that require credit. The credit quality of customers is assessed after taking<br />
into account its financial position and past experience with the customers.<br />
The Group only deals with pre-approved customers and financial institutions with good credit rating. To minimise<br />
the Group’s counterparty risk, the Group enters into derivative transactions only with creditworthy institutions.<br />
Cash and fixed deposits are placed in banks and financial institutions with good credit rating.<br />
As the Group and the Company does not hold any collateral, the maximum exposure to credit risk is the carrying<br />
amount of each financial asset, including derivative financial instruments, in the balance sheet.<br />
The Group’s and the Company’s maximum exposure to credit risk for loans and receivables at the balance sheet<br />
date is as follows:<br />
S$’000<br />
Group<br />
Company<br />
<strong>2011</strong> 2010 <strong>2011</strong> 2010<br />
Note S$’000 S$’000 S$’000 S$’000<br />
By business activity<br />
Utilities 804,942 737,983 95,000 64,929<br />
Marine 518,780 232,651 – –<br />
Integrated Urban Development 7,864 6,621 – –<br />
Others 25,629 29,098 – –<br />
1,357,215 1,006,353 95,000 64,929<br />
Loans and receivables<br />
Non-current 12 340,893 314,830 – –<br />
Current 19 1,016,322 691,523 95,000 64,929<br />
1,357,215 1,006,353 95,000 64,929<br />
234 SEMBCORP INDUSTRIES ANNUAL REPORT <strong>2011</strong><br />
GROWING SUSTAINABLE BUSINESSES 235
NOTES TO THE FINANCIAL STATEMENTS<br />
Year Ended December 31, <strong>2011</strong><br />
41. Financial Instruments (cont’d)<br />
b. Credit risk (cont’d)<br />
The age analysis of current trade and other receivables is as follows:<br />
Gross Impairment Gross Impairment<br />
<strong>2011</strong> <strong>2011</strong> 2010 2010<br />
S$’000 S$’000 S$’000 S$’000<br />
Group<br />
Not past due 843,378 303 543,701 4,347<br />
Past due 0 to 3 months 122,004 1,389 66,880 472<br />
Past due 3 to 6 months 18,083 1,762 15,257 1,270<br />
Past due 6 to 12 months 11,185 2,488 14,493 3,312<br />
More than 1 year 31,960 18,143 41,398 22,319<br />
1,026,610 24,085 681,729 31,720<br />
Company<br />
Not past due 87,022 – 61,876 131<br />
Past due 0 to 3 months 7,001 – 2,534 –<br />
Past due 3 to 6 months 437 – 358 –<br />
Past due 6 to 12 months 295 – 40 –<br />
More than 1 year 319 74 529 277<br />
95,074 74 65,337 408<br />
Movements in the allowance for impairment of current and non-current trade and other receivables are as follows:<br />
Group<br />
Company<br />
<strong>2011</strong> 2010 <strong>2011</strong> 2010<br />
S$’000 S$’000 S$’000 S$’000<br />
41. Financial Instruments (cont’d)<br />
c. Liquidity risk (cont’d)<br />
The table below analyses the maturity profile of the Group’s and the Company’s financial liabilities (including<br />
derivative financial liabilities) based on expected contractual undiscounted cash inflows / (outflows), including<br />
interest payments and excluding the impact of netting agreements:<br />
Cash Flows<br />
Carrying Contractual Less than Between Over<br />
amount cash flow 1 year 1 and 5 years 5 years<br />
S$’000 S$’000 S$’000 S$’000 S$’000<br />
Group<br />
<strong>2011</strong><br />
Derivatives<br />
Derivative financial liabilities 209,834<br />
– inflow 1,605,522 814,957 790,565 –<br />
– outflow (1,840,274) (865,488) (928,199) (46,587)<br />
Derivative financial assets (28,901)<br />
– inflow 1,786,887 1,726,862 57,505 2,520<br />
– outflow (1,748,449) (1,709,047) (39,402) –<br />
Non-derivative financial liabilities<br />
Trade and other payables * 2,822,113 (2,707,130) (2,535,025) (148,813) (23,292)<br />
Interest-bearing borrowings 2,042,438 (2,703,184) (253,792) (862,048) (1,587,344)<br />
5,045,484 (5,606,628) (2,821,533) (1,130,392) (1,654,703)<br />
* Excludes advance payments from customers, deferred income, deferred grants, Goods and Services Tax and share of net liability of an associate.<br />
Cash Flows<br />
Balance at beginning of the year 46,268 46,303 408 321<br />
Currency translation difference (588) (694) – –<br />
Allowance made 4,648 2,917 – 131<br />
Allowance utilised (7,706) (1,883) (203) (44)<br />
Allowance written back (3,081) (8,496) (131) –<br />
Acquisition of subsidiaries – 8,121 – –<br />
Balance at end of the year 39,541 46,268 74 408<br />
The allowance account in respect of trade and other receivables is used to record impairment losses unless the<br />
Group is satisfied that no recovery of the amount owing is possible. At that point, the financial asset is considered<br />
irrecoverable and the amount charged to the allowance account is written against the carrying amount of the<br />
impaired financial asset.<br />
c. Liquidity risk<br />
The Group manages its liquidity risk with the view to maintaining a healthy level of cash and cash equivalents<br />
appropriate to the operating environment and expected cash flows of the Group. Liquidity requirements are<br />
maintained within the credit facilities established and are adequate and available to the Group to meet its<br />
obligations.<br />
Carrying Contractual Less than Between Over<br />
amount cash flow 1 year 1 and 5 years 5 years<br />
S$’000 S$’000 S$’000 S$’000 S$’000<br />
Group<br />
2010<br />
Derivatives<br />
Derivative financial liabilities 71,717<br />
– inflow 273,925 272,463 1,462 –<br />
– outflow (352,812) (305,508) (53,123) 5,819<br />
Derivative financial assets (75,369)<br />
– inflow 2,034,316 1,281,378 752,938 –<br />
– outflow (1,958,947) (1,237,776) (721,171) –<br />
Non-derivative financial liabilities<br />
Trade and other payables * 2,351,742 (2,394,731) (2,211,183) (164,128) (19,420)<br />
Interest-bearing borrowings 1,602,070 (2,225,243) (116,568) (818,257) (1,290,418)<br />
3,950,160 (4,623,492) (2,317,194) (1,002,279) (1,304,019)<br />
* Excludes advance payments from customers, deferred income, deferred grants, Goods and Services Tax and share of net liability of an associate.<br />
236 SEMBCORP INDUSTRIES ANNUAL REPORT <strong>2011</strong><br />
GROWING SUSTAINABLE BUSINESSES 237
NOTES TO THE FINANCIAL STATEMENTS<br />
Year Ended December 31, <strong>2011</strong><br />
41. Financial Instruments (cont’d)<br />
c. Liquidity risk (cont’d)<br />
Cash Flows<br />
41. Financial Instruments (cont’d)<br />
c. Liquidity risk (cont’d)<br />
Cash Flows<br />
Carrying Contractual Less than Between Over<br />
amount cash flow 1 year 1 and 5 years 5 years<br />
S$’000 S$’000 S$’000 S$’000 S$’000<br />
Company<br />
<strong>2011</strong><br />
Trade and other payables * 823,774 (890,718) (198,979) (579,222) (112,517)<br />
Interest-bearing borrowings 250 (269) (106) (163) –<br />
824,024 (890,987) (199,085) (579,385) (112,517)<br />
2010<br />
Trade and other payables * 797,948 (889,724) (171,521) (598,041) (120,162)<br />
Interest-bearing borrowings 338 (378) (107) (271) –<br />
798,286 (890,102) (171,628) (598,312) (120,162)<br />
* Excludes advance payments from customers, deferred income, deferred grants, Goods and Services Tax and share of net liability of an associate.<br />
The following table indicates the periods in which the cash flow associated with derivatives that are cash flow<br />
hedges are expected to impact the profit or loss.<br />
Cash Flows<br />
Carrying Contractual Less than Between Over<br />
amount cash flow 1 year 1 and 5 years 5 years<br />
S$’000 S$’000 S$’000 S$’000 S$’000<br />
Group<br />
<strong>2011</strong><br />
Derivative financial liabilities 193,996<br />
– inflow 1,262,951 472,386 790,565 –<br />
– outflow (1,472,328) (517,280) (910,981) (44,067)<br />
Derivative financial assets (13,245)<br />
– inflow 1,430,964 1,390,677 40,287 –<br />
– outflow (1,417,719) (1,378,317) (39,402) –<br />
180,751 (196,132) (32,534) (119,531) (44,067)<br />
2010<br />
Derivative financial liabilities 70,220<br />
– inflow 211,631 210,169 1,462 –<br />
– outflow (289,021) (241,717) (53,123) 5,819<br />
Derivative financial assets (73,356)<br />
– inflow 1,755,218 1,002,024 753,194 –<br />
– outflow (1,681,862) (960,691) (721,171) –<br />
(3,136) (4,034) 9,785 (19,638) 5,819<br />
Carrying Contractual Less than Between Over<br />
amount cash flow 1 year 1 and 5 years 5 years<br />
S$’000 S$’000 S$’000 S$’000 S$’000<br />
Company<br />
<strong>2011</strong><br />
Derivative financial assets –<br />
– inflow – – – –<br />
– outflow – – – –<br />
– – – – –<br />
2010<br />
Derivative financial assets (24)<br />
– inflow 25,293 25,293 – –<br />
– outflow (25,269) (25,269) – –<br />
(24) 24 24 – –<br />
d. Estimation of fair values<br />
FRS 107 establishes a fair value hierarchy that prioritises the inputs used to measure fair value. The three levels of<br />
the fair value input hierarchy defined by FRS 107 are as follows:<br />
• Level 1 – Fair values are measured based on quoted prices (unadjusted) from active markets for identical<br />
financial instruments.<br />
• Level 2 – Fair values are measured using inputs, other than those used for Level 1, that are observable for the<br />
financial instruments either directly (prices) or indirectly (derived from prices).<br />
• Level 3 – Fair values are measured using inputs which are not based on observable market data (unobservable<br />
input).<br />
Securities<br />
The fair value of financial assets at fair value through profit or loss, and available-for-sale financial assets, is based<br />
on quoted market prices (bid price) at the balance sheet date without any deduction for transaction costs. If the<br />
market for a quoted financial asset is not active, and for unquoted financial assets, the Group establishes fair value<br />
by using valuation techniques.<br />
238 SEMBCORP INDUSTRIES ANNUAL REPORT <strong>2011</strong><br />
GROWING SUSTAINABLE BUSINESSES 239
NOTES TO THE FINANCIAL STATEMENTS<br />
Year Ended December 31, <strong>2011</strong><br />
41. Financial Instruments (cont’d)<br />
d. Estimation of fair values (cont’d)<br />
Derivatives<br />
The fair value of forward exchange contracts is accounted for based on the difference between the contractual<br />
price and the current market price.<br />
The fair value of interest rate swaps, based on current interest rates curves, is the indicative amount that the<br />
Company is expected to receive or pay to terminate the swap with the swap counterparties at the balance sheet<br />
date.<br />
The fair value of fuel oil swaps contracts is accounted for based on the difference between the contractual strike<br />
price with the counterparty and the current market price.<br />
Contracts for Differences are accounted for based on the difference between the contracted price entered into<br />
with the counterparty and the reference price. The fair value of Contracts for Differences cannot be reliably<br />
measured as the financial instrument does not have quoted market prices in an active market. The gains and losses<br />
for Contracts for Differences are taken to the income statement upon settlement.<br />
The electricity forward sale with option to buyback contracts is entered into with a single counterparty for a fixed<br />
volume and its fair value is determined based on forward sale and forecasted spot purchase prices quoted in the<br />
market as at balance sheet date.<br />
Non-derivative financial liabilities<br />
Fair values are calculated based on discounted expected future principal and interest cash flows at the market<br />
rate of interest at the reporting date. For finance leases, the market rate of interest is determined by reference to<br />
similar lease agreements.<br />
Other financial assets and liabilities<br />
The carrying amounts of financial assets and liabilities with a maturity of less than one year (including trade and<br />
other receivables, cash and cash equivalents, and trade and other payables) are assumed to approximate their fair<br />
values because of the short period to maturity. All other financial assets and liabilities are discounted to determine<br />
their fair values.<br />
41. Financial Instruments (cont’d)<br />
e. Fair value hierarchy<br />
The following table sets forth by level within the fair value hierarchy our financial assets and liabilities that were<br />
accounted for at fair value on a recurring basis as of December 31, <strong>2011</strong>. These financial assets and liabilities are<br />
classified in their entirety based on the lowest level of input that is significant to the fair value measurement. Our<br />
assessment of the significance of a particular input to the fair value measurement requires judgement, and may<br />
affect the valuation of assets and liabilities and their placement within the fair value hierarchy levels.<br />
Fair value measurement using:<br />
Level 1 Level 2 Level 3 Total<br />
S$’000 S$’000 S$’000 S$’000<br />
Group<br />
At December 31, <strong>2011</strong><br />
Available-for-sale financial assets 126,514 6,314 – 132,828<br />
Financial assets at fair value through profit or loss 17 – – 17<br />
Derivative financial assets – 28,901 – 28,901<br />
126,531 35,215 – 161,746<br />
Derivative financial liabilities – (209,834) – (209,834)<br />
126,531 (174,619) – (48,088)<br />
At December 31, 2010<br />
Available-for-sale financial assets 285,089 6,396 – 291,485<br />
Financial assets at fair value through profit or loss 12 – – 12<br />
Derivative financial assets – 78,305 – 78,305<br />
285,101 84,701 – 369,802<br />
Derivative financial liabilities – (71,717) – (71,717)<br />
285,101 12,984 – 298,085<br />
For financial instruments that are not actively traded in the market, the fair value is determined by independent<br />
third party or using valuation techniques where applicable. The Company may use a variety of methods and make<br />
assumptions that are based on existing market conditions at each balance sheet date. Quoted market prices or<br />
dealer quotes for similar instruments are used to estimate the fair value for medium term notes for disclosure<br />
purposes. Other techniques, such as estimated discounted cash flows, are used to determine fair value for the<br />
remaining financial instruments. Where discounted cash flow techniques are used, the management will estimate<br />
the future cash flows and use relevant market rate as the discount rate at the balance sheet date.<br />
240 SEMBCORP INDUSTRIES ANNUAL REPORT <strong>2011</strong><br />
GROWING SUSTAINABLE BUSINESSES 241
NOTES TO THE FINANCIAL STATEMENTS<br />
Year Ended December 31, <strong>2011</strong><br />
41. Financial Instruments (cont’d)<br />
f. Fair value versus carrying amounts<br />
The fair values of financial assets and liabilities, together with the carrying amounts shown in the balance sheets<br />
are as follows:<br />
Other financial Other financial<br />
Fair value – liabilities within liabilities outside Total<br />
Designated at hedging Available Loans and the scope of the scope of carrying<br />
fair value instruments for sale receivables FRS 39 FRS 39 amount Fair value<br />
Note S$’000 S$’000 S$’000 S$’000 S$’000 S$’000 S$’000 S$’000<br />
Group<br />
December 31, <strong>2011</strong><br />
Cash and cash equivalents 22 – – – 2,995,478 – – 2,995,478 2,995,478<br />
Trade receivables 13 – – – 543,958 – – 543,958 543,958<br />
Service concession receivables 12,19 – – – 264,124 – – 264,124 264,124<br />
Finance lease receivables 14 – – – 10,832 – – 10,832 10,832<br />
Amounts due from related parties 15 – – – 104,914 – – 104,914 104,914<br />
Staff loans 12 – – – 92 – – 92 92<br />
Other receivables and deposits 20 – – – 433,295 – – 433,295 433,295<br />
Available-for-sale financial assets:<br />
– Equity shares 11 – – 131,607 – – – 131,607 131,607<br />
– Unit trusts and funds 11 – – 1,300 – – – 1,300 1,300<br />
Financial assets at fair value through profit or loss, on initial recognition<br />
– Forward foreign exchange contracts 11 330 – – – – – 330 330<br />
– Equity shares 11 17 – – – – – 17 17<br />
– Interest rate swaps 11 11,412 – – – – – 11,412 11,412<br />
– Foreign exchange swap contracts 11 3,914 – – – – – 3,914 3,914<br />
Cash flow hedges:<br />
– Forward foreign exchange contracts 11 – 8,727 – – – – 8,727 8,727<br />
– Fuel oil swaps 11 – 4,518 – – – – 4,518 4,518<br />
15,673 13,245 132,907 4,352,693 – – 4,514,518 4,514,518<br />
Trade payables 23 – – – – 1,888,872 – 1,888,872 1,888,872<br />
Amounts due to related parties * 25 – – – – 146,249 – 146,249 146,249<br />
Other payables * – – – – 765,354 – 765,354 765,354<br />
Other long-term payables 30 – – – – 21,638 – 21,638 21,638<br />
Financial liabilities at fair value through profit or loss, on initial recognition<br />
– Interest rate swaps 27 11,412 – – – – – 11,412 11,412<br />
– Forward foreign exchange contracts 27 67 – – – – – 67 67<br />
– Foreign exchange swap contracts 27 4,359 – – – – – 4,359 4,359<br />
Cash flow hedges:<br />
– Forward foreign exchange contracts 27 – 22,440 – – – – 22,440 22,440<br />
– Interest rate swaps 27 – 169,274 – – – – 169,274 169,274<br />
– Fuel oil swaps 27 – 2,282 – – – – 2,282 2,282<br />
Interest-bearing borrowings<br />
– Short Term Borrowings 29 – – – – 183,418 – 183,418 183,418<br />
– Long Term Borrowings 29 – – – – 1,849,252 – 1,849,252 1,874,308<br />
– Finance lease liabilities 29 – – – – – 9,768 9,768 9,787<br />
15,838 193,996 – – 4,854,783 9,768 5,074,385 5,099,460<br />
* Excludes advance payments from customers, deferred income, deferred grants, Goods and Services Tax and share of net liability of an associate.<br />
242 SEMBCORP INDUSTRIES ANNUAL REPORT <strong>2011</strong><br />
GROWING SUSTAINABLE BUSINESSES 243
NOTES TO THE FINANCIAL STATEMENTS<br />
Year Ended December 31, <strong>2011</strong><br />
41. Financial Instruments (cont’d)<br />
f. Fair value versus carrying amounts (cont’d)<br />
Other financial Other financial<br />
Fair value – liabilities within liabilities outside Total<br />
Designated at hedging Available Loans and the scope of the scope of carrying<br />
fair value instruments for sale receivables FRS 39 FRS 39 amount Fair value<br />
Note S$’000 S$’000 S$’000 S$’000 S$’000 S$’000 S$’000 S$’000<br />
Group<br />
December 31, 2010<br />
Cash and cash equivalents 22 – – – 3,487,876 – – 3,487,876 3,487,876<br />
Trade receivables 13 – – – 295,379 – – 295,379 295,379<br />
Service concession receivables 12,19 – – – 241,877 – – 241,877 241,877<br />
Finance lease receivables 14 – – – 14,505 – – 14,505 14,505<br />
Amounts due from related parties 15 – – – 92,083 – – 92,083 92,083<br />
Staff loans 12 – – – 125 – – 125 125<br />
Other receivables and deposits 20 – – – 362,384 – – 362,384 362,384<br />
Available-for-sale financial assets:<br />
– Equity shares 11 – – 291,512 – – – 291,512 291,512<br />
– Unit trusts and funds 11 – – 1,382 – – – 1,382 1,382<br />
Financial assets at fair value through profit or loss, on initial recognition<br />
– Forward foreign exchange contracts 11 2,335 – – – – – 2,335 2,335<br />
– Equity shares 11 12 – – – – – 12 12<br />
– Foreign exchange swap contracts 11 2,614 – – – – – 2,614 2,614<br />
Cash flow hedges:<br />
– Forward foreign exchange contracts 11 – 70,420 – – – – 70,420 70,420<br />
– Fuel oil swaps 11 – 2,936 – – – – 2,936 2,936<br />
4,961 73,356 292,894 4,494,229 – – 4,865,440 4,865,440<br />
Trade payables 23 – – – – 1,377,298 – 1,377,298 1,377,298<br />
Amounts due to related parties * 25 – – – – 150,689 – 150,689 150,689<br />
Other payables * – – – – 823,592 – 823,592 823,592<br />
Other long-term payables 30 – – – – 12,328 – 12,328 12,328<br />
Financial liabilities at fair value through profit or loss, on initial recognition<br />
– Interest rate swaps 27 101 – – – – – 101 101<br />
– Forward foreign exchange contracts 27 4 – – – – – 4 4<br />
– Foreign exchange swap contracts 27 1,392 – – – – – 1,392 1,392<br />
Cash flow hedges:<br />
– Forward foreign exchange contracts 27 – 7,788 – – – – 7,788 7,788<br />
– Interest rate swaps 27 – 62,279 – – – – 62,279 62,279<br />
– Fuel oil swaps 27 – 153 – – – – 153 153<br />
Interest-bearing borrowings<br />
– Short Term Borrowings 29 – – – – 46,311 – 46,311 46,311<br />
– Long Term Borrowings 29 – – – – 1,543,773 – 1,543,773 1,541,465<br />
– Finance lease liabilities 29 – – – – – 11,986 11,986 12,026<br />
1,497 70,220 – – 3,953,991 11,986 4,037,694 4,035,426<br />
* Excludes advance payments from customers, deferred income, deferred grants, Goods and Services Tax and share of net liability of an associate.<br />
244 SEMBCORP INDUSTRIES ANNUAL REPORT <strong>2011</strong><br />
GROWING SUSTAINABLE BUSINESSES 245
NOTES TO THE FINANCIAL STATEMENTS<br />
Year Ended December 31, <strong>2011</strong><br />
41. Financial Instruments (cont’d)<br />
f. Fair value versus carrying amounts (cont’d)<br />
Other financial Other financial<br />
Fair value – liabilities within liabilities outside Total<br />
Designated at hedging Available Loans and the scope of the scope of carrying<br />
fair value instruments for sale receivables FRS 39 FRS 39 amount Fair value<br />
Note S$’000 S$’000 S$’000 S$’000 S$’000 S$’000 S$’000 S$’000<br />
Company<br />
December 31, <strong>2011</strong><br />
Cash and cash equivalents 22 – – – 629,074 – – 629,074 629,074<br />
Trade receivables 13 – – – 33,686 – – 33,686 33,686<br />
Amounts due from related parties 15 – – – 9,075 – – 9,075 9,075<br />
Other receivables and deposits 20 – – – 52,239 – – 52,239 52,239<br />
– – – 724,074 – – 724,074 724,074<br />
Trade payables 23 – – – – 2,872 – 2,872 2,872<br />
Amounts due to related parties 25 – – – – 695,920 – 695,920 762,864<br />
Other payables * – – – – 124,982 – 124,982 124,982<br />
Interest-bearing borrowings<br />
– Finance lease liabilities 29 – – – – – 250 250 269<br />
– – – – 823,774 250 824,024 890,987<br />
December 31, 2010<br />
Cash and cash equivalents 22 – – – 310,342 – – 310,342 310,342<br />
Trade receivables 13 – – – 24,810 – – 24,810 24,810<br />
Amounts due from related parties 15 – – – 6,380 – – 6,380 6,380<br />
Other receivables and deposits 20 – – – 33,739 – – 33,739 33,739<br />
Financial assets at fair value through profit or loss, on initial recognition<br />
– Forward foreign exchange contracts 11 24 – – – – – 24 24<br />
24 – – 375,271 – – 375,295 375,295<br />
Trade payables 23 – – – – 7,702 – 7,702 7,702<br />
Amounts due to related parties 25 – – – – 697,138 – 697,138 788,914<br />
Other payables * – – – – 93,108 – 93,108 93,108<br />
Interest-bearing borrowings<br />
– Finance lease liabilities 29 – – – – – 338 338 378<br />
– – – – 797,948 338 798,286 890,102<br />
* Excludes advance payments from customers and Goods and Services Tax.<br />
g. Capital management<br />
The Group aims to maintain a sound capital base so as to maintain investor, creditor and market confidence and<br />
to sustain future development and growth of its businesses, while at the same time maintaining an appropriate<br />
dividend policy to reward shareholders. The Group monitors Economic Value Added attributable to shareholders,<br />
which the Group defines as net operating profit after tax less capital charge excluding non-controlling interests.<br />
Management also monitors the level of dividends paid to ordinary shareholders.<br />
The Group seeks to maintain a balance between the higher returns that might be possible with higher levels of<br />
borrowings and the advantages and security afforded by a sound capital position. Capital is defined as equity<br />
attributable to the equity holders. The Group records a net cash position as at December 31, <strong>2011</strong> (2010: net cash<br />
position).<br />
There were no changes in the Group’s approach to capital management during the year.<br />
Neither the Company nor any of its subsidiaries are subject to externally imposed capital requirements.<br />
246 SEMBCORP INDUSTRIES ANNUAL REPORT <strong>2011</strong><br />
GROWING SUSTAINABLE BUSINESSES 247
NOTES TO THE FINANCIAL STATEMENTS<br />
Year Ended December 31, <strong>2011</strong><br />
42. Contingent Liabilities (Unsecured)<br />
Group<br />
<strong>2011</strong> 2010<br />
Guarantees given to banks to secure banking facilities provided to:<br />
– Associates 28,713 28,026<br />
– Joint venture 595,323 –<br />
– Others 26,261 8,269<br />
Performance guarantees granted for contracts awarded to the Group 717 23,652<br />
a. A Wayleave Agreement was entered into between SembGas and the Government of Singapore with respect<br />
to certain pipelines where SembGas would indemnify the Government of Singapore against all claims, actions,<br />
demands, proceedings, liabilities, damages, costs and expenses arising out of or in connection with any occurrence<br />
during the use, maintenance or operations of these pipelines. No such claim has arisen to date.<br />
b. A Power and Water Purchase Agreement (PWPA) was entered into between <strong>Sembcorp</strong> Salalah Power & Water<br />
Company SAOC (SSPWC) and a Buyer to purchase power and water for a period of 15 years from the date of<br />
commercial operations as defined in the PWPA. Around the same time, a Turnkey Engineering, Procurement and<br />
Construction Contract (EPC) was entered into with a Contractor for the construction of the power and desalination<br />
plant. Through the EPC, SSPWC has contracted out all risks of construction of the plant to the Contractor.<br />
As a result of delays in achieving various phases of commencement dates for the plants, the Buyer had sought for<br />
claims on liquidated damages and compensation for revenue losses from SSPWC under the PWPA.<br />
Taking into consideration the PWPA and the EPC contractual terms, SSPWC is confident that the final settlement<br />
should at least result in a neutral position. In addition, SSPWC had received a bankers’ guarantee as performance<br />
bond from the Contractor which is adequately sized to cover SSPWC’s potential liquidated damages payment to<br />
the Buyer when or if any claim arises. These claims and disputes are expected to be settled in 2012.<br />
Company<br />
a. The Company has provided guarantees to banks to secure banking facilities provided to a wholly-owned subsidiary,<br />
<strong>Sembcorp</strong> Financial Services Pte Ltd. These financial guarantee contracts are accounted for as insurance contracts.<br />
The principal risk to which the Company is exposed is credit risk in connection with guarantee contracts it has<br />
issued. The credit risk represents the loss that would be recognised upon a default by the parties to which the<br />
guarantees were given on behalf of. To mitigate these risks, management continually monitors the risks and has<br />
established processes including performing credit evaluations of the parties it is providing the guarantee on behalf<br />
of.<br />
There are no terms and conditions attached to the guarantee contracts that would have a material effect on the<br />
amount, timing and uncertainty of the Company’s future cash flows.<br />
S$’000<br />
S$’000<br />
42. Contingent Liabilities (Unsecured) (cont’d)<br />
Company (cont’d)<br />
a. Intra-group financial guarantees comprise guarantees granted by the Company to banks in respect of banking<br />
facilities amounting to S$1,738 million (2010: S$1,918 million), which includes S$700 million drawn down as at<br />
balance sheet date. The periods in which the financial guarantees expire are as follows:<br />
Company<br />
<strong>2011</strong> 2010<br />
Less than 1 year 1,037,780 1,218,125<br />
Between 1 to 5 years 200,000 200,000<br />
More than 5 years 500,000 500,000<br />
1,737,780 1,918,125<br />
b. The Company has provided corporate guarantees to a subsidiary, <strong>Sembcorp</strong> Cogen Pte Ltd (SembCogen) for the<br />
following:<br />
i. long-term contract (End User Agreement) dated January 15, 1999 with a fellow subsidiary, <strong>Sembcorp</strong> Gas Pte<br />
Ltd (SembGas) to purchase natural gas over the period of 22 years.<br />
ii.<br />
Under the End User Guarantee Agreement, the Company and one of its subsidiaries, <strong>Sembcorp</strong> Utilities Pte Ltd,<br />
issued corporate guarantees in favour of SembGas for 70% and 30% respectively of SembCogen’s obligations<br />
under the End User Agreement.<br />
two long-term agreements entered during the year for the purchase of a total 42 BBtud (Billion British thermal<br />
units per day) of liquefied natural gas (LNG) from BG Singapore Gas Marketing Pte Ltd (BG). The agreements<br />
have a term of 10 years and SembCogen has an option to extend the term by 2 successive periods of 5 years<br />
each subject to fulfilment of conditions set in the agreements. The obligations of SembCogen under the LNG<br />
purchase agreements are currently secured by corporate guarantees issued by the Company in favour of BG.<br />
43. Commitments<br />
Commitments not provided for in the financial statements are as follows:<br />
S$’000<br />
Group<br />
S$’000<br />
<strong>2011</strong> 2010<br />
Capital expenditure for:<br />
– Commitments in respect of contracts placed 855,814 1,083,712<br />
– Uncalled capital and commitments to subscribe for additional shares in investments 261,225 888,206<br />
1,117,039 1,971,918<br />
S$’000<br />
S$’000<br />
Estimates of the Company’s obligation arising from financial guarantee contracts may be affected by future events,<br />
which cannot be predicted with any certainty. The assumptions made may well vary from actual experience so that<br />
the actual liability may vary considerably from the best estimates. As of balance sheet date, there is no provision<br />
made in respect of the obligations.<br />
248 SEMBCORP INDUSTRIES ANNUAL REPORT <strong>2011</strong><br />
GROWING SUSTAINABLE BUSINESSES 249
NOTES TO THE FINANCIAL STATEMENTS<br />
Year Ended December 31, <strong>2011</strong><br />
43. Commitments (cont’d)<br />
At the balance sheet date, commitments in respect of payments for non-cancellable operating leases with a term of<br />
more than one year are as follows:<br />
Group<br />
Company<br />
<strong>2011</strong> 2010 <strong>2011</strong> 2010<br />
S$’000 S$’000 S$’000 S$’000<br />
Lease payments due:<br />
Within 1 year 31,344 27,644 8,294 6,683<br />
Between 1 and 5 years 90,306 82,049 31,720 13,066<br />
After 5 years 372,749 351,710 54,153 35,770<br />
494,399 461,403 94,167 55,519<br />
On January 15, 1999, SembGas entered into a long-term Gas Sales Agreement to purchase natural gas over a period of<br />
22 years. SembGas also entered into agreements with certain customers for the on-sale of this gas, which agreements<br />
incorporated provisions, which specifically deal with, inter-alia, SembGas’ liability for shortfalls in deliveries of gas and<br />
relief from such liability in certain circumstances.<br />
On April 15, 2008, SembGas entered into another agreement to import natural gas over a period of 15 years, with first<br />
delivery of gas taken place in <strong>2011</strong>.<br />
In 2010, SembCogen entered into two long-term agreements to purchase liquefied natural gas (LNG), usage of LNG<br />
Terminal and other charges over a period of 10 years and has the option to extend the term by two successive periods<br />
of 5 years.<br />
The Group leases out its investment properties. Non-cancellable operating lease rentals are receivable as follows:<br />
Group<br />
<strong>2011</strong> 2010<br />
Lease receivable:<br />
Within 1 year 3,408 3,723<br />
Between 1 and 5 years 2,612 3,252<br />
6,020 6,975<br />
44. Segment <strong>Report</strong>ing<br />
a. Operating Segments<br />
For management purposes, the Group is organised into business units based on their products and services, and has<br />
four reportable operating segments as follows:<br />
i. The Utilities segment’s principal activities are in the provision of energy, water and on-site logistics & solid<br />
waste management. Key activities in the energy sector include power generation and retail, process steam<br />
production and supply, as well as natural gas import, supply and retail. In the water sector, the business offers<br />
wastewater treatment as well as the production and supply of reclaimed, desalinated and potable water and<br />
water for industrial use.<br />
S$’000<br />
S$’000<br />
44. Segment <strong>Report</strong>ing<br />
a. Operating Segments (cont’d)<br />
iii. The Integrated Urban Development (formally known as Industrial Parks) segment owns, develops, markets and<br />
manages integrated industrial parks and townships in Asia.<br />
iv. Others / Corporate segment comprises businesses mainly relating to minting, design and construction activities,<br />
offshore engineering and the corporate companies.<br />
Management monitors the operating results of its business units separately for the purpose of making decisions<br />
about resource allocation and performance assessment.<br />
The Group operates in seven principal geographical areas: Singapore, China, Rest of Asia & Australia, Middle<br />
East & Africa, UK, Rest of Europe and Other Countries. In presenting information on the basis of geographical<br />
segments, segment revenue is based on the geographical location of customers. Segment assets and total<br />
assets are based on the geographical location of the assets.<br />
Integrated<br />
Urban Others /<br />
Utilities Marine Development Corporate Elimination Total<br />
S$’000 S$’000 S$’000 S$’000 S$’000 S$’000<br />
<strong>2011</strong><br />
Turnover<br />
External sales 4,893,451 3,956,312 8,862 188,441 – 9,047,066<br />
Inter-segment sales 44,033 3,918 3,969 21,650 (73,570) –<br />
Total 4,937,484 3,960,230 12,831 210,091 (73,570) 9,047,066<br />
Results<br />
Segment results 355,663 739,121 (246) 6,568 – 1,101,106<br />
Interest income 3,836 59,977 143 40,786 (40,174) 64,568<br />
Finance costs (59,854) (2,491) (47) (43,450) 40,174 (65,668)<br />
299,645 796,607 (150) 3,904 – 1,100,006<br />
Share of results of<br />
associates 32,552 46,695 11,380 – – 90,627<br />
Share of results of<br />
joint ventures 32,581 6,580 35,005 5,780 – 79,946<br />
364,778 849,882 46,235 9,684 – 1,270,579<br />
Tax (expense) / credit (43,839) (80,958) (90) 118 – (124,769)<br />
Non-controlling interests (16,575) (312,696) (7,398) 141 – (336,528)<br />
Profit for the year 304,364 456,228 38,747 9,943 – 809,282<br />
Assets<br />
Segment assets 5,331,221 4,671,541 169,787 1,714,706 (1,552,058) 10,335,197<br />
Interests in associates 161,440 332,657 349,030 – – 843,127<br />
Interests in joint ventures 243,072 63,294 129,830 65,377 – 501,573<br />
Tax assets 65,949 2,261 1,560 2,958 – 72,728<br />
Total assets 5,801,682 5,069,753 650,207 1,783,041 (1,552,058) 11,752,625<br />
ii.<br />
The Marine segment focuses on repair, building and conversion of ships and rigs, and on offshore engineering.<br />
250 SEMBCORP INDUSTRIES ANNUAL REPORT <strong>2011</strong><br />
GROWING SUSTAINABLE BUSINESSES 251
NOTES TO THE FINANCIAL STATEMENTS<br />
Year Ended December 31, <strong>2011</strong><br />
44. Segment <strong>Report</strong>ing (cont’d)<br />
a. Operating Segments (cont’d)<br />
Integrated<br />
Urban Others /<br />
Utilities Marine Development Corporate Elimination Total<br />
S$’000 S$’000 S$’000 S$’000 S$’000 S$’000<br />
44. Segment <strong>Report</strong>ing (cont’d)<br />
a. Operating Segments (cont’d)<br />
Integrated<br />
Urban Others /<br />
Utilities Marine Development Corporate Elimination Total<br />
S$’000 S$’000 S$’000 S$’000 S$’000 S$’000<br />
<strong>2011</strong><br />
Liabilities<br />
Segment liabilities 3,736,114 2,281,758 50,331 1,338,347 (1,552,058) 5,854,492<br />
Tax liabilities 376,638 262,336 9,826 8,673 – 657,473<br />
Total liabilities 4,112,752 2,544,094 60,157 1,347,020 (1,552,058) 6,511,965<br />
Capital expenditure 611,335 471,499 698 8,360 – 1,091,892<br />
Significant non-cash items<br />
Depreciation and<br />
amortisation 141,719 86,706 1,430 4,961 – 234,816<br />
Other non-cash items<br />
(including provisions,<br />
loss on disposal and<br />
exchange differences) 39,401 22,438 2,083 1,061 – 64,983<br />
2010<br />
Turnover<br />
External sales 3,993,208 4,553,341 16,226 200,839 – 8,763,614<br />
Inter-segment sales 38,810 1,522 3,504 1,563 (45,399) –<br />
Total 4,032,018 4,554,863 19,730 202,402 (45,399) 8,763,614<br />
Results<br />
Segment results 244,009 998,160 2,681 (8,963) – 1,235,887<br />
Interest income 3,597 28,795 209 34,949 (35,074) 32,476<br />
Finance costs (50,480) (7,134) – (38,589) 35,074 (61,129)<br />
197,126 1,019,821 2,890 (12,603) – 1,207,234<br />
Share of results of associates 33,645 43,490 8,500 – – 85,635<br />
Share of results of<br />
joint ventures 35,876 3,362 29,229 5,993 – 74,460<br />
266,647 1,066,673 40,619 (6,610) – 1,367,329<br />
Tax (expense) / credit (30,187) (172,999) 2,479 6,329 – (194,378)<br />
Non-controlling interests (5,212) (368,748) (6,235) 115 – (380,080)<br />
Profit for the year 231,248 524,926 36,863 (166) – 792,871<br />
2010 (cont’d)<br />
Assets<br />
Segment assets 4,672,147 4,974,816 176,706 1,429,179 (1,560,248) 9,692,600<br />
Interests in associates 105,636 274,687 306,278 – – 686,601<br />
Interests in joint ventures 133,456 48,155 99,575 66,241 – 347,427<br />
Tax assets 56,883 47 1,560 106,423 – 164,913<br />
Total assets 4,968,122 5,297,705 584,119 1,601,843 (1,560,248) 10,891,541<br />
Liabilities<br />
Segment liabilities 3,083,796 2,206,359 30,102 1,348,393 (1,560,248) 5,108,402<br />
Tax liabilities 372,199 384,636 11,105 (5,061) – 762,879<br />
Total liabilities 3,455,995 2,590,995 41,207 1,343,332 (1,560,248) 5,871,281<br />
Capital expenditure 561,761 98,150 53 1,803 – 661,767<br />
Significant non-cash items<br />
Depreciation and<br />
amortisation 151,275 83,625 2,053 5,186 – 242,139<br />
Other non-cash items<br />
(including provisions,<br />
loss on disposal and<br />
exchange differences) 36,084 59,639 3,767 3,242 – 102,732<br />
252 SEMBCORP INDUSTRIES ANNUAL REPORT <strong>2011</strong><br />
GROWING SUSTAINABLE BUSINESSES 253
NOTES TO THE FINANCIAL STATEMENTS<br />
Year Ended December 31, <strong>2011</strong><br />
44. Segment <strong>Report</strong>ing (cont’d)<br />
b. Geographical Segments<br />
Rest of Asia Middle East Rest of<br />
Singapore China & Australia & Africa UK Europe Others Consolidated<br />
S$’000 S$’000 S$’000 S$’000 S$’000 S$’000 S$’000 S$’000<br />
<strong>2011</strong><br />
Revenue from<br />
external customers 4,595,732 87,659 518,514 111,812 964,366 1,971,252 797,731 9,047,066<br />
Total assets 7,751,533 947,856 595,345 1,259,582 917,494 70,912 209,903 11,752,625<br />
Non-current assets 2,948,139 885,639 551,067 1,151,478 755,738 62,682 180,821 6,535,564<br />
Capital expenditure 638,309 23,606 16,132 351,118 39,824 – 22,903 1,091,892<br />
2010<br />
Revenue from<br />
external customers 4,228,900 63,259 690,066 348,509 825,480 1,628,319 979,081 8,763,614<br />
Total assets 7,563,771 845,580 420,156 865,631 908,496 88,472 199,435 10,891,541<br />
Non-current assets 2,625,613 793,195 339,069 798,501 731,402 74,877 164,692 5,527,349<br />
Capital expenditure 112,679 28,626 7,535 454,196 54,705 – 4,026 661,767<br />
45. Significant Accounting Estimates and Judgements<br />
Estimates, assumptions concerning the future and judgements are made in the preparation of the financial statements.<br />
They affect the application of the Group’s accounting policies, reported amounts of assets, liabilities, income and<br />
expenses, and disclosures made. They are assessed on an on-going basis and are based on experience and relevant<br />
factors, including expectations of future events that are believed to be reasonable under the circumstances.<br />
Key sources of estimation uncertainty<br />
The key assumptions concerning the future and other key sources of estimation uncertainty at the balance sheet date,<br />
that have a significant risk of causing a material adjustment to the carrying amounts of assets and liabilities within the<br />
next financial year are discussed below.<br />
Information on other significant areas of estimation uncertainty and critical judgements in applying accounting<br />
policies that have the most significant effect on the amounts recognised in the financial statements are described in<br />
the following notes:<br />
a. Impairment of goodwill<br />
The Group determines whether goodwill is impaired at least on an annual basis. This requires an estimation of the<br />
value in use of the cash-generating units to which the goodwill is allocated. Estimating the value in use requires<br />
the Group to make an estimate of the expected future cash flows from the cash-generating unit and also to<br />
choose a suitable discount rate in order to calculate the present value of those cash flows. Information about the<br />
assumptions and their risk factors relating to goodwill impairment are disclosed in Note 16.<br />
254 SEMBCORP INDUSTRIES ANNUAL REPORT <strong>2011</strong><br />
GROWING SUSTAINABLE BUSINESSES 255
NOTES TO THE FINANCIAL STATEMENTS<br />
Year Ended December 31, <strong>2011</strong><br />
45. Significant Accounting Estimates and Judgements (cont’d)<br />
b. Taxes<br />
The Group is subject to taxes in numerous jurisdictions. Significant judgement is involved in determining the groupwide<br />
provision for taxes. There are certain transactions and computation for which the ultimate tax determination<br />
is uncertain during the ordinary course of business. The Group recognises liabilities for expected tax issues based on<br />
estimates of whether additional taxes will be due. Where the final tax outcome of these matters is different from<br />
the amounts that were initially recorded, such differences will impact the taxes and deferred tax provisions in the<br />
period in which such determination is made.<br />
c. Pension assumptions<br />
The Group has decided on certain principal actuarial assumptions, as detailed in Note 28, in estimating its pension<br />
liability as at the balance sheet date. If there were adverse changes to these actuarial assumptions, then the<br />
Group’s unrecognised actuarial losses would increase with the risk that they would fall outside the corridor and<br />
would need to be recognised in the profit or loss.<br />
d. Depreciation of property, plant and equipment<br />
Property, plant and equipment are depreciated on a straight-line basis over their estimated useful lives.<br />
Management estimates the useful lives of these property, plant and equipment to be within 1 to 80 years. The<br />
carrying amount of the Group’s property, plant and equipment are set out in Note 6. Changes in the expected level<br />
of usage and technological developments could impact the economic useful lives and the residual values of these<br />
assets, therefore future depreciation charges could be revised.<br />
e. Provisions and contingent liabilities<br />
Estimates of the Group’s obligations arising from contracts that exist as at balance sheet date may be affected by<br />
future events, which cannot be predicted with any certainty. The assumptions and estimates are made based on<br />
the management’s knowledge and experience and may vary from actual experience so that the actual liability may<br />
vary considerably from the best estimates.<br />
Where it is not probable that an outflow of economic benefits will be required, or the amount cannot be estimated<br />
reliably, the obligation is disclosed as a contingent liability, unless the probability of outflow of economic benefits<br />
is remote. Possible obligations, whose existence will only be confirmed by the occurrence or non-occurrence of<br />
one or more future events are also disclosed as contingent liabilities unless the probability of outflow of economic<br />
benefits is remote.<br />
45. Significant Accounting Estimates and Judgements (cont’d)<br />
Critical accounting judgements in applying the Group’s accounting policies<br />
In the process of applying the Group’s accounting policies, management has made certain judgements, apart from<br />
those involving estimations, which have significant effect on the amounts recognised in the financial statements.<br />
a. Revenue recognition<br />
The Group has recognised revenue on construction contract, ship and rig repair, building and conversion based on<br />
the percentage of completion method in proportion to the stage of completion. The percentage of completion<br />
is assessed by reference to surveys of work performed. Significant judgement is required in determining the<br />
appropriate stage of completion and estimating a reasonable contribution margin for revenue and costs<br />
recognition.<br />
b. Impairment of investments and financial assets<br />
The Group follows the guidance of FRS 39 Financial Instruments: Recognition and Measurement in determining<br />
when an investment or financial asset is other than temporarily impaired. This determination requires significant<br />
judgement. The Group evaluates, among other factors, the duration and extent to which the fair value of an<br />
investment and financial asset is less than its cost; and the financial health of and near-term business outlook for<br />
the investment or financial asset, including factors such as industry and sector performance, changes in technology<br />
and operational and financing cash flow.<br />
46. Subsequent Events<br />
Subsequent to year end, the Group increased its shareholdings in <strong>Sembcorp</strong> Utilities (Netherlands) N.V. (formerly known<br />
as Cascal N.V.) from 97.66% to 98.31% following the completion of the transfer of 200,000 shares from WAGCAP<br />
Advisors LLC to the Group. The consideration of US$6.75 per share is the same as the price paid by the Group under the<br />
voluntary tender offer under which it acquired the 97.66% stake.<br />
47. New or Revised Accounting Standards and Interpretations<br />
Below are the mandatory standards, amendments and interpretations to existing standards that have been published,<br />
and are relevant for the Group’s accounting period beginning on or after January 1, 2012 or later periods and which<br />
the Group has not early adopted:<br />
Amendments to FRS 101 – Secured Hyperinflation and Removal of Fixed Prices of First-time Adopters<br />
Amendments to FRS 107 Disclosures – Transfer of Financial Assets<br />
The management anticipates that the adoption of the above amendments to FRS in the future periods will not have a<br />
material impact on the financial statements of the Group and of the Company in the period of their initial adoption.<br />
256 SEMBCORP INDUSTRIES ANNUAL REPORT <strong>2011</strong><br />
GROWING SUSTAINABLE BUSINESSES 257
NOTES TO THE FINANCIAL STATEMENTS<br />
Year Ended December 31, <strong>2011</strong><br />
48. Subsidiaries<br />
Details of significant subsidiaries are as follows:<br />
49. Associates and Joint Ventures<br />
Details of significant associates and joint ventures are as follows:<br />
Effective equity<br />
held by the Group<br />
Country of <strong>2011</strong> 2010<br />
Name of significant subsidiaries incorporation % %<br />
Utilities<br />
<strong>Sembcorp</strong> Utilities Pte Ltd 1 Singapore 100 100<br />
<strong>Sembcorp</strong> Cogen Pte Ltd 1 Singapore 100 100<br />
<strong>Sembcorp</strong> Gas Pte Ltd 1 Singapore 70 70<br />
<strong>Sembcorp</strong> Salalah Power and Water Company SAOC 2 Oman 60 60<br />
<strong>Sembcorp</strong> Utilities (UK) Limited 2 United Kingdom 100 100<br />
<strong>Sembcorp</strong> Utilities (Netherlands) N.V. 2 (Previously known as Cascal N.V.) The Netherlands 97.66 97.66<br />
<strong>Sembcorp</strong> Holdings Ltd 2 United Kingdom 97.66 97.66<br />
<strong>Sembcorp</strong> Utilities Services Limited 2 United Kingdom 97.66 97.66<br />
<strong>Sembcorp</strong> Bournemouth Water Limited 2 United Kingdom 97.66 97.66<br />
<strong>Sembcorp</strong> Utilities (South Africa) Pty Limited 2 South Africa 97.66 97.66<br />
<strong>Sembcorp</strong> Silulumanzi (Pty) Limited 2 South Africa 97.66 97.66<br />
<strong>Sembcorp</strong> Environment Pte. Ltd. 1 Singapore 100 100<br />
SembWaste Pte Ltd 1 Singapore 100 100<br />
Marine<br />
<strong>Sembcorp</strong> Marine Ltd 1 Singapore 60.76 60.90<br />
Jurong Shipyard Pte Ltd 1 Singapore 60.76 60.90<br />
PPL Shipyard Pte Ltd 1 Singapore 51.65 51.77<br />
Sembawang Shipyard Pte Ltd 1 Singapore 60.76 60.90<br />
SMOE Pte Ltd 1 Singapore 60.76 60.90<br />
Integrated Urban Development<br />
<strong>Sembcorp</strong> Industrial Parks Ltd 1 Singapore 100 100<br />
Vietnam Singapore Industrial Park Pte Ltd 1 Singapore 79.29 79.29<br />
Others<br />
<strong>Sembcorp</strong> Design and Construction Pte Ltd 1 Singapore 100 100<br />
Singapore Precision <strong>Industries</strong> Pte Ltd 1 Singapore 100 100<br />
1. Audited by KPMG LLP, Singapore.<br />
2. Audited by overseas affiliates of KPMG LLP.<br />
Effective equity<br />
held by the Group<br />
Country of <strong>2011</strong> 2010<br />
Name of significant associates and joint ventures incorporation % %<br />
Utilities<br />
^<br />
Phu My 3 BOT Power Company Ltd. Vietnam 33.33 33.33<br />
#<br />
Shanghai Cao Jing Co-generation Co. Ltd. People’s Republic of China 30.00 30.00<br />
@<br />
Shenzhen Chiwan Sembawang Engineering Co., Ltd People’s Republic of China 32.00 32.00<br />
*<br />
Emirates SembCorp Water & Power Company P.J.S.C United Arab Emirates 40.00 40.00<br />
^^<br />
SembSita Pacific Pte Ltd Singapore 40.00 40.00<br />
^^^<br />
Thermal Powertech Corporation India Ltd India 49.00 –<br />
Marine<br />
@@<br />
COSCO Shipyard Group People’s Republic of China 18.23 18.27<br />
Integrated Urban Development<br />
**<br />
Gallant Venture Ltd Singapore 23.92 23.92<br />
^^^<br />
Vietnam Singapore Industrial Park J.V. Co., Ltd. Vietnam 40.44 40.44<br />
^^^<br />
Wuxi-Singapore Industrial Park Development Co., Ltd People’s Republic of China 45.36 45.36<br />
###<br />
Sino-Singapore Nanjing Eco Hi-tech Island<br />
Development Co., Ltd People’s Republic of China 21.50 21.50<br />
The auditors of significant associates and joint ventures are as follows:<br />
^ Audited by Ernst & Young Vietnam Limited.<br />
# Audited by PricewaterhouseCoopers Zhong Tian CPAs Limited Company.<br />
@ Audited by BDO Shenzhen Dahua Tiancheng Certified Public Accountants.<br />
* Audited by Ernst & Young, Abu Dhabi.<br />
^^ Audited by Ernst & Young LLP.<br />
@@ Audited by Zhongrui Yuehua Certified Public Accountants Co., Ltd.<br />
** The consolidated financial statements of Gallant Venture Ltd, a company listed on Singapore Exchange, and its subsidiaries are audited by Foo, Kon<br />
& Tan Grant Thornton.<br />
^^^ Audited by overseas affiliates of KPMG LLP.<br />
### Audited by Jiangsu GongZheng Tain Ye Certified Public Accountant Co., Ltd, China.<br />
See Note 9 and 10 for details on pledge on the Company’s interests in its associate and joint venture.<br />
258 SEMBCORP INDUSTRIES ANNUAL REPORT <strong>2011</strong><br />
GROWING SUSTAINABLE BUSINESSES 259
SUPPLEMENTARY INFORMATION<br />
Year Ended December 31, <strong>2011</strong><br />
(Under SGX-ST Listing Manual requirements)<br />
A. Directors’ and Key Executives’ Remuneration Earned for the Year<br />
Summary compensation table for the year ended December 31, <strong>2011</strong><br />
Fair value of<br />
share-based<br />
compensation<br />
Brought<br />
Bonus granted for Directors’ fees Forward<br />
Salary 1 Earned the year 3 Cash-based 5 Share-based 6 Bonus Bank 2<br />
Name of Director S$’000 S$’000 S$’000 S$’000 S$’000 S$’000<br />
Payable by Company<br />
Ang Kong Hua – – – 188 80 –<br />
Tang Kin Fei 1,094 3,957 1,872 – – 6,107<br />
Goh Geok Ling – – – 112 48 –<br />
Evert Henkes – – – 145 62 –<br />
Bobby Chin Yoke Choong – – – 120 51 –<br />
Margaret Lui – – – 113 48 –<br />
Tan Sri Mohd Hassan Marican – – – 118 51 –<br />
Tham Kui Seng 4 – – – 39 17 –<br />
(Under SGX-ST Listing Manual requirements)<br />
A. Directors’ and Key Executives’ Remuneration Earned for the Year (cont’d)<br />
Notes:<br />
6. To align the interests of the non-executive directors with the interests of shareholders, up to 30% of the aggregate directors’ fees approved<br />
by shareholders for a particular financial year may be paid out in the form of restricted share awards under the <strong>Sembcorp</strong> <strong>Industries</strong> Restricted<br />
Share Plan 2010.<br />
For year <strong>2011</strong>, the awards granted under the <strong>Sembcorp</strong> <strong>Industries</strong> Restricted Share Plan 2010 to all directors as part of their directors’ fees<br />
(except for Mr Tang Kin Fei, who is the Group President & CEO, and who does not receive any directors’ fees) will consist of the grant of fully<br />
paid shares outright with no performance and vesting conditions attached, but with a selling moratorium. Non-executive directors are required<br />
to hold shares (including shares obtained by other means) worth at least one-time the annual base retainer (currently S$65,000); any excess may<br />
be sold as desired. A non-executive director can dispose of all of his shares one year after leaving the Board.<br />
The actual number of shares to be awarded to each non-executive director will be determined by reference to the volume-weighted average<br />
price of a share on the Singapore Exchange Securities Trading Limited (SGX-ST) over the 14 trading days immediately following the date of the<br />
<strong>Annual</strong> General Meeting (AGM). The number of shares to be awarded will be rounded down to the nearest hundred and any residual balance<br />
will be settled in cash.<br />
Details on the share options, performance shares and restricted shares granted to the directors are set out in the Sharebased<br />
Incentive Plans of the Directors’ <strong>Report</strong>.<br />
Payable by Subsidiaries<br />
Goh Geok Ling – – – 279 83 –<br />
Richard Hale, OBE – – – 136 58 –<br />
Tang Kin Fei 5 – – – 282 62 –<br />
Fair value of<br />
share-based<br />
compensation<br />
Brought<br />
Bonus granted for Directors’ fees Forward<br />
Salary 1 Earned the year 3 Cash-based 5 Share-based 6 Bonus Bank 2<br />
Name of Key Executive S$’000 S$’000 S$’000 S$’000 S$’000 S$’000<br />
Low Sin Leng 573 759 482 – – 984<br />
Tan Cheng Guan 5 561 1,311 482 32 – 671<br />
Koh Chiap Khiong 5 467 1,034 482 164 19 228<br />
Ng Meng Poh 484 1,265 482 – – 571<br />
Wong Weng Sun 750 5,564 1,286 – – 10,921<br />
Notes:<br />
1. The amount shown is inclusive of basic salary, fixed allowances, AWS and other emoluments.<br />
2. The Brought Forward Bonus Bank is the outstanding balance of bonus as at December 31, <strong>2011</strong> (excluding the bonus earned during the<br />
financial year). Typically, one-third of the accumulated bonus comprising Bonus Earned in the financial year and the Brought Forward Bonus<br />
is paid out in cash each year, with the balance being carried forward to the following year. The balances of the bonus bank in future will be<br />
adjusted by the yearly EVA performance of the Group and the payouts made from the Bonus Bank.<br />
3. The fair value of the share plans granted for the year is disclosed. The shares granted to key executives are contingent upon meeting<br />
performance measures. If these performance measures are not met, the key executive will not be vested with any shares.<br />
4. A sum of $90,000 was paid to Tham Kui Seng in <strong>2011</strong> for consultancy services rendered.<br />
5. Directors’ fees in cash from subsidiaries for Mr Tang Kin Fei, Mr Tan Cheng Guan and Mr Koh Chiap Khiong are payable to SCI.<br />
260 SEMBCORP INDUSTRIES ANNUAL REPORT <strong>2011</strong><br />
GROWING SUSTAINABLE BUSINESSES 261
SUPPLEMENTARY INFORMATION<br />
Year Ended December 31, <strong>2011</strong><br />
EVA STATEMENT<br />
Year Ended December 31, <strong>2011</strong><br />
(Under SGX-ST Listing Manual requirements)<br />
B. Interested Person Transactions<br />
Interested person transactions carried out during the financial year which fall under Chapter 9 of the Listing Manual<br />
of the Singapore Exchange Securities Trading Limited (SGX-ST) are as follows:<br />
Aggregate value of all interested person transactions conducted under shareholders’ mandate<br />
pursuant to Rule 920 of the SGX-ST Listing Manual (excluding transactions less than S$100,000)<br />
Sale of goods and services<br />
Temasek Holdings (Private) Limited and its Associates<br />
– PSA International Pte Ltd and its Associates 3,606<br />
– Singapore Power Ltd and its Associates 2,058<br />
– Temasek Capital (Private) Limited and its Associates 1,876<br />
– Singapore Technologies Telemedia Pte Ltd and its Associates 575<br />
8,115<br />
SMRT Corporation Ltd and its Associates 65,773<br />
Starhub Ltd and its Associates 1,791<br />
SATS Ltd and its Associates 210<br />
75,889<br />
Purchase of goods and services<br />
Temasek Holdings (Private) Limited and its Associates<br />
– Temasek Capital (Private) Limited and its Associates 1 911,440<br />
– Singapore Power Ltd and its Associates 4,032<br />
– Certis CISCO Security Pte Ltd 218<br />
915,690<br />
SMRT Corporation Ltd and its Associates 1,204<br />
Singapore Technologies Engineering Ltd and its Associates 230<br />
917,124<br />
Management and support services<br />
– Temasek Capital (Private) Limited and its Associates 2,260<br />
Total interested person transactions 995,273<br />
Note:<br />
1. This relates mainly to the purchase of gas by <strong>Sembcorp</strong> Cogen Pte Ltd from <strong>Sembcorp</strong> Gas Pte Ltd for the generation of electricity.<br />
There were no transactions which were not conducted under the shareholders’ mandate pursuant to Rule 920 of the<br />
SGX-ST Listing Manual during the period January 1, <strong>2011</strong> to December 31, <strong>2011</strong>.<br />
<strong>2011</strong><br />
S$’000<br />
<strong>2011</strong> 2010<br />
Note S$’000 S$’000<br />
Net operating profit before tax expense 1,100,006 1,207,234<br />
Adjust for:<br />
Share of associates’ and joint ventures’ profits 205,619 191,606<br />
Interest expense 1 69,337 58,540<br />
Others 2 (6,849) (3,452)<br />
Adjusted profit before interest and tax 1,368,113 1,453,928<br />
Cash operating taxes 3 (160,805) (244,863)<br />
Net operating profit after tax (NOPAT) 1,207,308 1,209,065<br />
Average capital employed 4 8,120,351 6,773,662<br />
Weighted average cost of capital 5 5.9% 5.9%<br />
Capital charge 479,101 399,646<br />
Economic Value Added (EVA) 728,207 809,419<br />
Non-controlling share of EVA (255,857) (314,722)<br />
EVA attributable to shareholders 472,350 494,697<br />
Less: Unusual Items (UI) Gains 6 – 142<br />
EVA attributable to shareholders (exclude UI) 472,350 494,555<br />
Notes:<br />
1. Interest expense includes imputed interest on present value of operating leases and capitalised interest charged to<br />
income statement upon disposal of the assets.<br />
2. Other adjustments include recovery of investment costs, timing difference of allowances made for / (write-back) of<br />
doubtful debts, warranty, inventory obsolescence and goodwill written off / impaired and construction-in-progress.<br />
3. The reported current tax is adjusted for the statutory tax impact of interest expense.<br />
4. Average capital employed is computed by taking monthly average total assets less non interest-bearing liabilities plus<br />
timing provision, goodwill written off / impaired and present value of operating leases.<br />
<strong>2011</strong> 2010<br />
Major Capital Components:<br />
Property, plant and equipment 4,045,713 3,266,548<br />
Investments 1,546,745 1,277,821<br />
Other long-term assets 690,313 532,771<br />
Net working capital and long-term liabilities 1,837,580 1,696,522<br />
Average capital employed 8,120,351 6,773,662<br />
S$’000<br />
S$’000<br />
5. The Weighted Average Cost of Capital is calculated in accordance with the <strong>Sembcorp</strong> Group EVA Policy as follows:<br />
i. Cost of Equity using Capital Asset Pricing Model with market risk premium at 5.0% (2010: 6.0%);<br />
ii. Risk-free rate of 2.69% (2010: 2.61%) based on yield-to-maturity of Singapore Government 10-year Bonds;<br />
iii. Ungeared beta ranging from 0.5 to 1.0 (2010: 0.5 to 1.0) based on <strong>Sembcorp</strong> <strong>Industries</strong>’ risk categorisation; and<br />
iv. Cost of Debt rate at 2.63% (2010: 4.15%).<br />
6. Unusual items (UI) refer to gain / loss on divestment of subsidiaries, associates, joint ventures, long-term investments<br />
and disposal of major property, plant and equipment.<br />
262 SEMBCORP INDUSTRIES ANNUAL REPORT <strong>2011</strong><br />
GROWING SUSTAINABLE BUSINESSES 263
SHAREHOLDERS’ INFORMATION<br />
CORPORATE INFORMATION<br />
Statistics of Shareholders as of March 5, 2012<br />
Issued and fully Paid-up capital:<br />
S$565,571,683.28<br />
Number of issued shares: 1,787,547,732<br />
Number / percentage of treasury shares: 3,710,023 (0.21%)<br />
Number of shareholders: 26,856<br />
Class of shares:<br />
Ordinary shares with equal voting rights @<br />
Shareholdings Held by the Public<br />
Based on information available to the company as of March 5, 2012, 50.45% * of the issued ordinary shares of the company<br />
is held by the public and therefore, the company has complied with Rule 723 of the SGX-ST Listing Manual.<br />
Substantial Shareholders Direct Interest Indirect Interest Total % *<br />
Temasek Holdings (Private) Limited 871,200,328 12,718,760 ** 883,919,088 49.55<br />
Top 20 Shareholders as of March 5, 2012<br />
No. Name No. of Ordinary Shares Held % *<br />
1 Temasek Holdings (Private) Limited 871,200,328 48.84<br />
2 Citibank Nominees Singapore Pte Ltd 189,377,894 10.62<br />
3 DBSN Services Pte Ltd 163,429,261 9.16<br />
4 DBS Nominees Pte Ltd 152,344,201 8.54<br />
5 HSBC (Singapore) Nominees Pte Ltd 121,318,411 6.80<br />
6 United Overseas Bank Nominees Pte Ltd 44,663,677 2.51<br />
7 Raffles Nominees (Pte) Ltd 26,171,580 1.47<br />
8 Startree Investments Pte Ltd 9,400,000 0.53<br />
9 OCBC Nominees Singapore Pte Ltd 6,091,416 0.34<br />
10 BNP Paribas Securities Services 5,756,378 0.32<br />
11 DB Nominees (S) Pte Ltd 4,342,124 0.24<br />
12 Merrill Lynch (Singapore) Pte Ltd 4,304,749 0.24<br />
13 Tang Kin Fei 3,593,826 0.20<br />
14 Bank Of Singapore Nominees Pte Ltd 3,558,915 0.20<br />
15 BNP Paribas Nominees Singapore Pte Ltd 2,705,667 0.15<br />
16 UOB Kay Hian Pte Ltd 2,701,765 0.15<br />
17 Phillip Securities Pte Ltd 2,613,418 0.15<br />
18 DBS Vickers Securities (S) Pte Ltd 1,535,961 0.09<br />
19 OCBC Securities Private Ltd 1,465,030 0.08<br />
20 Low Sin Leng 1,460,987 0.08<br />
1,618,035,588 90.71<br />
@ Ordinary shares purchased and held as treasury shares by the company will have no voting rights.<br />
* The percentage of issued ordinary shares is calculated based on the number of issued ordinary shares of the company as of March 5, 2012 excluding<br />
3,710,023 ordinary shares held as treasury shares as at that date.<br />
** Temasek is deemed to be interested in the 12,718,760 Shares in which its subsidiaries and / or associated companies have or are deemed to have an<br />
interest pursuant to Section 7 of the Companies Act.<br />
Analysis of Shareholdings as of March 5, 2012<br />
No. of Ordinary<br />
No. of Ordinary<br />
Range of Shareholdings Shareholders % Shares Held %<br />
1 – 999 2,969 11.05 1,603,330 0.09<br />
1,000 – 10,000 21,215 79.00 68,636,271 3.84<br />
10,001 – 1,000,000 2,647 9.86 90,968,056 5.09<br />
1,000,001 and above 25 0.09 1,626,340,075 90.98<br />
26,856 100.00 1,787,547,732 100.00<br />
264 SEMBCORP INDUSTRIES ANNUAL REPORT <strong>2011</strong><br />
Registered Office<br />
30 Hill Street #05-04<br />
Singapore 179360<br />
Tel: (65) 6723 3113<br />
Fax: (65) 6822 3254<br />
www.sembcorp.com<br />
Board of Directors<br />
Ang Kong Hua<br />
Chairman<br />
Tang Kin Fei<br />
Group President & CEO<br />
Goh Geok Ling<br />
Evert Henkes<br />
Bobby Chin Yoke Choong<br />
Margaret Lui<br />
Tan Sri Mohd Hassan Marican<br />
Tham Kui Seng<br />
Executive Committee<br />
Ang Kong Hua<br />
Chairman<br />
Goh Geok Ling<br />
Tang Kin Fei<br />
Margaret Lui<br />
Audit Committee<br />
Bobby Chin Yoke Choong<br />
Chairman<br />
Tan Sri Mohd Hassan Marican<br />
Evert Henkes<br />
Executive Resource<br />
& Compensation Committee<br />
Ang Kong Hua<br />
Chairman<br />
Goh Geok Ling<br />
Margaret Lui<br />
Nominating Committee<br />
Ang Kong Hua<br />
Chairman<br />
Goh Geok Ling<br />
Margaret Lui<br />
Risk Committee<br />
Evert Henkes<br />
Chairman<br />
Bobby Chin Yoke Choong<br />
Tan Sri Mohd Hassan Marican<br />
Company Secretary<br />
Kwong Sook May<br />
Registrar<br />
M & C Services Private Limited<br />
138 Robinson Road #17-00<br />
The Corporate Office<br />
Singapore 068906<br />
Tel: (65) 6227 6660<br />
Fax: (65) 6225 1452<br />
Principal Bankers<br />
Australia and New Zealand<br />
Banking Group Limited<br />
10 Collyer Quay #21-00<br />
Ocean Financial Centre<br />
Singapore 049315<br />
CIMB Bank Berhad<br />
50 Raffles Place #09-01<br />
Singapore Land Tower<br />
Singapore 048623<br />
DBS Bank<br />
6 Shenton Way<br />
DBS Building, Tower One<br />
Singapore 068809<br />
Maybank<br />
2 Battery Road<br />
Maybank Tower<br />
Singapore 049907<br />
Mizuho Corporate Bank<br />
168 Robinson Road<br />
#11-01 Capital Tower<br />
Singapore 068912<br />
Natixis<br />
50 Raffles Place, #41-01<br />
Singapore Land Tower<br />
Singapore 048623<br />
Oversea-Chinese<br />
Banking Corporation<br />
65 Chulia Street<br />
OCBC Centre<br />
Singapore 049513<br />
Standard Chartered Bank<br />
8 Marina Boulevard<br />
#27-01 Marina Bay Financial Centre<br />
Tower 1<br />
Singapore 018981<br />
Sumitomo Mitsui<br />
Banking Corporation<br />
3 Temasek Avenue #06-01<br />
Centennial Tower<br />
Singapore 039190<br />
The Bank of Tokyo-Mitsubishi UFJ<br />
9 Raffles Place #01-01<br />
Republic Plaza<br />
Singapore 048619<br />
The Hongkong and Shanghai<br />
Banking Corporation<br />
21 Collyer Quay Level 3<br />
HSBC Building<br />
Singapore 049320<br />
United Overseas Bank<br />
1 Raffles Place #10-00<br />
One Raffles Place<br />
Singapore 048616<br />
Auditors<br />
KPMG LLP<br />
Certified Public Accountants<br />
16 Raffles Quay #22-00<br />
Hong Leong Building<br />
Singapore 048581<br />
Partner-in-Charge: Lau Kam Yuen<br />
(Appointed during the financial year ended<br />
December 31, 2010)<br />
GROWING SUSTAINABLE BUSINESSES 265
NOTICE OF ANNUAL GENERAL MEETING<br />
<strong>Sembcorp</strong> <strong>Industries</strong> Ltd<br />
Co Regn No. 199802418D<br />
(Incorporated in the Republic of Singapore)<br />
Notice is hereby given that the Fourteenth <strong>Annual</strong> General Meeting of <strong>Sembcorp</strong> <strong>Industries</strong> Ltd (the “Company”) will be<br />
held at the Multi-function Room, <strong>Sembcorp</strong> <strong>Industries</strong> Ltd, Level 1, 30 Hill Street, Singapore 179360 on Tuesday, April 24,<br />
2012 at 11.00 a.m. for the following purposes:<br />
Ordinary Business<br />
1. To receive and adopt the Directors’ <strong>Report</strong> and Audited Accounts for the year ended December 31,<br />
<strong>2011</strong> and the Auditors’ <strong>Report</strong> thereon.<br />
Resolution 1<br />
Special Business<br />
To consider and, if thought fit, to pass the following resolutions which will be proposed as Ordinary<br />
Resolutions:<br />
8. That authority be and is hereby given to the directors to:<br />
a. i. issue shares in the capital of the Company (“shares”) whether by way of rights, bonus or<br />
otherwise; and / or<br />
ii.<br />
make or grant offers, agreements or options (collectively, “Instruments”) that might or would<br />
require shares to be issued, including but not limited to the creation and issue of (as well as<br />
adjustments to) warrants, debentures or other instruments convertible into shares,<br />
Resolution 9<br />
2. To declare a final tax exempt 1-Tier dividend of 17 cents per ordinary share comprising final ordinary<br />
dividend of 15 cents per ordinary share and final bonus dividend of 2 cents per ordinary share for the<br />
year ended December 31, <strong>2011</strong>.<br />
3. To re-elect the following directors, each of whom will retire by rotation pursuant to Article 93 of the<br />
Company’s Articles of Association and who, being eligible, will offer themselves for re-election:<br />
a. Evert Henkes (Independent Member of Audit Committee)<br />
b. Bobby Chin Yoke Choong (Independent Chairman of Audit Committee)<br />
4. To re-elect Tham Kui Seng, a director retiring pursuant to Article 99 of the Company’s Articles of<br />
Association and who, being eligible, will offer himself for re-election.<br />
5. To re-appoint Goh Geok Ling, a director retiring under Section 153 of the Companies Act, Cap. 50, to<br />
hold office from the date of this <strong>Annual</strong> General Meeting until the next <strong>Annual</strong> General Meeting.<br />
6. To approve directors’ fees of S$1,280,613 for the year ended December 31, <strong>2011</strong>, comprising:<br />
a. S$896,429 to be paid in cash (2010: S$937,626); and<br />
b. S$384,184 to be paid in the form of restricted share awards under the <strong>Sembcorp</strong> <strong>Industries</strong><br />
Restricted Share Plan 2010 (2010: 224,564 * ), with the number of shares to be awarded rounded<br />
down to the nearest hundred and any residual balance settled in cash.<br />
* 2010 values based on fair value (of $2.48 per share on December 31, 2010) of shares awarded to non-executive<br />
directors under the previous SembCorp <strong>Industries</strong> Restricted Stock Plan in recognition of their contributions for 2010.<br />
This amount did not form part of the directors’ fees for 2010, and is for comparison purposes only. These shares vested<br />
on April 8, <strong>2011</strong>.<br />
7. To re-appoint KPMG LLP as Auditors of the Company and to authorise the directors to fix their<br />
remuneration.<br />
Resolution 2<br />
Resolution 3<br />
Resolution 4<br />
Resolution 5<br />
Resolution 6<br />
Resolution 7<br />
Resolution 8<br />
at any time and upon such terms and conditions and for such purposes and to such persons as the<br />
directors may, in their absolute discretion, deem fit; and<br />
b. (notwithstanding the authority conferred by this Resolution may have ceased to be in force) issue<br />
shares in pursuance of any Instrument made or granted by the directors while this Resolution was<br />
in force,<br />
provided that:<br />
(1) the aggregate number of shares to be issued pursuant to this Resolution (including shares to be<br />
issued in pursuance of Instruments made or granted pursuant to this Resolution) does not exceed<br />
50% of the total number of issued shares in the capital of the Company excluding treasury shares<br />
(as calculated in accordance with paragraph (2) below), of which the aggregate number of shares<br />
to be issued other than on a pro rata basis to shareholders of the Company (including shares to be<br />
issued in pursuance of Instruments made or granted pursuant to this Resolution) shall not exceed<br />
5% of the total number of issued shares in the capital of the Company excluding treasury shares<br />
(as calculated in accordance with paragraph (2) below);<br />
(2) (subject to such manner of calculation as may be prescribed by the Singapore Exchange Securities<br />
Trading Limited (“SGX-ST”)) for the purpose of determining the aggregate number of shares that<br />
may be issued under paragraph (1) above, the percentage of issued shares shall be based on the<br />
total number of issued shares in the capital of the Company excluding treasury shares at the time<br />
this Resolution is passed, after adjusting for:<br />
(i) new shares arising from the conversion or exercise of any convertible securities or share options<br />
or vesting of share awards which are outstanding or subsisting at the time this Resolution is<br />
passed; and<br />
(ii) any subsequent bonus issue or consolidation or subdivision of shares;<br />
(3) in exercising the authority conferred by this Resolution, the Company shall comply with the<br />
provisions of the Listing Manual of the SGX-ST for the time being in force (unless such compliance<br />
has been waived by the SGX-ST) and the Articles of Association for the time being of the Company;<br />
and<br />
266 SEMBCORP INDUSTRIES ANNUAL REPORT <strong>2011</strong><br />
(4) (unless revoked or varied by the Company in General Meeting) the authority conferred by this<br />
Resolution shall continue in force until the conclusion of the next <strong>Annual</strong> General Meeting of the<br />
Company or the date by which the next <strong>Annual</strong> General Meeting of the Company is required by<br />
law to be held, whichever is the earlier.<br />
GROWING SUSTAINABLE BUSINESSES 267
NOTICE OF ANNUAL GENERAL MEETING<br />
9. That approval be and is hereby given to the directors to:<br />
a. grant awards in accordance with the provisions of the <strong>Sembcorp</strong> <strong>Industries</strong> Performance Share Plan<br />
2010 (the “SCI PSP 2010”) and / or the <strong>Sembcorp</strong> <strong>Industries</strong> Restricted Share Plan 2010 (the “SCI RSP<br />
2010”) (the SCI PSP 2010 and SCI RSP 2010, together the “Share Plans”); and<br />
b. allot and issue from time to time such number of fully paid-up ordinary shares in the capital of the<br />
Company as may be required to be delivered pursuant to the vesting of awards under the Share<br />
Plans;<br />
provided that:<br />
(1) the aggregate number of (i) new ordinary shares allotted and issued and / or to be allotted and<br />
issued, (ii) existing ordinary shares (including shares held in treasury) delivered and / or to be<br />
delivered, and (iii) ordinary shares released and / or to be released in the form of cash in lieu of<br />
ordinary shares, pursuant to the Share Plans, shall not exceed 7% of the total number of issued<br />
ordinary shares in the capital of the Company (excluding treasury shares) from time to time; and<br />
(2) the aggregate number of ordinary shares under awards to be granted pursuant to the Share Plans<br />
during the period commencing from this <strong>Annual</strong> General Meeting and ending on the date of the<br />
next <strong>Annual</strong> General Meeting of the Company or the date by which the next <strong>Annual</strong> General<br />
Meeting of the Company is required by law to be held, whichever is the earlier, shall not exceed<br />
1% of the total number of issued ordinary shares in the capital of the Company (excluding treasury<br />
shares) from time to time.<br />
10. To transact any other business.<br />
By Order of the Board<br />
Kwong Sook May<br />
Company Secretary<br />
March 29, 2012<br />
Resolution 10<br />
Explanatory Notes:<br />
Resolutions 3 to 6 – Detailed information on these directors can be found under the Board of Directors and Corporate<br />
Governance <strong>Report</strong> sections in the <strong>Annual</strong> <strong>Report</strong> <strong>2011</strong>.<br />
If re-elected, Mr Evert Henkes will remain as a member of the Audit Committee and the Chairman of the Risk Committee.<br />
Mr Henkes is an independent director.<br />
If re-elected, Mr Bobby Chin Yoke Choong will remain as the Chairman of the Audit Committee and a member of the Risk<br />
Committee. Mr Chin is an independent director.<br />
Resolution 7 – is to approve the payment of directors’ fees, comprising a cash component and a share component. Detailed<br />
information on compensation to the non-executive directors can be found under the Corporate Governance <strong>Report</strong> section<br />
in the <strong>Annual</strong> <strong>Report</strong> <strong>2011</strong>.<br />
The directors’ fees will only be paid after shareholders’ approval has been obtained at the forthcoming <strong>Annual</strong> General<br />
Meeting (“AGM”) of the Company. To align the interests of the non-executive directors with the interests of shareholders,<br />
up to 30% of the aggregate directors’ fees approved by shareholders for a particular financial year may be paid out in the<br />
form of restricted share awards under the <strong>Sembcorp</strong> <strong>Industries</strong> Restricted Share Plan 2010.<br />
For year <strong>2011</strong>, the awards granted under the <strong>Sembcorp</strong> <strong>Industries</strong> Restricted Share Plan 2010 to all directors as part of their<br />
directors’ fees (except for Mr Tang Kin Fei, who is the Group President & CEO, and who does not receive any directors’ fees)<br />
will consist of the grant of fully paid shares outright with no performance and vesting conditions attached, but with a<br />
selling moratorium. Non-executive directors are required to hold shares (including shares obtained by other means) worth<br />
at least one-time the annual base retainer (currently S$65,000); any excess may be sold as desired. A non-executive director<br />
can dispose of all of his shares one year after leaving the Board.<br />
The actual number of shares to be awarded to each non-executive director will be determined by reference to the volumeweighted<br />
average price of a share on the SGX-ST over the 14 trading days immediately following the date of the AGM. The<br />
number of shares to be awarded will be rounded down to the nearest hundred and any residual balance will be settled<br />
in cash.<br />
Resolution 9 – is to empower the directors to issue shares in the capital of the Company and to make or grant Instruments<br />
(such as warrants or debentures) convertible into shares, and to issue shares in pursuance of such Instruments, up to a<br />
number not exceeding 50% of the total number of issued shares in the capital of the Company excluding treasury shares, of<br />
which up to 5% may be issued other than on a pro rata basis to shareholders. The aggregate number of shares which may<br />
be issued shall be based on the total number of issued shares in the capital of the Company excluding treasury shares at the<br />
time that Resolution 9 is passed, after adjusting for (a) new shares arising from the conversion or exercise of any convertible<br />
securities or share options or vesting of share awards which are outstanding or subsisting at the time that Resolution 9 is<br />
passed, and (b) any subsequent bonus issue or consolidation or subdivision of shares.<br />
268 SEMBCORP INDUSTRIES ANNUAL REPORT <strong>2011</strong><br />
Resolution 10 – is to empower the directors to offer and grant awards pursuant to the <strong>Sembcorp</strong> <strong>Industries</strong> Performance<br />
Share Plan 2010 and the <strong>Sembcorp</strong> <strong>Industries</strong> Restricted Share Plan 2010 (collectively, the “Share Plans”) and to issue ordinary<br />
shares in the capital of the Company pursuant to the vesting of awards granted pursuant to the Share Plans provided that: (a)<br />
the aggregate number of (i) new ordinary shares allotted and issued and / or to be allotted and issued, (ii) existing ordinary<br />
shares (including shares held in treasury) delivered and / or to be delivered, and (iii) ordinary shares released and / or to be<br />
released in the form of cash in lieu of ordinary shares, pursuant to the Share Plans shall not exceed 7% of the total number<br />
of issued ordinary shares in the capital of the Company (excluding treasury shares) from time to time; and (b) the aggregate<br />
number of ordinary shares under awards to be granted pursuant to the Share Plans during the period commencing from this<br />
<strong>Annual</strong> General Meeting to the next <strong>Annual</strong> General Meeting shall not exceed 1% of the total number of issued ordinary<br />
shares in the capital of the Company (excluding treasury shares) from time to time. Approval for the adoption of the Share<br />
Plans was given by shareholders at an Extraordinary General Meeting of the Company held on April 22, 2010. The grant of<br />
awards under the Share Plans will be made in accordance with their respective provisions.<br />
GROWING SUSTAINABLE BUSINESSES 269
NOTICE OF ANNUAL GENERAL MEETING<br />
PROXY FORM<br />
Notes:<br />
1. A member of the Company entitled to attend and vote at the <strong>Annual</strong> General Meeting is entitled to appoint not more than two proxies to attend<br />
and vote in his stead. A proxy need not be a member of the Company.<br />
2. The instrument appointing a proxy must be lodged at the office of the Company’s Registrar, M & C Services Private Limited, 138 Robinson Road,<br />
#17-00 The Corporate Office, Singapore 068906 not later than 48 hours before the time appointed for the <strong>Annual</strong> General Meeting.<br />
Notice of Books Closure and Dividend Payment Date<br />
NOTICE IS HEREBY GIVEN that the Register of Members and Share Transfer Books of the Company will be closed on<br />
May 2, 2012 to determine the shareholders’ entitlements to the proposed dividend. Duly completed transfers of shares<br />
received by the Company’s Share Registrar, M & C Services Private Limited at 138 Robinson Road #17-00, The Corporate<br />
Office, Singapore 068906, up to 5.00 p.m. on April 30, 2012 (the “Book Closure Date”) will be registered to determine<br />
shareholders’ entitlements to the proposed dividend. Subject as aforesaid, shareholders whose securities accounts with<br />
The Central Depository (Pte) Limited are credited with ordinary shares in the capital of the Company as at 5.00 p.m. on the<br />
Book Closure Date will be entitled to the proposed dividend.<br />
<strong>Sembcorp</strong> <strong>Industries</strong> Ltd<br />
Co Regn No. 199802418D<br />
(Incorporated in the Republic of Singapore)<br />
Fourteenth <strong>Annual</strong> General Meeting<br />
I / We, (Name), (NRIC / Passport No.)<br />
of<br />
being a member / members of SEMBCORP INDUSTRIES LTD hereby appoint:<br />
IMPORTANT<br />
1. For investors who have used their CPF monies to buy <strong>Sembcorp</strong> <strong>Industries</strong> Ltd’s shares, this report is<br />
forwarded to them at the request of their CPF Approved Nominees solely FOR INFORMATION ONLY.<br />
2. This Proxy Form is not valid for use by CPF investors and shall be ineffective for all intents and<br />
purposes if used or purported to be used by them.<br />
3. CPF Investors who wish to vote should contact their CPF Approved Nominees.<br />
(Address)<br />
Name Address NRIC / Passport No. % of Shareholdings<br />
The proposed dividend, if approved by the members at the <strong>Annual</strong> General Meeting, will be paid on May 15, 2012.<br />
and / or (delete as appropriate)<br />
Name Address NRIC / Passport No. % of Shareholdings<br />
Glue and seal along the edge<br />
as my / our proxy / proxies to attend and vote for me / us on my / our behalf and, if necessary, to demand a poll, at the<br />
<strong>Annual</strong> General Meeting of the Company to be held on Tuesday, April 24, 2012 at 11.00 a.m. at the Multi-function Room,<br />
<strong>Sembcorp</strong> <strong>Industries</strong> Ltd, Level 1, 30 Hill Street, Singapore 179360 and at any adjournment thereof.<br />
(Please indicate with an “X” in the spaces provided whether you wish your vote(s) to be cast for or against the Resolutions as set out in the Notice of<br />
<strong>Annual</strong> General Meeting. In the absence of specific directions, the proxy / proxies will vote or abstain as he / they may think fit, as he / they will on any<br />
other matter arising at the <strong>Annual</strong> General Meeting.)<br />
Resolutions For Against<br />
ORDINARY BUSINESS<br />
1. To adopt the Directors’ <strong>Report</strong> and Accounts<br />
2. To declare a final dividend<br />
3. To re-elect Evert Henkes<br />
4. To re-elect Bobby Chin Yoke Choong<br />
5. To re-elect Tham Kui Seng<br />
6. To re-appoint Goh Geok Ling<br />
7. To approve directors’ fees for financial year ended December 31, <strong>2011</strong><br />
8. To re-appoint KPMG LLP as Auditors and to fix their remuneration<br />
SPECIAL BUSINESS<br />
9. To approve the renewal of Share Issue Mandate<br />
10.<br />
To authorise the directors to grant awards and issue shares under the<br />
<strong>Sembcorp</strong> <strong>Industries</strong>’ Share Plans<br />
Glue and seal along the edge<br />
Total Number of Shares Held<br />
Signature(s) or Common Seal of Member(s)<br />
Date<br />
270 SEMBCORP INDUSTRIES ANNUAL REPORT <strong>2011</strong>
Notes:<br />
1. Please insert the total number of shares held by you. If you have shares entered against your name in the Depository Register (as defined in Section<br />
130A of the Companies Act, Chapter 50 of Singapore), you should insert that number of shares. If you have shares registered in your name in the<br />
Register of Members, you should insert that number of shares. If you have shares entered against your name in the Depository Register and shares<br />
registered in your name in the Register of Members, you should insert the aggregate number of shares entered against your name in the Depository<br />
Register and registered in your name in the Register of Members. If no number is inserted, the instrument appointing a proxy or proxies shall be<br />
TENTS<br />
deemed to relate to all the shares held by you.<br />
2. A member entitled to attend and vote at a meeting of the Company is entitled to appoint one or two proxies to attend and vote instead of<br />
him. Where a member appoints two proxies, the appointments shall be invalid unless he specifies the proportion of his holding (expressed as a<br />
percentage of the whole) to be represented by each proxy.<br />
3. The instrument appointing a proxy or proxies must be deposited at the office of the Company’s Registrar, M & C Services Private Limited, 138<br />
Robinson Road, #17-00 The Corporate Office, Singapore 068906 not less than 48 hours before the time appointed for the <strong>Annual</strong> General Meeting.<br />
1st FOLD<br />
4. The instrument appointing a proxy or proxies must be under the hand of the appointor or of his attorney duly authorised in writing. Where the<br />
instrument appointing a proxy or proxies is executed by a corporation, it must be executed either under its seal or under the hand of an officer or<br />
attorney duly authorised.<br />
5. A corporation which is a member may authorise by resolution of its directors or other governing body such person as it thinks fit to act as its<br />
Shareholders 10 Value Added and Productivity Data 34 Financial Statements<br />
representative at the <strong>Annual</strong> General Meeting, in accordance with Section 179 of the Companies Act, Chapter 50 of Singapore.<br />
nancial Highlights 16 Critical Accounting Policies 34 Directors’ <strong>Report</strong> 114<br />
6. The Company shall be entitled to reject the instrument appointing a proxy or proxies if it is incomplete, improperly completed or illegible or where the<br />
Quarterly Performance 17 Financial Risk Management 34 Statement by Directors 132<br />
true intentions of the appointor are not ascertainable from the instructions of the appointor specified in the instrument appointing a proxy or proxies.<br />
r Performance Profile 18 Treasury Management 34 Independent Auditors’ <strong>Report</strong> 133<br />
In addition, in the case of members whose shares are entered against their names in the Depository Register, the Company may reject any instrument<br />
nt Events 22 Facilities 34 Balance Sheets 134<br />
appointing a proxy or proxies lodged if such members are not shown to have shares entered against their names in the Depository Register 48 hours<br />
Borrowings 37 Consolidated Income Statement 135<br />
before the time appointed for holding the <strong>Annual</strong> General Meeting as certified by the Central Depository (Pte) Limited to the Company.<br />
ing & Financial Review<br />
Utilities Review 43 Consolidated Statement<br />
y Overview 26 Marine Review 49 of Comprehensive Income 136<br />
ess Description 26 Integrated Urban Development Review 55 Consolidated Statement<br />
tive & Strategies 26<br />
of Changes in Equity 137<br />
tructure 30 Environmental, Social<br />
Consolidated Statement of Cash Flows 141<br />
eview 2nd FOLD<br />
32 & Governance Review<br />
Notes to the Financial Statements 143<br />
iew 32 Board of Directors 60 Supplementary Information 260<br />
ver 32 Key Executives 64 EVA Statement 263<br />
rofit 32 Corporate Governance 68 Shareholders’ Information 264<br />
Flow and Liquidity 32 Risk Management &<br />
Corporate Information 265<br />
Postage will be<br />
cial Position 33 Mitigation Strategies 80 Notice of <strong>Annual</strong> General Meeting 266 paid by addressee.<br />
holder Returns 34 Investor Relations 85 Proxy Form<br />
For posting in<br />
271 Singapore only.<br />
mic Value Added 34 Sustainability BUSINESS REPLY SERVICE 88 Financial Calendar Inside Back Cover<br />
PERMIT NO. 06735<br />
<strong>Sembcorp</strong> <strong>Industries</strong> Financial Calendar 2012<br />
February 27, 2012 Announcement of full year results for the period ending December 31, <strong>2011</strong><br />
April 24, 2012<br />
14 th <strong>Annual</strong> General Meeting<br />
April 26, 2012<br />
Ex-dividend date for <strong>2011</strong> final dividend<br />
May 11, 2012 * Announcement of first quarter results for the period ending March 31, 2012<br />
May 15, 2012<br />
Payment of <strong>2011</strong> final dividend<br />
August 3, 2012 * Announcement of first half results for the period ending June 30, 2012<br />
November 9, 2012 * Announcement of third quarter results for the period ending September 30, 2012<br />
*<br />
Provisional. Updates will be posted at www.sembcorp.com<br />
The Company Secretary<br />
<strong>Sembcorp</strong> <strong>Industries</strong> Ltd<br />
c/o M & C Services Private Limited<br />
138 Robinson Road #17-00<br />
The Corporate Office<br />
Singapore 068906<br />
Identification no.: 003-031<br />
The full-colour section of this report is printed on paper containing recycled pulp from pre-consumer<br />
and post-consumer waste. This report is printed using soy-based ink, which is more environmentally<br />
friendly as opposed to traditional petroleum-based ink.<br />
3rd FOLD
<strong>Sembcorp</strong> <strong>Industries</strong> Ltd<br />
30 Hill Street #05-04<br />
Singapore 179360<br />
Tel: (65) 6723 3113<br />
Fax: (65) 6822 3254<br />
www.sembcorp.com<br />
Co Regn No. 199802418D<br />
<strong>Sembcorp</strong>’s power and desalination facility in Salalah, Oman