FINANCIAL STATEMENTS (Full Version) - Sembcorp
FINANCIAL STATEMENTS (Full Version) - Sembcorp
FINANCIAL STATEMENTS (Full Version) - Sembcorp
- No tags were found...

Create successful ePaper yourself
Turn your PDF publications into a flip-book with our unique Google optimized e-Paper software.
Financial StatementsDirectors’ Report 134Statement by Directors 151Independent Auditors’ Report 152Balance Sheets 153Consolidated Income Statement 154Consolidated Statement of Comprehensive Income 155Consolidated Statement of Changes in Equity 156Consolidated Statement of Cash Flows 162Notes to the Financial Statements 164Supplementary Information 275EVA Statement 278Shareholders’ Information 279Corporate Information 281Notice of Annual General Meeting 282Proxy Form 287
Directors’ ReportYear ended December 31, 2012Directors’ ReportWe are pleased to submit this annual report to the members of the Company together with the audited financial statements forthe financial year ended December 31, 2012.DirectorsThe directors in office at the date of this report are as follows:Ang Kong HuaTang Kin FeiGoh Geok LingEvert HenkesBobby Chin Yoke ChoongMargaret LuiTan Sri Mohd Hassan MaricanTham Kui SengDr Teh Kok Peng (appointed on October 15, 2012)Directors’ InterestsAccording to the register kept by the Company for the purposes of Section 164 of the Singapore Companies Act, Chapter 50 (the“Act”), particulars of interests of directors who held office at the end of the financial year (including those held by their spousesand infant children) in shares, debentures, warrants and share options in the Company and in related corporations are as follows:Shareholdings registered in the name Other shareholdings in which directorof director, spouse or infant children is deemed to have an interestAtAtbeginningbeginningName of director of the year / At of the year / Atand corporation At date of end of At At date of end of Atin which interests held Description of interests Exercise period appointment the year 21/01/2013 appointment the year 21/01/2013Ang Kong Hua<strong>Sembcorp</strong> Industries Ltd Ordinary shares 20,300 36,500 36,500 – – –Tang Kin Fei<strong>Sembcorp</strong> Industries Ltd Ordinary shares 3,593,826 3,936,206 3,936,206 – – –Options to subscribefor ordinary shares at– S$2.36 per share 22/11/2006 150,000 150,000 150,000 – – –to 21/11/2015– S$2.52 per share 10/06/2007 300,000 300,000 300,000 – – –to 09/06/2016Conditional award of:– 400,000 performance Up to – – – – –shares to be delivered 600,000after 2011 (Note 1a)– 400,000 performance Up to Up to Up to – – –shares to be delivered 600,000 600,000 600,000after 2012 (Note 1b)Directors’ Interests (cont’d)Shareholdings registered in the name Other shareholdings in which directorof director, spouse or infant children is deemed to have an interestAtAtbeginningbeginningName of director of the year / At of the year / Atand corporation At date of end of At At date of end of Atin which interests held Description of interests Exercise period appointment the year 21/01/2013 appointment the year 21/01/2013Tang Kin Fei (cont’d)<strong>Sembcorp</strong> Industries LtdConditional award of:– 400,000 performance Up to Up to Up to – – –shares to be delivered 600,000 600,000 600,000after 2013 (Note 1c)– 400,000 performance – Up to Up to – – –shares to be delivered 600,000 600,000after 2014 (Note 1d)– 126,000 restricted 41,160 – – – – –shares to be deliveredafter 2009 (Note 2a(i))– 126,000 restricted 100,800 50,400 50,400 – – –shares to be deliveredafter 2010 (Note 2b(i))– 126,000 restricted Up to 101,640 101,640 – – –shares to be delivered 189,000after 2011 (Note 2c)– 126,000 restricted Up to Up to Up to – – –shares to be delivered 189,000 189,000 189,000after 2012 (Note 2d)– 126,000 restricted – Up to Up to – – –shares to be delivered 189,000 189,000after 2013 (Note 2e)<strong>Sembcorp</strong> Marine Ltd Ordinary shares 182,570 209,670 209,670 – – –Conditional award of:– 12,000 restricted 6,000 – – – – –shares to be deliveredafter 2009 (Note 2a(ii))– 17,000 restricted 17,000 8,500 8,500 – – –shares to be deliveredafter 2010 (Note 2b(ii))134 Powering the Future <strong>Sembcorp</strong> Industries Annual Report 2012 135
Directors’ ReportDirectors’ ReportDirectors’ Interests (cont’d)Shareholdings registered in the name Other shareholdings in which directorof director, spouse or infant children is deemed to have an interestAtAtbeginningbeginningName of director of the year / At of the year / Atand corporation At date of end of At At date of end of Atin which interests held Description of interests Exercise period appointment the year 21/01/2013 appointment the year 21/01/2013Directors’ Interests (cont’d)Shareholdings registered in the name Other shareholdings in which directorof director, spouse or infant children is deemed to have an interestAtAtbeginningbeginningName of director of the year / At of the year / Atand corporation At date of end of At At date of end of Atin which interests held Description of interests Exercise period appointment the year 21/01/2013 appointment the year 21/01/2013Tang Kin Fei (cont’d)<strong>Sembcorp</strong> FinancialServices Pte LtdFixed Rate Notesissued under theS$1.5 BillionMulticurrencyMedium Term Note Principal Principal PrincipalProgramme (Note 3) amount: amount: amount:– Due 2014 S$500,000 S$500,000 S$500,000 – – –– Due 2020 S$500,000 S$500,000 S$500,000 – – –Evert Henkes<strong>Sembcorp</strong> Industries Ltd Ordinary shares 113,018 130,604 130,604 – – –Conditional award of:– 7,000 restricted 2,286 – – – – –shares to be deliveredafter 2009 (Note 2a(v))– 7,000 restricted 5,600 2,800 2,800 – – –shares to be deliveredafter 2010 (Note 2b(v))Goh Geok Ling<strong>Sembcorp</strong> Industries Ltd Ordinary shares 484,320 503,874 503,874 47,000 47,000 47,000Conditional award of:– 13,700 restricted 4,474 – – – – –shares to be deliveredafter 2009 (Note 2a(iii))– 13,700 restricted 10,960 5,480 5,480 – – –shares to be deliveredafter 2010 (Note 2b(iii))<strong>Sembcorp</strong> Marine Ltd Ordinary shares 293,040 335,540 335,540 – – –Conditional award of:– 22,000 restricted 11,000 – – – – –shares to be deliveredafter 2009 (Note 2a(iv))– 29,000 restricted 29,000 14,500 14,500 – – –shares to be deliveredafter 2010 (Note 2b(iv))Bobby Chin Yoke Choong<strong>Sembcorp</strong> Industries Ltd Ordinary shares 15,400 30,100 30,100 – – –Conditional award of:– 11,000 restricted 8,800 4,400 4,400 – – –shares to be deliveredafter 2010 (Note 2b(vi))Margaret Lui<strong>Sembcorp</strong> Industries Ltd Ordinary shares – 9,700 9,700 – – –Tan Sri Mohd Hassan Marican<strong>Sembcorp</strong> Industries Ltd Ordinary shares – – – – 10,100 10,100<strong>Sembcorp</strong> Marine Ltd Ordinary shares – – – – 1,800 1,800Tham Kui Seng<strong>Sembcorp</strong> Industries Ltd Ordinary shares – 3,300 3,300 – – –Dr Teh Kok Peng<strong>Sembcorp</strong> Marine Ltd Ordinary shares 40,000 40,000 40,000 – – –136 Powering the Future <strong>Sembcorp</strong> Industries Annual Report 2012 137
Directors’ ReportDirectors’ ReportDirectors’ Interests (cont’d)Note 1:Note 2:Note 3:The actual number to be delivered will depend on the achievement of set targets over a 3-year period as indicated below. Achievement of targets belowthreshold level will mean no performance shares will be delivered, while achievement up to 150% will mean up to 1.5 times the number of conditionalperformance shares awarded could be delivered.a. Period from 2009 to 2011 *b. Period from 2010 to 2012c. Period from 2011 to 2013d. Period from 2012 to 2014* For this period, 600,000 <strong>Sembcorp</strong> Industries Ltd (SCI) shares were released to Tang Kin Fei on March 26, 2012.The actual number to be delivered will depend on the achievement of set targets at the end of the 2-year performance period as indicated below.Achievement of targets below threshold level will mean no restricted shares will be delivered, while achievement up to 150% will mean up to 1.5 timesthe number of conditional restricted shares awarded could be delivered.a. Period from 2008 to 2009 **b. Period from 2009 to 2010^c. Period from 2010 to 2011 #d. Period from 2011 to 2012e. Period from 2012 to 2013** i. For this period, 41,160 SCI shares (the final release of the 1/3 of the 123,480 shares) were vested under the award to Tang Kin Fei on March26, 2012. The 1st and 2nd release of 41,160 shares each have been vested in 2010 and 2011 respectively.ii. For this period, 6,000 <strong>Sembcorp</strong> Marine Ltd (SCM) shares (the final release of the 1/3 of the 18,000 shares) were vested under the award toTang Kin Fei on March 5, 2012. The 1st and 2nd release of 6,000 shares each have been vested in 2010 and 2011 respectively.iii. For this period, 4,474 SCI shares (the final release of the 1/3 of the 13,426 shares) were vested under the award to Goh Geok Ling on March26, 2012. The 1st and 2nd release of 4,476 shares each have been vested in 2010 and 2011 respectively.iv. For this period, 11,000 SCM shares (the final release of the 1/3 of the 33,000 shares) were vested under the award to Goh Geok Ling onMarch 5, 2012. The 1st and 2nd release of 11,000 shares each have been vested in 2010 and 2011 respectively.v. For this period, 2,286 SCI shares (the final release of the 1/3 of the 6,860 shares) were vested under the award to Evert Henkes on March 26,2012. The 1st and 2nd release of 2,287 shares each have been vested in 2010 and 2011 respectively.^ i. For this period, 50,400 SCI shares (2nd release of the 1/3 of the 151,200 shares) were vested under the award to Tang Kin Fei on March 26,2012 and the remaining 50,400 shares will be vested in year 2013. The 1st release of 50,400 shares has been vested on March 23, 2011.ii. For this period, 8,500 SCM shares (2nd release of the 1/3 of the 25,500 shares) were vested under the award to Tang Kin Fei on March 5,2012 and the remaining 8,500 shares will be vested in year 2013. The 1st release of 8,500 shares has been vested on March 15, 2011.iii. For this period, 5,480 SCI shares (2nd release of the 1/3 of the 16,440 shares) were vested under the award to Goh Geok Ling on March 26,2012 and the remaining 5,480 shares will be vested in year 2013. The 1st release of 5,480 shares has been vested on March 23, 2011.iv. For this period, 14,500 SCM shares (2nd release of the 1/3 of the 43,500 shares) were vested under the award to Goh Geok Ling on March5, 2012 and the remaining 14,500 shares will be vested in year 2013. The 1st release of 14,500 shares has been vested on March 15, 2011.v. For this period, 2,800 SCI shares (2nd release of the 1/3 of the 8,400 shares) were vested under the award to Evert Henkes on March 26, 2012and the remaining 2,800 shares will be vested in year 2013. The 1st release of 2,800 shares has been vested on March 23, 2011.vi. For this period, 4,400 SCI shares (2nd release of the 1/3 of the 13,200 shares) were vested under the award to Bobby Chin Yoke Choong onMarch 26, 2012 and the remaining 4,400 shares will be vested in year 2013. The 1st release of 4,400 shares has been vested on March 23, 2011.# For this period, 50,820 SCI shares (1st release of the 1/3 of the 152,460 shares) were vested under the award to Tang Kin Fei on March 26, 2012and the remaining 101,640 shares will be vested in year 2013/2014.Fixed Rate Notes issued under the S$1.5 Billion Multicurrency Medium Term Note Programme of <strong>Sembcorp</strong> Financial Services Pte Ltd, a related companyof <strong>Sembcorp</strong> Industries Group.Except as disclosed in this report, no director who held office at the end of the financial year had interests in shares, debentures,warrants or share options of the Company, or of related corporations, either at the beginning of the financial year, or date ofappointment if later, or at the end of the financial year.There were no changes in any of the above mentioned interests in the Company between the end of the financial year andJanuary 21, 2013.Except as disclosed under the “Share-based Incentive Plans” section of this report, neither at the end of, nor at any time duringthe financial year, was the Company a party to any arrangement whose objects are, or one of whose objects is, to enable thedirectors of the Company to acquire benefits by means of the acquisition of shares in or debentures of the Company or any otherbody corporate.Share-based Incentive PlansThe Company’s Performance Share Plan (SCI PSP 2010) and Restricted Share Plan (SCI RSP 2010) (collectively, the “2010 SharePlans”) were approved and adopted by the shareholders at an Extraordinary General Meeting of the Company held on April 22,2010. The 2010 Share Plans replaced the Share Plans which were approved and adopted by the shareholders at an ExtraordinaryGeneral Meeting of the Company held on June 5, 2000 and expired in 2010.The Executive Resource & Compensation Committee (the “Committee”) of the Company has been designated as the Committeeresponsible for the administration of the Share Plans. The Committee comprises the following members, all of whom are directors:Ang Kong Hua (Chairman)Goh Geok LingMargaret LuiThe SCI RSP 2010 is the incentive scheme for directors and employees of the Group whereas the SCI PSP 2010 is aimed primarilyat key executives of the Group.The 2010 Share Plans are intended to increase the Company’s flexibility and effectiveness in its continuing efforts to attract, retainand incentivise participants to higher standards of performance and encourage greater dedication and loyalty by enabling theCompany to give recognition to past contributions and services; as well as motivating participants to contribute to the long-termprosperity of the Group. The 2010 Share Plans will strengthen the Company’s competitiveness in attracting and retaining talentedkey senior management and senior executives.The SCI RSP 2010 is intended to apply to a broad base of senior executives as well as to the non-executive directors, whilethe SCI PSP 2010 is intended to apply to a select group of key senior management. Generally, it is envisaged that the rangeof performance targets to be set under the SCI RSP 2010 and the SCI PSP 2010 will be different, with the latter emphasisingstretched or strategic targets aimed at sustaining longer term growth.The 2010 Share Plans will provide incentives to high performing key senior management and senior executives to excel in theirperformance and encourage greater dedication and loyalty to the Company. Through the 2010 Share Plans, the Company willbe able to motivate key senior management and senior executives to continue to strive for the Group’s long-term shareholdervalue. In addition, the 2010 Share Plans aim to foster a greater ownership culture within the Group which align the interests ofparticipants with the interests of shareholders, and to improve performance and achieve sustainable growth for the Company inthe changing business environment.The 2010 Share Plans use methods fairly common among major local and multinational companies to incentivise and motivatekey senior management and senior executives to achieve pre-determined targets which create and enhance economic value forshareholders. The Company believes that the 2010 Share Plans will be effective tools in motivating key senior management andsenior executives to strive to deliver long-term shareholder value.While the 2010 Share Plans cater principally to Group executives, it is recognised that there are other persons who can makesignificant contributions to the Group through their close working relationship with the Group. Such persons include employeesof associated companies over which the Company has operational control.A participant’s awards under the 2010 Share Plans will be determined at the sole discretion of the Committee. In considering anaward to be granted to a participant, the Committee may take into account, inter alia, the participant’s performance during therelevant period, and his capability, entrepreneurship, scope of responsibility and skill set.Except as disclosed in Notes 33(a) and 39 to the financial statements, since the end of the last financial year, no director hasreceived or become entitled to receive, a benefit by reason of a contract made by the Company or a related corporation with thedirector, or with a firm of which he is a member, or with a company in which he has a substantial financial interest.138 Powering the Future <strong>Sembcorp</strong> Industries Annual Report 2012 139
Directors’ ReportDirectors’ ReportShare-based Incentive Plans (cont’d)Other information regarding the 2010 Share Plans and expired Share Plans is as follows:a. Share Option PlanUnder the rules of the Share Option Plan, participants who ceased to be employed by the Group or the associated companyby reason of ill health, injury or disability, redundancy, retirement at or after the legal retirement age, retirement before thelegal retirement age, death, etc., or any other event approved by the Committee, may be allowed by the Committee to retaintheir unexercised options. The Committee may determine the number of shares comprised in that option which may beexercised and the period during which such option shall be exercisable, being a period not later than the expiry of the exerciseperiod in respect of that option. Such option may be exercised at any time notwithstanding that the date of exercise of suchoption falls on a date prior to the first day of the exercise period in respect of such option.Other information regarding the Share Option Plan is as follows:i. The exercise price of the options can be set at market price or a discount to the market price not exceeding 20% of themarket price in respect of options granted at the time of grant. Market price is the volume-weighted average price forthe shares on the Singapore Exchange Securities Trading Limited (SGX-ST) over the three consecutive trading days priorto grant date of that option. For all options granted to date, the exercise prices are set at market price.ii.After the first 12 months of lock-out period, the Group imposed a further vesting of 4 years for managers and above forretention purposes.iii. In 2012 and 2011, all options were settled by the issuance of treasury shares.iv. The options granted expire after 5 years for non-executive directors and associated company’s employees, and 10 yearsfor the employees of the Group. There are no outstanding share options for non-executive directors.v. <strong>Sembcorp</strong> Industries Ltd Share Option PlanAt the end of the financial year, details of the options granted under the Share Option Plan on unissued ordinary sharesof the Company are as follows:<strong>Sembcorp</strong> Industries LtdOrdinary shares2012Options Options Options Options OptionsExercise outstanding cancelled / outstanding exercisable exercisableDate of grant price at Options lapsed / at at atof options per share Jan 1, 2012 exercised not accepted Dec 31, 2012 Jan 1, 2012 Dec 31, 2012 Exercise period07/05/2002 S$1.23 157,250 (126,500) (30,750) – 157,250 – 08/05/2003 to 07/05/201217/10/2002 S$0.62 52,500 (26,500) (26,000) – 52,500 – 18/10/2003 to 17/10/201202/06/2003 S$0.78 31,000 (7,000) – 24,000 31,000 24,000 03/06/2004 to 02/06/201318/11/2003 S$0.93 72,000 (39,500) – 32,500 72,000 32,500 19/11/2004 to 18/11/201317/05/2004 S$0.99 174,250 (72,000) – 102,250 174,250 102,250 18/05/2005 to 17/05/201422/11/2004 S$1.16 178,625 (77,500) – 101,125 178,625 101,125 23/11/2005 to 22/11/201401/07/2005 S$2.37 383,650 (120,625) – 263,025 383,650 263,025 02/07/2006 to 01/07/201521/11/2005 S$2.36 646,000 (133,875) – 512,125 646,000 512,125 22/11/2006 to 21/11/201509/06/2006 S$2.52 1,190,664 (201,865) – 988,799 1,190,664 988,799 10/06/2007 to 09/06/20162,885,939 (805,365) (56,750) 2,023,824 2,885,939 2,023,824Share-based Incentive Plans (cont’d)a. Share Option Plan (cont’d)v. <strong>Sembcorp</strong> Industries Ltd Share Option Plan (cont’d)<strong>Sembcorp</strong> Industries LtdOrdinary shares2011Options Options Options Options OptionsExercise outstanding cancelled / outstanding exercisable exercisableDate of grant price at Options lapsed / at at atof options per share Jan 1, 2011 exercised not accepted Dec 31, 2011 Jan 1, 2011 Dec 31, 2011 Exercise period19/04/2001 S$1.19 111,100 (81,100) (30,000) – 111,100 – 20/04/2002 to 19/04/201107/05/2002 S$1.23 160,750 (3,500) – 157,250 160,750 157,250 08/05/2003 to 07/05/201217/10/2002 S$0.62 87,000 (34,500) – 52,500 87,000 52,500 18/10/2003 to 17/10/201202/06/2003 S$0.78 97,600 (65,475) (1,125) 31,000 97,600 31,000 03/06/2004 to 02/06/201318/11/2003 S$0.93 111,375 (37,375) (2,000) 72,000 111,375 72,000 19/11/2004 to 18/11/201317/05/2004 S$0.99 206,750 (29,000) (3,500) 174,250 206,750 174,250 18/05/2005 to 17/05/201422/11/2004 S$1.16 225,000 (44,250) (2,125) 178,625 225,000 178,625 23/11/2005 to 22/11/201401/07/2005 S$2.37 792,700 (391,175) (17,875) 383,650 792,700 383,650 02/07/2006 to 01/07/201521/11/2005 S$2.36 891,474 (222,349) (23,125) 646,000 891,474 646,000 22/11/2006 to 21/11/201509/06/2006 S$2.52 175,000 (175,000) – – 175,000 – 10/06/2007 to 09/06/201109/06/2006 S$2.52 1,735,790 (519,376) (25,750) 1,190,664 1,735,790 1,190,664 10/06/2007 to 09/06/20164,594,539 (1,603,100) (105,500) 2,885,939 4,594,539 2,885,939The details of options of the Company awarded / exercised since commencement of the Scheme (aggregate) to December31, 2012 are as follows:AggregateoptionsAggregate cancelled / Aggregate Aggregateoptions lapsed / options optionsOption participants granted not accepted exercised outstandingDirectorsAng Kong Hua – – – –Tang Kin Fei 3,444,052 (607,759) 1 (2,386,293) 450,000Goh Geok Ling 370,000 – (370,000) –Evert Henkes 94,000 – (94,000) –Bobby Chin Yoke Choong – – – –Margaret Lui – – – –Tan Sri Mohd Hassan Marican – – – –Tham Kui Seng – – – –Dr Teh Kok Peng – – – –Other executivesGroup 149,771,742 (69,304,038) (78,893,880) 1,573,824Associated company 748,600 (215,100) (533,500) –Parent Group 2 378,500 (113,000) (265,500) –Former directors of the Company 10,641,578 (2,383,328) (8,258,250) –Total 165,448,472 (72,623,225) (90,801,423) 2,023,824140 Powering the Future <strong>Sembcorp</strong> Industries Annual Report 2012 141
Directors’ ReportDirectors’ ReportShare-based Incentive Plans (cont’d)a. Share Option Plan (cont’d)v. <strong>Sembcorp</strong> Industries Ltd Share Option Plan (cont’d)1. Options lapsed due to replacement of 1999 options and expiry of earlier options.2. Parent Group refers to former employees of Singapore Technologies Pte Ltd. No options were granted to former employees of SingaporeTechnologies Pte Ltd since 2005.Since the commencement of the Share Option Plan, no options have been granted to the controlling shareholders ofthe Company or their associates. No participant under the Share Option Plan has been granted 5% or more of the totaloptions available. No options have been offered at a discount.The options granted by the Company do not entitle the holders of the options, by virtue of such holdings, to any rightto participate in any share issue of any company.vi. Share options of a listed subsidiaryAt the end of the financial year, details of the options granted under the Share Option Plan on unissued ordinary sharesof <strong>Sembcorp</strong> Marine Ltd are as follows:<strong>Sembcorp</strong> Marine LtdOrdinary shares2012Options Options Options Options OptionsExercise outstanding cancelled / outstanding exercisable exercisableDate of grant price at Options lapsed / at at atof options per share Jan 1, 2012 exercised not accepted Dec 31, 2012 Jan 1, 2012 Dec 31, 2012 Exercise period07/11/2002 S$0.64 125,650 (11,900) (113,750) – 125,650 – 08/11/2003 to 07/11/201208/08/2003 S$0.71 73,420 (3,000) – 70,420 73,420 70,420 09/08/2004 to 08/08/201310/08/2004 S$0.74 241,010 (47,400) (4,200) 189,410 241,010 189,410 11/08/2005 to 10/08/201411/08/2005 S$2.11 1,503,750 (551,450) (4,200) 948,100 1,503,750 948,100 12/08/2006 to 11/08/201502/10/2006 S$2.38 1,856,482 (525,830) (22,325) 1,308,327 1,856,482 1,308,327 03/10/2007 to 02/10/20163,800,312 (1,139,580) (144,475) 2,516,257 3,800,312 2,516,257<strong>Sembcorp</strong> Marine LtdOrdinary shares2011Options Options Options Options OptionsExercise outstanding cancelled / outstanding exercisable exercisableDate of grant price at Options lapsed / at at atof options per share Jan 1, 2011 exercised not accepted Dec 31, 2011 Jan 1, 2011 Dec 31, 2011 Exercise period27/09/2001 S$0.47 54,810 (21,210) (33,600) – 54,810 – 28/09/2002 to 27/09/201107/11/2002 S$0.64 161,700 (31,500) (4,550) 125,650 161,700 125,650 08/11/2003 to 07/11/201208/08/2003 S$0.71 216,470 (132,200) (10,850) 73,420 216,470 73,420 09/08/2004 to 08/08/201310/08/2004 S$0.74 1,723,958 (1,427,648) (55,300) 241,010 1,723,958 241,010 11/08/2005 to 10/08/201411/08/2005 S$2.11 4,213,877 (2,617,027) (93,100) 1,503,750 4,213,877 1,503,750 12/08/2006 to 11/08/201502/10/2006 S$2.38 191,750 (191,750) – – 191,750 – 03/10/2007 to 02/10/2011 *02/10/2006 S$2.38 4,918,409 (3,046,002) (15,925) 1,856,482 4,918,409 1,856,482 03/10/2007 to 02/10/201611,480,974 (7,467,337) (213,325) 3,800,312 11,480,974 3,800,312Share-based Incentive Plans (cont’d)b. Performance Share PlanUnder the Performance Share Plan (SCI PSP 2010), the awards granted conditional on performance targets are set based onmedium-term corporate objectives at the start of each rolling three-year performance qualifying period. A specific numberof performance shares shall be awarded at the end of the three-year performance cycle depending on the extent of theachievement of the performance conditions established at the onset.The performance levels were calibrated based on Wealth Added and Total Shareholder Return. A minimum thresholdperformance must be achieved to trigger an achievement factor, which in turn determines the number of shares to be finallyawarded. Performance shares to be delivered will range between 0% to 150% of the conditional performance shares awarded.To create alignment between senior management and other employees at the time of vesting, SCI PSP 2010 has in place aplan trigger. Under this trigger mechanism, the performance shares for the performance period 2012 to 2014 will be vestedto the senior management participants only if the restricted shares for the performance period 2013 to 2014 are vested,subject to the achievement of the performance conditions for the respective performance periods.Senior management participants are required to hold a minimum percentage of the shares released to them under thePerformance Share Plan to maintain a beneficial ownership stake in the Group, for the duration of their employment or tenurewith the Group. A maximum cap is set based on a multiple of the individual participant’s annual base salary. Any excess can besold off, but in the event of a shortfall, they have a two calendar year period to meet the minimum percentage requirement.i. <strong>Sembcorp</strong> Industries Ltd Performance SharesThe details of the movement of the performance shares of <strong>Sembcorp</strong> Industries Ltd awarded during the financial yearsince commencement of the Performance Share Plan (aggregate) are as follows:Movements during the yearAdditionalperformanceConditional shares awarded Conditional Conditionalperformance arising from performance performancePerformance shares participants At Jan 1 shares awarded targets met shares released shares lapsed At Dec 312012Director of the Company:Tang Kin Fei 1,200,000 400,000 200,000 (600,000) – 1,200,000Key executivesof the Group 1,433,333 420,000 252,500 (757,500) – 1,348,3332,633,333 820,000 452,500 (1,357,500) – 2,548,3332011Director of the Company:Tang Kin Fei 1,200,000 400,000 – (300,000) (100,000) 1,200,000Key executivesof the Group 1,411,665 420,000 – (292,500) (105,832) 1,433,3332,611,665 820,000 – (592,500) (205,832) 2,633,333With the Committee’s approval on the achievement factor for the achievement of the performance targets for theperformance period 2009 to 2011 (2011: performance period 2008 to 2010), a total of 1,357,500 (2011: 592,500)performance shares were released via the issuance of treasury shares.* Applicable to non-executive directors of the Company only.142 Powering the Future <strong>Sembcorp</strong> Industries Annual Report 2012 143
Directors’ ReportDirectors’ ReportShare-based Incentive Plans (cont’d)b. Performance Share Plan (cont’d)i. <strong>Sembcorp</strong> Industries Ltd Performance Shares (cont’d)The total number of performance shares in awards granted conditionally and representing 100% of targets to beachieved, but not released as at end 2012, was 2,548,333 (2011: 2,633,333). Based on the multiplying factor, the actualrelease of the awards could range from zero to a maximum of 3,822,500 (2011: 3,950,000) performance shares.Share-based Incentive Plans (cont’d)c. Restricted Share PlanUnder the Restricted Share Plan (SCI RSP 2010), the awards granted conditional on performance targets are set based oncorporate objectives at the start of each rolling two-year performance qualifying period. The performance criteria for therestricted shares are calibrated based on Return on Total Assets (excluding <strong>Sembcorp</strong> Marine Ltd) and Group Profit fromOperations (excluding <strong>Sembcorp</strong> Marine Ltd) for awards granted in 2012.ii.Performance shares of a listed subsidiaryThe details of the movement of the performance shares of <strong>Sembcorp</strong> Marine Ltd awarded during the year are as follows:2012 2011At January 1 1,765,000 1,970,000Conditional performance shares awarded 675,000 585,000Conditional performance shares lapsed (93,610) (242,916)Additional performance shares awarded arising from targets met 240,694 385,000Conditional performance shares released (722,084) (932,084)At December 31 1,865,000 1,765,000No performance shares of <strong>Sembcorp</strong> Marine Ltd were awarded to the directors of the Company.With the <strong>Sembcorp</strong> Marine Ltd’s committee’s approval on the achievement factor for the achievement of the performancetargets for the performance period 2009 to 2011 (2011: performance period 2008 to 2010), a total of 722,084 (2011:932,084) performance shares were released via the issuance of treasury shares.In 2012, there were additional 240,694 (2011: 385,000) performance shares awarded for over-achievement of theperformance targets for the performance period 2009 to 2011 (2011: performance period 2008 to 2010).The total number of performance shares in awards granted conditionally and representing 100% of targets to beachieved, but not released as at December 31, 2012, was 1,865,000 (2011: 1,765,000). Based on the multiplying factor,the actual release of the awards could range from zero to a maximum of 2,797,500 (2011: 2,647,500) performanceshares.A minimum threshold performance must be achieved to trigger an achievement factor, which in turn determines the numberof shares to be finally awarded. Based on the criteria, restricted shares to be delivered will range from 0% to 150% of theconditional restricted shares awarded.The managerial participants of the Group will be awarded restricted shares under SCI RSP 2010, while the non-managerialparticipants of the Group will receive their awards in an equivalent cash value. This cash-settled notional restricted sharesaward for non-managerial participants is known as the <strong>Sembcorp</strong> Challenge Bonus.A specific number of restricted shares shall be awarded at the end of the two-year performance cycle depending on theextent of the achievement of the performance conditions established at the onset. There is a further vesting period of threeyears after the performance period, during which one-third of the awarded shares are released each year to managerialparticipants. Non-managerial participants will receive the equivalent in cash at the end of the two-year performance cycle,with no further vesting conditions.Senior management participants are required to hold a minimum percentage of the shares released to them under theRestricted Share Plan to maintain a beneficial ownership stake in the Group, for the duration of their employment or tenurewith the Group. A maximum cap is set based on a multiple of the individual participant’s annual base salary. Any excess can besold off, but in the event of a shortfall, they have a two calendar year period to meet the minimum percentage requirement.To align the interests of the non-executive directors with the interests of shareholders, up to 30% of the aggregate directors’fees approved by shareholders for a particular financial year may be paid out in the form of restricted share awards underthe SCI RSP 2010.From 2011, non-executive directors were not awarded any shares except as part of their directors’ fees (except for Mr TangKin Fei, who is the Group President & CEO, and who does not receive any directors’ fees). In 2012, the awards grantedconsisted of the grant of fully paid shares outright with no performance and vesting conditions attached, but with a sellingmoratorium. Non-executive directors are required to hold shares (including shares obtained by other means) worth at leastone-time the annual base retainer; any excess may be sold as desired. A non-executive director can dispose of all of his sharesone year after leaving the Board.The actual number of shares awarded to each non-executive director was determined by reference to the volume-weightedaverage price of a share on the SGX-ST over the 14 trading days immediately following the date of the Annual GeneralMeeting (AGM). The number of shares to be awarded was rounded down to the nearest hundred and any residual balancewas settled in cash.144 Powering the Future <strong>Sembcorp</strong> Industries Annual Report 2012 145
Directors’ ReportDirectors’ ReportShare-based Incentive Plans (cont’d)c. Restricted Share Plan (cont’d)i. <strong>Sembcorp</strong> Industries Ltd Restricted SharesThe details of the movement of the restricted shares of <strong>Sembcorp</strong> Industries Ltd awarded during the year are as follows:Movements during the yearAdditionalrestrictedConditional shares awarded Conditional Conditionalrestricted arising from restricted restrictedRestricted shares participants At Jan 1 shares awarded targets met shares released shares lapsed At Dec 312012Directors of the Company:Ang Kong Hua – 16,200 – (16,200) – –Tang Kin Fei 393,960 126,000 26,460 (142,380) – 404,040Goh Geok Ling 15,434 9,600 – (19,554) – 5,480Evert Henkes 7,886 12,500 – (17,586) – 2,800Bobby Chin Yoke Choong 8,800 10,300 – (14,700) – 4,400Margaret Lui – 9,700 – (9,700) – –Tan Sri Mohd Hassan Marican – 10,100 – (10,100) – –Tham Kui Seng – 3,300 – (3,300) – –Dr Teh Kok Peng – – – – – –Former directorsof the Company – 5,200 – (5,200) – –Other executivesof the Group 5,744,249 2,251,500 392,910 (1,948,635) (148,307) 6,291,7176,170,329 2,454,400 419,370 (2,187,355) (148,307) 6,708,4372011Directors of the Company:Ang Kong Hua 20,300 – – (20,300) – –Tang Kin Fei 362,181 126,000 25,200 (119,421) – 393,960Goh Geok Ling 39,378 – 2,740 (26,684) – 15,434Evert Henkes 20,121 – 1,400 (13,635) – 7,886Bobby Chin Yoke Choong 22,000 – 2,200 (15,400) – 8,800Margaret Lui – – – – – –Tan Sri Mohd Hassan Marican – – – – – –Tham Kui Seng – – – – – –Former directorsof the Company 88,242 – 6,140 (94,382) – –Other executivesof the Group 4,963,224 2,179,800 361,880 (1,492,987) (267,668) 5,744,2495,515,446 2,305,800 399,560 (1,782,809) (267,668) 6,170,329Share-based Incentive Plans (cont’d)c. Restricted Share Plan (cont’d)i. <strong>Sembcorp</strong> Industries Ltd Restricted Shares (cont’d)With the Committee’s approval on the achievement factor for the achievement of the performance targets for theperformance period 2010 to 2011, a total of 863,127 restricted shares were released in 2012. For awards in relationto the performance period 2009 to 2010, a total of 737,169 (2011: 872,309) were released in 2012. For awards inrelation to the performance period 2008 to 2009, a total of 495,035 (2011: 548,312) restricted shares were released in2012. For awards in relation to the performance period 2007 to 2008, a total of 398 (2011: 279,488) restricted shareswere released in 2012. In 2012, there were 76,900 (2011: 82,700) shares released to non-executive directors. In 2012,there were additional 14,726 shares released to employees upon retirement or death in service. Of the restricted sharesreleased, 14,726 (2011: 35,490) restricted shares were cash-settled. The remaining restricted shares were released viathe issuance of treasury shares.In 2012, additional 419,370 (2011: 399,560) restricted shares were awarded for the over-achievement of the performancetargets for the performance period 2010 to 2011 (2011: performance period 2009 to 2010).The total number of restricted shares outstanding, including award(s) achieved but not released, as at end 2012,was 6,708,437 (2011: 6,170,329). Of this, the total number of restricted shares in awards granted conditionallyand representing 100% of targets to be achieved, but not released was 4,565,100 (2011: 4,244,200). Based on themultiplying factor, the actual release of the conditional awards could range from zero to a maximum of 6,847,650 (2011:6,366,300) restricted shares.<strong>Sembcorp</strong> Challenge BonusWith the Committee’s approval on the achievement factor for the achievement of the performance targets for theperformance period 2010 to 2011 (2011: performance period 2009 to 2010), a total of S$3,458,548, equivalent to580,274 (2011: S$2,661,000, equivalent to 494,042) notional restricted shares, were paid. A total of 400,000 (2011:600,000) notional restricted shares of <strong>Sembcorp</strong> Industries Ltd’s shares were awarded in 2012 for the <strong>Sembcorp</strong>Challenge Bonus.The total number of notional restricted shares in awards for the <strong>Sembcorp</strong> Challenge Bonus granted conditionally andrepresenting 100% of targets to be achieved, but not released as at end 2012, was 1,000,000 (2011: 1,200,000). Basedon the multiplying factor, the number of notional restricted shares to be converted into the funding pool could rangefrom zero to a maximum of 1,500,000 (2011: 1,800,000).146 Powering the Future <strong>Sembcorp</strong> Industries Annual Report 2012 147
Directors’ ReportDirectors’ ReportShare-based Incentive Plans (cont’d)c. Restricted Share Plan (cont’d)ii. Restricted shares of a listed subsidiaryThe details of the movement of the restricted shares of <strong>Sembcorp</strong> Marine Ltd awarded during the year are as follows:Movements during the yearAdditionalconditionalrestrictedConditional shares awarded Conditional Conditionalrestricted arising from restricted restrictedRestricted shares participants At Jan 1 shares awarded targets met shares released shares lapsed At Dec 312012Directors of the Company:Tang Kin Fei 23,000 12,600 – (27,100) – 8,500Goh Geok Ling 40,000 17,000 – (42,500) – 14,500Tan Sri Mohd Hassan Marican – 1,800 – (1,800) – –Former directorof the Company 22,000 19,000 – (41,000) – –Other participants 10,065,285 2,814,300 1,466,001 (4,301,658) (523,398) 9,520,53010,150,285 2,864,700 1,466,001 (4,414,058) (523,398) 9,543,5302011Directors of the Company:Tang Kin Fei 48,690 – 8,500 (34,190) – 23,000Goh Geok Ling 84,846 – 14,500 (59,346) – 40,000Former directorof the Company 36,700 – 11,000 (25,700) – 22,000Other participants 11,210,067 3,085,800 1,607,205 (4,923,035) (914,752) 10,065,28511,380,303 3,085,800 1,641,205 (5,042,271) (914,752) 10,150,285Share-based Incentive Plans (cont’d)c. Restricted Share Plan (cont’d)ii. Restricted shares of a listed subsidiary (cont’d)With the <strong>Sembcorp</strong> Marine Ltd’s committee’s approval on the achievement factor for the achievement of the performancetargets for the performance period 2010 to 2011, a total of 1,709,403 restricted shares were released in 2012. Forawards in relation to the performance period 2009 to 2010, a total of 1,434,630 (2011: 1,888,581) restricted shareswere released in 2012. For awards in relation to the performance period 2008 to 2009, a total of 1,185,425 (2011:1,531,500) restricted shares were released. In 2011, 1,502,177 restricted shares were released for awards in relation to theperformance period 2007 to 2008; and 16,413 restricted shares were released for awards in relation to the performanceperiod 2006 to 2007. In 2012, there were 84,600 (2011: 103,600) restricted shares released to non-executive directors.The restricted shares were either released via the issuance of treasury shares or the issuance of new shares.In 2012, additional 1,466,001 (2011: 1,641,205) <strong>Sembcorp</strong> Marine Ltd’s restricted shares were awarded for the overachievementof the performance targets for the performance period 2010 to 2011 (2011: performance period 2009 to2010).The total number of <strong>Sembcorp</strong> Marine Ltd’s restricted shares outstanding, including awards achieved but not released,as at December 31, 2012, was 9,543,530 (2011: 10,150,285). Of this, the total number of restricted shares in awardsgranted conditionally and representing 100% of targets to be achieved, but not released was 5,688,200 (2011:6,242,400). Based on the multiplying factor, the actual release of the awards could range from zero to a maximum of8,532,300 (2011: 9,363,600) restricted shares.Challenge Bonus of a listed subsidiaryWith the <strong>Sembcorp</strong> Marine Ltd’s committee’s approval on the achievement factor for the achievement of the performancetargets for the performance period 2010 to 2011 (2011: performance period 2009 to 2010), a total of S$8,163,619(2011: S$7,336,725), equivalent to 1,533,650 (2011: 1,373,250) notional restricted shares, were paid.A total of 1,031,300 (2011: 1,122,200) notional restricted shares were awarded on May 21, 2012 (2011: July 15, 2011)for the <strong>Sembcorp</strong> Marine Challenge Bonus.The total number of notional restricted shares in awards for the <strong>Sembcorp</strong> Marine Challenge Bonus granted conditionallyand representing 100% of targets to be achieved, but not released as at December 31, 2012, was 1,974,400 (2011:2,167,200). Based on the multiplying factor, the number of notional restricted shares to be converted into the fundingpool could range from zero to a maximum of 2,961,600 (2011: 3,250,800).d. Maximum Number of Shares IssuableThe maximum number of performance shares and restricted shares which could be delivered, when aggregated with thenumber of new shares issued and issuable in respect of all options granted, is within the 15% limit of the share capital of theCompany on the day preceding the relevant date of the grant.148 Powering the Future <strong>Sembcorp</strong> Industries Annual Report 2012 149
Directors’ ReportStatement by DirectorsYear ended December 31, 2012Audit CommitteeThe members of the Audit Committee during the year and at the date of this report are:Bobby Chin Yoke Choong (Chairman)Tan Sri Mohd Hassan MaricanEvert HenkesThe Audit Committee held four meetings during the financial year. In performing its functions, the Audit Committee met withthe Company’s external and internal auditors to discuss the scope of their work, the results of their examination and evaluationof the Company’s internal accounting control system.The Audit Committee performed the functions specified in Section 201B of the Singapore Companies Act, Chapter 50, the ListingManual of the Singapore Exchange, and the Code of Corporate Governance.The Audit Committee also reviewed the following:In our opinion:a. the financial statements set out on pages 153 to 274 are drawn up so as to give a true and fair view of the state of affairs ofthe Group and of the Company as at December 31, 2012, and the results, changes in equity and cash flows of the Group forthe year ended on that date in accordance with the provisions of the Singapore Companies Act, Chapter 50 and SingaporeFinancial Reporting Standards; andb. at the date of this statement, there are reasonable grounds to believe that the Company will be able to pay its debts as andwhen they fall due.The Board of Directors has, on the date of this statement, authorised these financial statements for issue.On behalf of the Board of Directors• assistance provided by the Company’s officers to the external and internal auditors;• quarterly financial information and annual financial statements of the Group and the Company prior to their submission tothe directors of the Company for adoption; and• interested person transactions (as defined in Chapter 9 of the Listing Manual of the Singapore Exchange).The Audit Committee has full access to the management and is given the resources required for it to discharge its functions. Ithas full authority and the discretion to invite any director or executive officer to attend its meetings. The Audit Committee alsorecommends the appointment of the external auditors and reviews the level of audit and non-audit fees.The Audit Committee is satisfied with the independence and objectivity of the external auditors and has recommended to theBoard of Directors that the auditors, KPMG LLP, be nominated for re-appointment as auditors at the forthcoming Annual GeneralMeeting of the Company.In appointing our auditors for the Company, subsidiaries and significant associated companies, we have complied with Rules 712and 715 of the SGX Listing Manual.Ang Kong HuaChairmanSingaporeFebruary 26, 2013Tang Kin FeiDirectorThe auditors, KPMG LLP, have indicated their willingness to accept re-appointment.On behalf of the Board of DirectorsAng Kong HuaChairmanTang Kin FeiDirectorSingaporeFebruary 26, 2013150 Powering the Future <strong>Sembcorp</strong> Industries Annual Report 2012 151
Independent Auditors’ ReportYear ended December 31, 2012Balance SheetsAs at December 31, 2012Independent Auditors’ ReportMembers of the Company<strong>Sembcorp</strong> Industries LtdReport on the financial statementsWe have audited the accompanying financial statements of <strong>Sembcorp</strong> Industries Ltd (the “Company”) and its subsidiaries (the“Group”), which comprise the balance sheets of the Group and the Company as at December 31, 2012, the income statement,statement of comprehensive income, statement of changes in equity and statement of cash flows of the Group for the year thenended, and a summary of significant accounting policies and other explanatory information, as set out on pages 153 to 274.Management’s responsibility for the financial statementsManagement is responsible for the preparation of financial statements that give a true and fair view in accordance with theprovisions of the Singapore Companies Act, Chapter 50 (the “Act”) and Singapore Financial Reporting Standards, and for devisingand maintaining a system of internal accounting controls sufficient to provide a reasonable assurance that assets are safeguardedagainst loss from unauthorised use or disposition; and transactions are properly authorised and that they are recorded as necessaryto permit the preparation of true and fair profit and loss accounts and balance sheets and to maintain accountability of assets.Auditors’ responsibilityOur responsibility is to express an opinion on these financial statements based on our audit. We conducted our audit in accordancewith Singapore Standards on Auditing. Those standards require that we comply with ethical requirements and plan and performthe audit to obtain reasonable assurance about whether the financial statements are free from material misstatement.An audit involves performing procedures to obtain audit evidence about the amounts and disclosures in the financial statements.The procedures selected depend on the auditor’s judgement, including the assessment of the risks of material misstatement ofthe financial statements, whether due to fraud or error. In making those risk assessments, the auditor considers internal controlrelevant to the entity’s preparation of the financial statements that give a true and fair view in order to design audit proceduresthat are appropriate in the circumstances, but not for the purpose of expressing an opinion on the effectiveness of the entity’sinternal control. An audit also includes evaluating the appropriateness of accounting policies used and the reasonableness ofaccounting estimates made by management, as well as evaluating the overall presentation of the financial statements.We believe that the audit evidence we have obtained is sufficient and appropriate to provide a basis for our audit opinion.OpinionIn our opinion, the consolidated financial statements of the Group and the balance sheet of the Company are properly drawn upin accordance with the provisions of the Act and Singapore Financial Reporting Standards to give a true and fair view of the stateof affairs of the Group and of the Company as at December 31, 2012, and the results, changes in equity and cash flows of theGroup for the year ended on that date.Report on other legal and regulatory requirementsIn our opinion, the accounting and other records required by the Act to be kept by the Company and by those subsidiariesincorporated in Singapore of which we are the auditors have been properly kept in accordance with the provisions of the Act.KPMG LLPPublic Accountants andCertified Public AccountantsSingaporeFebruary 26, 2013Group Company2012 2011 2012 2011Note S$’000 S$’000 S$’000 S$’000Non-current assetsProperty, plant and equipment 3 5,158,266 4,249,575 582,352 450,265Investment properties 4 21,684 23,007 – –Investments in subsidiaries 5 – – 1,708,551 1,561,239Interests in associates and joint ventures 6 1,505,609 1,344,700 – –Other financial assets 7 221,099 145,280 – –Long-term receivables and prepayments 8 405,219 380,464 7,420 7,730Intangible assets 12 321,276 331,883 20,008 19,515Deferred tax assets 13 56,955 60,655 – –7,690,108 6,535,564 2,318,331 2,038,749Current assetsInventories and work-in-progress 14 1,886,546 1,078,269 9,789 9,101Trade and other receivables 15 1,175,501 1,090,259 130,658 100,864Tax recoverable 6,954 12,073 – –Assets held for sale 17 24,437 24,437 – –Other financial assets 7 41,509 16,545 – –Cash and cash equivalents 18 2,059,800 2,995,478 524,601 629,0745,194,747 5,217,061 665,048 739,039Current liabilitiesTrade and other payables 19 2,832,524 2,746,273 572,195 179,883Excess of progress billings over work-in-progress 14 886,042 355,300 – –Provisions 20 83,078 117,522 14,093 20,766Other financial liabilities 23 16,261 22,509 177 –Current tax payable 233,100 269,822 40,893 17,178Interest-bearing borrowings 25 115,061 186,073 100 944,166,066 3,697,499 627,458 217,921Net current assets 1,028,681 1,519,562 37,590 521,1188,718,789 8,055,126 2,355,921 2,559,867Non-current liabilitiesDeferred tax liabilities 13 410,796 387,651 40,061 40,349Provisions 20 50,696 37,087 593 593Other financial liabilities 23 161,445 187,325 – –Retirement benefit obligations 24 11,454 17,740 – –Interest-bearing borrowings 25 2,204,785 1,856,365 54 156Other long-term liabilities 26 235,186 328,298 319,931 653,9623,074,362 2,814,466 360,639 695,0605,644,427 5,240,660 1,995,282 1,864,807Equity attributable to owners of the Company:Share capital 27 565,572 565,572 565,572 565,572Other reserves 28 (102,322) (46,322) (6,048) (9,884)Revenue reserve 4,040,081 3,595,266 1,435,758 1,309,1194,503,331 4,114,516 1,995,282 1,864,807Non-controlling interests 1,141,096 1,126,144 – –Total equity 5,644,427 5,240,660 1,995,282 1,864,807The accompanying notes form an integral part of these financial statements.152 Powering the Future <strong>Sembcorp</strong> Industries Annual Report 2012 153
Consolidated Income StatementYear ended December 31, 2012Consolidated Statement of Comprehensive IncomeYear ended December 31, 2012Group2012 2011Note S$’000 S$’000Turnover 30 10,189,058 9,047,066Cost of sales (8,808,796) (7,692,621)Gross profit 1,380,262 1,354,445General and administrative expenses (320,380) (288,641)Other income 58,849 47,492Other expense (net) (15,781) (12,190)Finance income 31 28,552 64,568Finance costs 31 (139,997) (65,668)Share of results of associates and joint ventures, net of tax 163,251 170,573Profit before tax 1,154,756 1,270,579Tax expense 32 (121,698) (124,769)Profit for the year 33 1,033,058 1,145,810Profit attributable to:Owners of the Company 753,283 809,282Non-controlling interests 279,775 336,528Profit for the year 1,033,058 1,145,810Group2012 2011Note S$’000 S$’000Profit for the year 1,033,058 1,145,810Foreign currency translation differences for foreign operations (131,501) 13,192Exchange differences on monetary items forming part ofnet investment in foreign operation (506) (223)Net change in fair value of cash flow hedges 35,831 (114,261)Net change in fair value of cash flow hedges transferred to profit or loss (7,146) (27,451)Net change in fair value of available-for-sale financial assets 22,120 (132,220)Share of other comprehensive income of associates and joint ventures 662 (5,869)Other comprehensive income for the year, net of tax 29 (80,540) (266,832)Total comprehensive income for the year 952,518 878,978Total comprehensive income attributable to:Owners of the Company 680,724 644,457Non-controlling interests 271,794 234,521Total comprehensive income for the year 952,518 878,978Earnings per share (cents): 34Basic 42.17 45.32Diluted 41.84 44.98The accompanying notes form an integral part of these financial statements.The accompanying notes form an integral part of these financial statements.154 Powering the Future <strong>Sembcorp</strong> Industries Annual Report 2012 155
Consolidated Statement of Changes in EquityYear ended December 31, 2012Consolidated Statement of Changes in EquityAttributable to owners of the CompanyReserve Currency Share-basedShare for own translation Capital Merger payments Fair value Hedging Revenue Non-controlling Totalcapital shares reserve reserve reserve reserve reserve reserve reserve Total interests equityGroup S$’000 S$’000 S$’000 S$’000 S$’000 S$’000 S$’000 S$’000 S$’000 S$’000 S$’000 S$’000At January 1, 2012 565,572 (18,455) (229,340) 334,585 29,201 (3,088) 15,894 (175,119) 3,595,266 4,114,516 1,126,144 5,240,660Total comprehensive income for the yearProfit for the year – – – – – – – – 753,283 753,283 279,775 1,033,058Other comprehensive incomeForeign currency translation differencesfor foreign operations – – (107,094) – – – – – – (107,094) (24,407) (131,501)Exchange differences on monetary items formingpart of net investment in foreign operation – – (506) – – – – – – (506) – (506)Net change in fair value of cash flow hedges – – – – – – – 19,907 – 19,907 15,924 35,831Net change in fair value of cash flow hedgestransferred to profit or loss – – – – – – – (3,173) – (3,173) (3,973) (7,146)Net change in fair value ofavailable-for-sale financial assets – – – – – – 17,645 – – 17,645 4,475 22,120Share of other comprehensive incomeof associates and joint ventures – – (1) – – – 11 652 – 662 – 662Total other comprehensive income for the year – – (107,601) – – – 17,656 17,386 – (72,559) (7,981) (80,540)Total comprehensive income for the year – – (107,601) – – – 17,656 17,386 753,283 680,724 271,794 952,518The accompanying notes form an integral part of these financial statements.156 Powering the Future <strong>Sembcorp</strong> Industries Annual Report 2012 157
Consolidated Statement of Changes in EquityConsolidated Statement of Changes in EquityAttributable to owners of the CompanyReserve Currency Share-basedShare for own translation Capital Merger payments Fair value Hedging Revenue Non-controlling Totalcapital shares reserve reserve reserve reserve reserve reserve reserve Total interests equityGroup S$’000 S$’000 S$’000 S$’000 S$’000 S$’000 S$’000 S$’000 S$’000 S$’000 S$’000 S$’000Transactions with owners of the Company,recognised directly in equityContributions by and distributionsto owners of the CompanyContribution by non-controlling interests – – – – – – – – – – 1,479 1,479Share-based payments – – – – – 22,842 – – – 22,842 6,904 29,746Purchase of treasury shares – (10,184) – – – – – – – (10,184) – (10,184)Issue of treasury shares under Share Option Plan – 3,820 – – – – – – – 3,820 – 3,820Issue of treasury shares under Performance Share Plan – 6,404 – – – – – – – 6,404 – 6,404Issue of treasury shares under Restricted Share Plan – 10,252 – – – – – – – 10,252 – 10,252Treasury shares transferred to employees – – – – – (18,993) – – – (18,993) – (18,993)Treasury shares of a subsidiary – – – 4,444 – (6,506) – – – (2,062) (1,341) (3,403)Realisation of reserve upon disposal of investmentsand changes in group structure – – 5,221 (2) – (49) – – (4,827) 343 251 594Final one-tier tax exempt dividend paid of15.0 cents per share in respect of year 2011 – – – – – – – – (268,109) (268,109) – (268,109)Final bonus one-tier tax exempt dividend paid of2.0 cents per share in respect of year 2011 – – – – – – – – (35,748) (35,748) – (35,748)Dividend paid to non-controlling interests – – – – – – – – – – (241,669) (241,669)Unclaimed dividends – – – – – – – – 216 216 – 216Total contributions by and distributions toowners of the Company – 10,292 5,221 4,442 – (2,706) – – (308,468) (291,219) (234,376) (525,595)Changes in ownership interests in subsidiariesAcquisition of non-controlling interestswithout a change in control – – – (690) – – – – – (690) (22,466) (23,156)Total changes in ownership interests in subsidiaries – – – (690) – – – – – (690) (22,466) (23,156)Total transactions with owners – 10,292 5,221 3,752 – (2,706) – – (308,468) (291,909) (256,842) (548,751)At December 31, 2012 565,572 (8,163) (331,720) 338,337 29,201 (5,794) 33,550 (157,733) 4,040,081 4,503,331 1,141,096 5,644,427The accompanying notes form an integral part of these financial statements.158 Powering the Future <strong>Sembcorp</strong> Industries Annual Report 2012 159
Consolidated Statement of Changes in EquityConsolidated Statement of Changes in EquityAttributable to owners of the CompanyReserve Currency Share-basedShare for own translation Capital Merger payments Fair value Hedging Revenue Non-controlling Totalcapital shares reserve reserve reserve reserve reserve reserve reserve Total interests equityGroup S$’000 S$’000 S$’000 S$’000 S$’000 S$’000 S$’000 S$’000 S$’000 S$’000 S$’000 S$’000At January 1, 2011 571,099 (5,668) (230,754) 338,152 29,201 12,753 96,216 (83,312) 3,087,523 3,815,210 1,205,050 5,020,260Total comprehensive income for the yearProfit for the year – – – – – – – – 809,282 809,282 336,528 1,145,810Other comprehensive incomeForeign currency translation differencesfor foreign operations – – 7,536 – – – – – – 7,536 5,656 13,192Exchange differences on monetary items formingpart of net investment in foreign operation – – (223) – – – – – – (223) – (223)Net change in fair value of cash flow hedges – – – – – – – (58,836) – (58,836) (55,425) (114,261)Net change in fair value of cash flow hedgestransferred to profit or loss – – – – – – – (27,112) – (27,112) (339) (27,451)Net change in fair value ofavailable-for-sale financial assets – – – – – – (80,331) – – (80,331) (51,889) (132,220)Share of other comprehensive incomeof associates and joint ventures – – – – – – – (5,859) – (5,859) (10) (5,869)Total other comprehensive income for the year – – 7,313 – – – (80,331) (91,807) – (164,825) (102,007) (266,832)Total comprehensive income for the year – – 7,313 – – – (80,331) (91,807) 809,282 644,457 234,521 878,978Transactions with owners of the Company,recognised directly in equityContributions by and distributionsto owners of the CompanyCancellation of shares (5,527) 5,527 – – – – – – – – – –Contribution by non-controlling interests – – – – – – – – – – 14,537 14,537Share-based payments – – – – – 19,564 – – – 19,564 6,995 26,559Purchase of treasury shares – (37,771) – – – – – – – (37,771) – (37,771)Issue of treasury shares under Share Option Plan – 7,942 – – – – – – – 7,942 – 7,942Issue of treasury shares under Performance Share Plan – 2,913 – – – – – – – 2,913 – 2,913Issue of treasury shares under Restricted Share Plan – 8,602 – – – – – – – 8,602 – 8,602Treasury shares transferred to employees – – – – – (15,976) – – – (15,976) – (15,976)Treasury shares of a subsidiary – – – (6,413) – (19,443) – – – (25,856) (16,701) (42,557)Realisation of reserve upon disposal of investmentsand changes in group structure – – (5,899) 2,846 – 14 9 – 2,490 (540) 496 (44)Final one-tier tax exempt dividend paid of15.0 cents per share in respect of year 2010 – – – – – – – – (268,261) (268,261) – (268,261)Final bonus one-tier tax exempt dividend paid of2.0 cents per share in respect of year 2010 – – – – – – – – (35,768) (35,768) – (35,768)Dividend paid to non-controlling interests – – – – – – – – – – (318,754) (318,754)Total contributions by and distributions toowners of the Company (5,527) (12,787) (5,899) (3,567) – (15,841) 9 – (301,539) (345,151) (313,427) (658,578)At December 31, 2011 565,572 (18,455) (229,340) 334,585 29,201 (3,088) 15,894 (175,119) 3,595,266 4,114,516 1,126,144 5,240,660The accompanying notes form an integral part of these financial statements.160 Powering the Future <strong>Sembcorp</strong> Industries Annual Report 2012 161
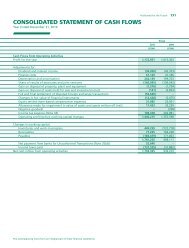
Consolidated Statement of Cash FlowsYear ended December 31, 2012Consolidated Statement of Cash FlowsGroup2012 2011Cash flows from operating activitiesProfit for the year 1,033,058 1,145,810Adjustments for:Dividend and interest income (32,175) (69,218)Finance costs 139,997 65,668Depreciation and amortisation 281,620 234,816Share of results of associates and joint ventures (163,251) (170,573)Gain on disposal of property, plant and equipment (329) (980)Gain on disposal of intangible assets (82) –Gain on disposal of investment properties (7,858) (822)Gain on disposal of investments and assets held for sale (180) (455)Changes in fair value of financial instruments (1,149) 7,280Equity settled share-based compensation expenses 29,746 26,559Allowance made for impairment in value of assets and assets written off (net) 17,767 17,922Tax expense (Note 32) 121,698 124,769Operating profit before working capital changes 1,418,862 1,380,776Changes in working capital:Inventories and work-in-progress (275,633) (471,233)Receivables (143,869) (364,748)Payables (250,768) 453,216748,592 998,011Tax paid (128,158) (84,605)Net cash from operating activities 620,434 913,406Cash flows from investing activitiesDividends and interest received 93,117 140,392Proceeds from disposal of interests in subsidiaries 480 (2,428)Proceeds from sale of investments 713 1,685Proceeds from sale of property, plant and equipment 937 3,621Proceeds from sale of investment properties 7,858 850Proceeds from sale of intangible assets 510 –Proceeds from sale of assets held for sale – 759Acquisition of non-controlling interests (23,156) –Acquisition of / additional investments in associates and joint ventures (133,006) (197,566)Acquisition of other financial assets (47,430) –Purchase of property, plant and equipment (Note (a)) (1,119,777) (990,022)Payment for intangible assets (10,098) (38,578)Net cash used in investing activities (1,229,852) (1,081,287)S$’000S$’000Group2012 2011S$’000S$’000Cash flows from financing activitiesProceeds from share issue to non-controlling interests of subsidiaries 1,479 14,537Proceeds from share options exercised with issue of treasury shares 1,483 3,481Proceeds from share options exercised with issue of treasury shares of a subsidiary 1,926 496Purchase of treasury shares (10,184) (37,771)Purchase of treasury shares by a subsidiary (5,329) (43,053)Proceeds from borrowings 842,929 476,715Repayment of borrowings (522,926) (50,556)Payment on finance leases (2,577) (2,785)Increase / (decrease) in other long-term liabilities 33,389 (31)Dividends paid to owners of the Company (303,857) (304,029)Dividends paid to non-controlling interests of subsidiaries (241,669) (318,754)Unclaimed dividends 216 –Interest paid (104,511) (61,706)Net cash used in financing activities (309,631) (323,456)Net decrease in cash and cash equivalents (919,049) (491,337)Cash and cash equivalents at beginning of the year 2,995,478 3,487,876Effect of exchange rate changes on balances held in foreign currency (16,629) (1,061)Cash and cash equivalents at end of the year (Note 18) 2,059,800 2,995,478a. During the year, the Group acquired property, plant and equipment with an aggregate cost of S$1,305,832,000 (2011:S$1,053,314,000) of which S$15,469,000 (2011: S$851,000) was acquired by means of finance lease, S$155,891,000(2011: S$61,604,000) relates to other accrued capital expenditure (Note 22) and S$14,695,000 (2011: S$837,000) relates toprovision for restoration costs (Note 20).The accompanying notes form an integral part of these financial statements.The accompanying notes form an integral part of these financial statements.162 Powering the Future <strong>Sembcorp</strong> Industries Annual Report 2012 163
Notes to the Financial StatementsYear ended December 31, 2012Notes to the Financial StatementsThese notes form an integral part of the financial statements.The financial statements were authorised for issue by the Board of Directors on February 26, 2013.1. Domicile and Activities<strong>Sembcorp</strong> Industries Ltd (the “Company”) is a company incorporated in the Republic of Singapore and has its registeredoffice at 30 Hill Street #05-04, Singapore 179360.The financial statements comprise the Company and its subsidiaries (together referred to as the “Group” and individually as“Group entities”) and the Group’s interests in associates and joint ventures.The principal activities of the Company include:a. investment holding, as well as the corporate headquarter which gives strategic direction and provides managementservices to its subsidiaries; andb. production and supply of utilities services, terminalling and storage of petroleum products and chemicals.The principal activities of key subsidiaries are as follows:i. UtilitiesThis business focuses on the provision of energy, water and on-site logistics and solid waste management. Key activitiesin the energy sector include power generation and retail, process steam production and supply, as well as natural gasimport, supply and retail. In the water sector, the business offers wastewater treatment as well as the production andsupply of reclaimed, desalinated and potable water and water for industrial use;ii.MarineThis business focuses principally on repair, building and conversion of ships and rigs, and on offshore engineering;iii. Urban DevelopmentThis business owns, develops, markets and manages integrated industrial parks and townships in Asia; andiv. Others / CorporateThis business mainly relates to minting, design and construction activities, offshore engineering and the corporatecompanies.2. Summary of Significant Accounting Policiesa. Basis of PreparationThe financial statements are prepared in accordance with Singapore Financial Reporting Standards (FRS).The financial statements are presented in Singapore dollar which is the Company’s functional currency. All financial informationpresented in Singapore dollar have been rounded to the nearest thousand (S$’000), unless otherwise indicated. The financialstatements have been prepared on the historical cost basis except as otherwise described in the accounting policies below.The preparation of the financial statements in conformity with FRS requires management to make judgements, estimatesand assumptions that affect the application of accounting policies and the reported amounts of assets, liabilities, income andexpenses. Actual results may differ from these estimates.2. Summary of Significant Accounting Policies (cont’d)a. Basis of Preparation (cont’d)Information about significant areas of estimation uncertainty and critical judgements in applying accounting policies thathave the most significant effect on the amounts recognised in the financial statements is discussed in Note 44.With effect from January 1, 2012, the Group adopted the new or revised FRS that are mandatory for application fromthat date. The adoption of these new or revised FRS does not have any significant impact on the financial statements.The accounting policies set out below have been applied consistently to all periods presented in these financial statements,and have been applied consistently by Group entities.b. Consolidationi. Business CombinationsAcquisitions on or after January 1, 2010Business combinations are accounted for using the acquisition method as at the acquisition date, which is the dateon which control is transferred to the Group. Control is the power to govern the financial and operating policies ofan entity so as to obtain benefits from its activities. In assessing control, the Group takes into consideration potentialvoting rights that are currently exercisable.The consideration transferred does not include amounts related to the settlement of pre-existing relationships. Suchamounts are generally recognised in profit or loss.Costs related to the acquisition, other than those associated with the issue of debt or equity securities, that theGroup incurs in connection with a business combination are expensed as incurred.Any contingent consideration payable is recognised at fair value at the acquisition date. If the contingentconsideration is classified as equity, it is not remeasured and settlement is accounted for within equity. Otherwise,subsequent changes to the fair value of the contingent consideration are recognised in profit or loss.For non-controlling interests that are present ownership interests and entitle their holders to a proportionate share ofthe acquiree’s net assets in the event of liquidation, the Group elects on a transaction-by-transaction basis whetherto measure them at fair value, or at the non-controlling interests’ proportionate share of the recognised amountsof the acquiree’s identifiable net assets, at the acquisition date. All other non-controlling interests are measured atacquisition-date fair value or, when applicable, on the basis specified in another standard.Acquisitions between January 1, 2004 and December 31, 2009For acquisitions between January 1, 2004 and December 31, 2009, business combinations are accounted for usingthe purchase method, upon the adoption of FRS 103. Under the purchase method, the cost of an acquisition ismeasured at the fair value of the assets given, equity instruments issued and liabilities incurred or assumed at thedate of exchange, plus costs directly attributable to the acquisition. The excess of the Group’s interest in the net fairvalue of the identifiable assets, liabilities and contingent liabilities over the cost of acquisition is credited to profit orloss in the period of the acquisition.Acquisitions prior to January 1, 2004Prior to January 1, 2004, business combinations were accounted for either by the purchase method, or if they werebetween entities under common control, by the historical cost method similar to the pooling-of-interest method.Estimates and underlying assumptions are reviewed on an ongoing basis. Revisions to accounting estimates are recognised inthe period in which the estimates are revised and in any future periods affected.164 Powering the Future <strong>Sembcorp</strong> Industries Annual Report 2012 165
Notes to the Financial StatementsNotes to the Financial Statements2. Summary of Significant Accounting Policies (cont’d)b. Consolidation (cont’d)ii. Acquisition of Non-controlling InterestsAcquisitions of non-controlling interests are accounted for as transactions with owners in their capacity as ownersand therefore no goodwill is recognised as a result of such transactions. Adjustments to non-controlling interestsarising from transactions that do not involve the loss of control are based on a proportionate amount of the netassets of the subsidiary.Prior to January 1, 2010, goodwill was recognised on the acquisition of non-controlling interests in a subsidiary,which represented the excess of the cost of the additional investment over the carrying amount of the interest in thenet assets acquired at the date of the transaction.iii. SubsidiariesSubsidiaries are those entities that are controlled by the Group.The financial statements of subsidiaries are included in the consolidated financial statements from the date thatcontrol commences until the date control ceases. The accounting policies of subsidiaries have been changed whennecessary to align them with the policies adopted by the Group.Non-controlling interests are that part of the net results of operations and of net assets of a subsidiary attributableto the interests which are not owned directly or indirectly by the equity holders of the Company. They are shownseparately in the consolidated statement of comprehensive income, statement of changes in equity and balancesheet. Total comprehensive income is attributed to the non-controlling interests based on their respective interests ina subsidiary even if this results in the non-controlling interests having a deficit balance.iv. Acquisitions from Entities under Common ControlBusiness combinations that involve entities under common control are excluded from the scope of FRS 103.Such combinations are accounted at historical cost in a manner similar to the pooling-of-interest method, in thepreparation of the consolidated financial statements. Under this method of accounting, the difference between thevalue of the share capital issued and the value of shares received is taken to the merger reserve.v. Loss of ControlUpon the loss of control, the Group derecognises the assets and liabilities of the subsidiary, any non-controllinginterests and the other components of equity related to the subsidiary. Any surplus or deficit arising on the loss ofcontrol is recognised in profit or loss. If the Group retains any interest in the previous subsidiary, then such interestis measured at fair value at the date that control is lost. Subsequently, it is accounted for as an equity-accountedinvestee or as an available-for-sale financial asset depending on the level of influence retained.vi. AssociatesAssociates are those entities in which the Group has significant influence, but not control, over the financial andoperating policies.2. Summary of Significant Accounting Policies (cont’d)b. Consolidation (cont’d)vi. Associates (cont’d)Associates are accounted for using the equity method of accounting from the date that significant influencecommences until the date that significant influence ceases and are recognised initially at cost. The cost of investmentsincludes transaction costs. When the Group’s share of losses exceeds the carrying amount of the associate (includingany other unsecured receivables, that in substance, form part of the Group’s net investment in the associate),recognition of further losses is discontinued unless the Group has incurred obligations or made payments on itsbehalf to satisfy obligations of the associate that the Group has guaranteed or otherwise committed on behalf of.The excess of the Group’s interest in the net fair value of the identifiable assets, liabilities and contingent liabilitiesover the cost of acquisition is credited to profit or loss in the period of the acquisition. Where the audited financialstatements are not available, the share of results is arrived at from unaudited management financial statementsmade up mainly to the end of the accounting year to December 31.vii. Joint VenturesJoint ventures are those entities over whose activities the Group has joint control, established by contractualagreement and requiring unanimous consent for strategic, financial and operating decisions.The existence and effect of potential voting rights that are presently exercisable or presently convertible areconsidered when assessing whether the Group has joint control over the entity.Joint ventures are accounted for using the equity method of accounting from the date that joint control commencesuntil the date that joint control ceases.The excess of the Group’s interest in the net fair value of the identifiable assets, liabilities and contingent liabilitiesover the cost of acquisition is credited to profit or loss in the period of the acquisition. Where the audited financialstatements are not available, the share of results is arrived at from unaudited management financial statementsmade up mainly to the end of the accounting year to December 31.viii. Transactions Eliminated on ConsolidationAll intra-group balances, transactions, and unrealised income and expenses arising from intra-group transactions,are eliminated in preparing the consolidated financial statements. Unrealised gains arising from transactions withassociates and joint ventures are eliminated against the investment to the extent of the Group’s interest in theinvestee. Unrealised losses are eliminated in the same way as unrealised gains, but only to the extent that there isno evidence of impairment.ix. Accounting for Subsidiaries, Associates and Joint VenturesInvestments in subsidiaries, associates and joint ventures are measured in the Company’s balance sheet at cost lessaccumulated impairment losses.The existence and effect of potential voting rights that are presently exercisable or presently convertible areconsidered when assessing whether the Group has significant influence over another entity. Significant influence ispresumed to exist when the Group holds between 20% and 50% of the voting power of another entity.166 Powering the Future <strong>Sembcorp</strong> Industries Annual Report 2012 167
Notes to the Financial StatementsNotes to the Financial Statements2. Summary of Significant Accounting Policies (cont’d)c. Foreign Currenciesi. Foreign Currency Transactions and BalancesTransactions in foreign currencies are translated into the respective functional currencies of Group entities at foreignexchange rates at the dates of the transactions. At each reporting date:• Foreign currency monetary assets and liabilities are translated into the functional currency using foreignexchange rates ruling at that date.2. Summary of Significant Accounting Policies (cont’d)c. Foreign Currencies (cont’d)ii. Foreign Operations (cont’d)Goodwill (except those relating to acquisitions of foreign operations prior to January 1, 2004) and fair valueadjustments arising from the acquisition of foreign operations are translated to the presentation currency forconsolidation at the rates of exchange ruling at the balance sheet date. Goodwill arising from the acquisitionof foreign operations prior to January 1, 2004 are translated at foreign exchange rates ruling at the dates of thetransactions.ii.• Non-monetary assets and liabilities measured at historical cost in foreign currencies are translated into thefunctional currency using foreign exchange rates at the dates of the transactions.• Non-monetary assets and liabilities measured at fair value in foreign currencies are translated into the functionalcurrency at foreign exchange rates ruling at the dates the fair value was determined.Foreign exchange differences arising from the settlement or from translation of monetary items are recognised inprofit or loss.Foreign exchange differences arising from non-monetary items are recognised directly in other comprehensive incomewhen non-monetary items’ gains or losses are recognised directly in other comprehensive income. Conversely, whennon-monetary items’ gains or losses are recognised directly in profit or loss, foreign exchange differences arising onretranslation are recognised directly in profit or loss, except for the following differences which are recognised inother comprehensive income arising on the retranslation of:• available-for-sale equity instruments (except on impairment in which case foreign currency differences that havebeen recognised in other comprehensive income are reclassified to profit or loss);• a financial liability designated as a hedge of the net investment in a foreign operation to the extent that thehedge is effective; or• qualifying cash flow hedges to the extent the hedge is effective.Foreign OperationsThe results and financial positions of foreign operations (none of which has the currency of a hyperinflationaryeconomy) that have a functional currency different from the presentation currency are translated into thepresentation currency as follows:• Assets and liabilities are translated at foreign exchange rates ruling at the date of the balance sheet.• Revenues and expenses are translated at average foreign exchange rates.• All resulting foreign exchange differences are taken to the foreign currency translation reserve in othercomprehensive income.Foreign currency differences are recognised in other comprehensive income, and presented in the foreign currencytranslation reserve (translation reserve) in equity. However, if the foreign operation is a non-wholly-owned subsidiary,then the relevant proportionate share of the translation difference is allocated to the non-controlling interests. Whena foreign operation is disposed of such that control, significant influence or joint control is lost, the cumulativeamount in the translation reserve related to that foreign operation is reclassified to profit or loss as part of the gain orloss on disposal. When the Group disposes of only part of its interest in a subsidiary that includes a foreign operationwhile retaining control, the relevant proportion of the cumulative amount is reattributed to non-controlling interests.When the Group disposes of only part of its investment in an associate or joint venture that includes a foreignoperation while retaining significant influence or joint control, the relevant proportion of the cumulative amount isreclassified to profit or loss.iii. Net Investment in a Foreign OperationExchange differences arising from monetary items that in substance form part of the Company’s net investment ina foreign operation are recognised in the Company’s profit or loss. Such exchange differences are reclassified to theforeign currency translation reserve in the consolidated statement of comprehensive income and are released to theconsolidated income statement upon disposal of the investment as part of the gain or loss on disposal.d. Property, Plant and Equipmenti. Owned AssetsProperty, plant and equipment are measured at cost less accumulated depreciation and accumulated impairmentlosses. Cost includes expenditure that is directly attributable to the acquisition of the asset.ii.The cost of self-constructed asset includes the cost of materials, direct labour and any other costs directly attributableto bringing the assets to a working condition for their intended use, the costs of dismantling and removing the itemsand restoring the site on which they are located and capitalised borrowing costs.Where an item of property, plant and equipment comprises major components having different useful lives, they areaccounted for as separate items of property, plant and equipment.Subsequent ExpenditureSubsequent expenditure relating to property, plant and equipment that has already been recognised is added to thecarrying amount of the asset when it is probable that future economic benefits, in excess of the originally assessedstandard of performance of the existing asset, will flow to the Group. All other subsequent expenditure is recognisedas an expense in the period in which it is incurred.Certain items of property, plant and equipment are subject to overhauls at regular intervals. The inherent componentsof the initial overhaul are determined based on the costs of the next overhaul and are separately depreciated inorder to reflect the estimated intervals between two overhauls. The costs of the overhauls subsequently incurredare capitalised as additions and the carrying amounts of the replaced components are written off to profit or loss.168 Powering the Future <strong>Sembcorp</strong> Industries Annual Report 2012 169
Notes to the Financial StatementsNotes to the Financial Statements2. Summary of Significant Accounting Policies (cont’d)d. Property, Plant and Equipment (cont’d)iii. DisposalsGains or losses arising from the retirement or disposal of property, plant and equipment are determined as thedifference between the net disposal proceeds and the carrying amount of the asset and are recognised in profit orloss on the date of retirement or disposal.iv. Finance Lease AssetsFinance leases are those leasing agreements with terms of which the Group assumes substantially all the risks andrewards of ownership. Property, plant and equipment acquired by way of such leases is capitalised at the lower ofits fair value and the present value of the minimum lease payments at the inception of the lease, less accumulateddepreciation and impairment losses.Lease payments are apportioned between the finance charges and reduction of the lease liability so as to achieve aconstant rate of interest on the remaining balance of the liability.Finance charges are charged directly to profit or loss.Capitalised leased assets are depreciated over the shorter of the economic useful life of the asset and the lease term.v. Provision for Restoration CostsA provision is recognised for the costs expected to be incurred to dismantle, remove and restore the asset uponexpiry of the lease agreement. The estimated costs form part of the cost of the property, plant and equipment andare depreciated over the useful life of the asset.vi. DepreciationDepreciation is calculated using the straight-line method to allocate the cost less its residual value so as to write offitems of property, plant and equipment over their estimated useful lives. Each part of an item of property, plant andequipment with a cost that is significant in relation to the total cost of an item is depreciated separately. Depreciationis recognised from the date that the property, plant and equipment are installed and are ready for use, or in respectof internally constructed assets, from the date that the asset is completed and ready for use.2. Summary of Significant Accounting Policies (cont’d)e. Investment PropertiesInvestment properties are properties held for long-term rental yields or for capital appreciation, or both.Investment properties are initially recognised at cost and subsequently carried at cost less accumulated depreciation andaccumulated impairment losses. Depreciation is recognised in profit or loss on a straight-line basis over the estimateduseful lives ranging from 20 to 50 years. The assets’ depreciation methods, useful lives and residual values are reviewed,if not insignificant, annually, and adjusted if appropriate. No depreciation is provided on the freehold land.Investment properties are subject to renovations or improvements at regular intervals. The cost of major renovations andimprovements is capitalised as additions and the carrying amounts of the replaced components are written off to profitor loss. The cost of maintenance, repairs and minor improvements is charged to profit or loss when incurred.On disposal of an investment property, the difference between the net disposal proceeds and the carrying amount of theasset is recognised in profit or loss.f. Intangible Assetsi. GoodwillGoodwill represents the excess of:• the fair value of the consideration transferred; plus• the recognised amount of any non-controlling interests in the acquiree;• plus if the business combination is achieved in stages, the fair value of the pre-existing equity interest in theacquiree, less the net amount recognised (generally fair value) of the identifiable assets acquired and liabilitiesassumed.When the excess is negative, a bargain purchase gain is recognised immediately in profit or loss.Goodwill is measured at cost less accumulated impairment losses.The estimated useful lives for the current and comparative years are as follows:Leasehold land and wet berthageBuildingsImprovements to premisesQuays and dry docksInfrastructurePlant and machineryMarine vesselsTools and workshop equipmentFurniture, fittings and office equipmentMotor vehiclesLease period of 3 to 60 years10 to 75 years or lease period of 3 to 30 years3 to 30 years60 years or lease period of 6 to 22 years8 to 80 years3 to 40 years3 to 20 years3 to 10 years1 to 10 years2 to 10 yearsThe assets’ depreciation methods, useful lives and residual values, if not insignificant, are reviewed annually andadjusted if appropriate.ii.Goodwill on acquisition of associates and joint ventures is included in investments in associates and joint ventures,respectively. An impairment loss on such investments is not allocated to any asset, including goodwill, that formspart of the carrying amount of the investments.Goodwill is tested for impairment on an annual basis in accordance with Note 2(m).Goodwill / Negative Goodwill Previously Written Off Against ReservesGoodwill that has previously been taken to reserves is not taken to profit or loss when (i) the business is disposed ofor discontinued or (ii) the goodwill is impaired. Similarly, negative goodwill that has previously been taken to reservesis not taken to profit or loss when the business is disposed of or discontinued.No depreciation is provided on freehold land and capital work-in-progress.<strong>Full</strong>y depreciated assets are retained in the financial statements until they are no longer in use.170 Powering the Future <strong>Sembcorp</strong> Industries Annual Report 2012 171
Notes to the Financial StatementsNotes to the Financial Statements2. Summary of Significant Accounting Policies (cont’d)f. Intangible Assets (cont’d)iii. Research and DevelopmentExpenditure on research activities, undertaken with the prospect of gaining new scientific or technical knowledgeand understanding, is recognised in profit or loss as an expense as incurred.Expenditure on development activities, whereby research findings are applied to a plan or design for the productionof new or substantially improved products and processes, is capitalised only if development costs can be measuredreliably, the product or process is technically and commercially feasible, future economic benefits are probable, andthe Group has sufficient resources to complete development and to use or sell the asset. The expenditure capitalisedincludes the cost of materials, direct labour and an appropriate proportion of overheads that are directly attributableto preparing the asset for its intended use. Other development expenditure is recognised in profit or loss as anexpense as incurred.Capitalised development expenditure is measured at cost less accumulated amortisation and accumulatedimpairment losses.iv. Service Concession ArrangementsThe Group recognises an intangible asset arising from a service concession arrangement when it has a right to chargefor usage of the concession infrastructure. An intangible asset received as consideration for providing construction orupgrade services in a service concession arrangement is measured at fair value upon initial recognition. Subsequentto initial recognition, the intangible asset is measured at cost, which includes capitalised borrowing costs, lessaccumulated amortisation and accumulated impairment losses.The estimated useful life of an intangible asset in a service concession arrangement is the period when it is availablefor use to the end of the concession period.Amortisation is charged to profit or loss on a straight-line basis over the estimated useful lives of 25 to 30 years.v. Water RightsWater rights are perpetual in nature. Water rights are measured at cost less accumulated impairment losses. Waterrights are tested for impairment annually in accordance with Note 2(m).vi. Other Intangible AssetsOther intangible assets with a finite life are measured at cost less accumulated amortisation and accumulatedimpairment losses. Expenditure on internally generated goodwill is recognised in profit or loss as an expense asincurred. Other intangible assets are amortised on a straight-line basis from the date the asset is available for useand over its estimated useful lives ranging from 3 to 30 years.vii. Subsequent ExpenditureSubsequent expenditure on capitalised intangible assets is capitalised only when it increases the future economicbenefits embodied in the specific asset to which it relates. All other expenditure is expensed as incurred.2. Summary of Significant Accounting Policies (cont’d)g. Financial AssetsThe Group initially recognises loans and receivables and deposits on the date that they are originated. All other financialassets (including assets designated at fair value through profit or loss) are recognised initially on the trade date, which isthe date that the Group becomes a party to the contractual provisions of the instrument.The Group derecognises a financial asset when the contractual rights to the cash flows from the asset expire, or ittransfers the rights to receive the contractual cash flows on the financial asset in a transaction in which substantially allthe risks and rewards of ownership of the financial asset are transferred. Any interest in transferred financial assets thatis created or retained by the Group is recognised as a separate asset or liability.Financial assets and liabilities are offset and the net amount presented in the balance sheets when, and only when, theGroup has a legal right to offset the amounts and intends either to settle on a net basis or to realise the asset and settlethe liability simultaneously.The Group classifies non-derivative financial assets into the following categories: financial assets at fair value throughprofit or loss; held to maturity investments; loans and receivables and available-for-sale financial assets. The classificationdepends on the purpose for which the financial assets are acquired or held. Management determines the classificationof its financial assets at initial recognition and re-evaluates this designation at every reporting date. The designation offinancial assets at fair value through profit or loss is irrevocable.i. Financial Assets at Fair Value Through Profit or LossA financial asset is classified at fair value through profit or loss if it is classified as held for trading or is designated assuch upon initial recognition. Financial assets are designated at fair value through profit or loss if the Group managessuch investments and makes purchase and sale decisions based on their fair value in accordance with the Group’sdocumented risk management or investment strategy. Upon initial recognition, attributable transaction costs arerecognised in profit or loss as incurred. Financial assets at fair value through profit or loss are measured at fair value,and changes therein are recognised in profit or loss.ii.Held to Maturity InvestmentsWhere the Group has the positive intent and ability to hold investments to maturity, then such investments arerecognised initially at fair value plus any directly attributable transaction costs and subsequently measured atamortised cost using the effective interest method less impairment losses. During the year, the Group did not holdany investment in this category.iii. Loans and ReceivablesLoans and receivables are financial assets with fixed or determinable payments that are not quoted in an activemarket. They arise when the Group provides money, goods or services directly to a debtor with no intention oftrading the receivable. They are included in current assets, except for maturities greater than 12 months after thebalance sheet date for which they are classified as non-current assets. Loans and receivables are recognised initiallyat fair value plus any directly attributable transaction costs and subsequently measured at amortised cost using theeffective interest method. Receivables with a short duration are not discounted. Loans and receivables are includedin trade and other receivables in the balance sheet.Loans and receivables comprise cash and cash equivalents, trade and other receivables, including service concessionreceivables.Cash and Cash EquivalentsCash and cash equivalents comprise cash balances and bank deposits. For the purpose of the statement of cashflows, cash and cash equivalents are presented net of bank overdrafts which are repayable on demand. Bankoverdrafts are shown within interest-bearing borrowings in current liabilities on the balance sheet.172 Powering the Future <strong>Sembcorp</strong> Industries Annual Report 2012 173
Notes to the Financial StatementsNotes to the Financial Statements2. Summary of Significant Accounting Policies (cont’d)g. Financial Assets (cont’d)iii. Loans and Receivables (cont’d)Service Concession ArrangementThe Group recognises a financial asset arising from a service concession arrangement when it has an unconditionalcontractual right to receive cash or another financial asset from or at the direction of the grantor for the constructionor upgrade services provided. Such financial assets are measured at fair value upon initial recognition. Subsequentto initial recognition, the financial assets are measured at amortised cost.If the Group is paid for the construction services partly by a financial asset and partly by an intangible asset, theneach component of the consideration is accounted for separately and is recognised initially at the fair value of theconsideration (see also Note 2(f)(iv)).iv. Available-for-Sale Financial AssetsOther financial assets held by the Group that are either designated in this category or not classified in any othercategory, are classified as being available-for-sale. They are included in non-current assets unless managementintends to dispose of the investment within 12 months of the balance sheet date. They are recognised initially atfair value plus any directly attributable transaction costs. Subsequent to initial recognition, they are measured at fairvalue and changes therein, other than impairment losses and foreign currency differences are recognised directlyin other comprehensive income. When these investments are derecognised, the cumulative gain or loss previouslyrecognised directly in other comprehensive income, or part thereof, is recognised in profit or loss. Where theseinvestments are interest-bearing, interest calculated using the effective interest method is recognised in profit or loss.ImpairmentThe Group assesses at each balance sheet date whether there is objective evidence that a financial asset or a groupof financial assets is impaired. A financial asset is impaired if objective evidence indicates that a loss event hasoccurred after the initial recognition of the asset, and that the loss event has a negative effect on the estimatedfuture cash flows of that asset that can be estimated reliably.Objective evidence that financial assets (including equity securities) are impaired can include default or delinquencyby a debtor, restructuring of an amount due to the Group on terms that the Group would not consider otherwise,indications that a debtor or issuer will enter bankruptcy, adverse changes in the payment status of borrowers orissuers in the Group, economic conditions that correlate with defaults or the disappearance of an active market for asecurity. In addition, for an investment in an equity security, a significant or prolonged decline in its fair value belowits cost is objective evidence of impairment.When a decline in the fair value of an available-for-sale financial asset has been recognised directly in othercomprehensive income and there is objective evidence that the value of the asset is impaired, the cumulative lossthat had been recognised directly in other comprehensive income is recognised in profit or loss even though thefinancial asset has not been derecognised. The amount of the cumulative loss that is recognised in profit or loss isthe excess of acquisition cost less any impairment loss on that financial asset previously recognised in profit or loss,over its current fair value.2. Summary of Significant Accounting Policies (cont’d)g. Financial Assets (cont’d)iv. Available-for-Sale Financial Assets (cont’d)Reversals of ImpairmentAn impairment loss in respect of a held-to-maturity investment security or receivable carried at amortised cost isreversed if the subsequent increase in recoverable amount can be related objectively to an event occurring after theimpairment loss was recognised. The decrease in impairment loss is reversed through profit or loss.An impairment loss once recognised in profit or loss in respect of an investment in an equity instrument classifiedas available-for-sale is not reversed through profit or loss. Any subsequent increase in fair value of such assets isrecognised directly in other comprehensive income. If the fair value of a debt instrument classified as availablefor-saleincreases and the increase can be objectively related to an event occurring after the impairment loss wasrecognised in profit or loss, the impairment loss shall be reversed, with the amount of the reversal recognised inprofit or loss.h. DerivativesDerivative financial instruments are used to manage exposures to foreign exchange, interest rate and commodity pricerisks arising from operational, financing and investment activities. Derivative financial instruments are not used for tradingpurposes. However, derivatives that do not qualify for hedge accounting are accounted for as trading instruments.Derivative financial instruments are recognised initially at fair value; attributable transaction costs are recognised inprofit or loss as incurred. Subsequent to initial recognition, derivative financial instruments are remeasured at fair value.The gain or loss on remeasurement to fair value is recognised immediately in profit or loss. However, where derivativesqualify for hedge accounting, recognition of any resultant gain or loss depends on the nature of the item being hedgedas described in Note 2(i).i. Hedging ActivitiesThe Group documents at the inception of the transaction the relationship between the hedging instruments and hedgeditems, together with the methods that will be used to assess the effectiveness of the hedge relationship as well asits risk management objective and strategies for undertaking various hedge transactions. The Group also documentsits assessment, both at hedge inception and on an ongoing basis, of whether the derivatives designated as hedginginstruments are highly effective in offsetting changes in fair value or cash flows of the hedged items.i. Fair Value HedgesWhere a derivative financial instrument hedges the changes in fair value of a recognised asset or liability or anunrecognised firm commitment (or an identified portion of such asset, liability or firm commitment), any gain or losson the hedging instrument is recognised in profit or loss. The hedged item is also measured at fair value in respectof the risk being hedged, with any gain or loss recognised in profit or loss.An impairment loss in respect of a financial asset measured at amortised cost is calculated as the difference betweenits carrying amount and the present value of the estimated future cash flows, discounted at the asset’s originaleffective interest rate. Losses are recognised in profit or loss and reflected in an allowance account against loansand receivables or held-to-maturity investment securities. Interest on the impaired asset continues to be recognised.When a subsequent event (e.g. repayment by a debtor) causes the amount of impairment loss to decrease, thedecrease in impairment loss is reversed through profit or loss.174 Powering the Future <strong>Sembcorp</strong> Industries Annual Report 2012 175
Notes to the Financial StatementsNotes to the Financial Statements2. Summary of Significant Accounting Policies (cont’d)i. Hedging Activities (cont’d)ii. Cash Flow HedgesWhere a derivative financial instrument is designated as a hedge of the variability in cash flows attributable to aparticular risk associated with a recognised asset or liability, or a highly probable forecast transaction, the effectivepart of any gain or loss on the derivative financial instrument is recognised directly in other comprehensive income.The ineffective part of any gain or loss is recognised immediately in profit or loss. When the forecast transactionsubsequently results in the recognition of a non-financial asset or non-financial liability, or the forecast transactionfor a non-financial asset or non-financial liability becomes a firm commitment for which fair value hedge accountingis applied, the associated cumulative gain or loss is removed from equity and included in the initial cost or othercarrying amount of the non-financial asset or liability. If a hedge of a forecast transaction subsequently results in therecognition of a financial asset or financial liability, the associated gains and losses that were recognised directly inother comprehensive income are reclassified into profit or loss in the same period or periods during which the assetacquired or liability assumed affects profit or loss.When a hedging instrument expires or is sold, terminated or exercised, or the entity revokes designation of the hedgerelationship but the hedged forecast transaction is still expected to occur, then hedge accounting is discontinuedprospectively. The cumulative gain or loss at that point remains in equity and is recognised in accordance withthe above policy when the transaction occurs. If the hedged transaction is no longer expected to take place, thecumulative unrealised gain or loss recognised in equity is recognised immediately in profit or loss.iii. Hedge of Monetary Assets and LiabilitiesWhere a derivative financial instrument is used to hedge economically the foreign exchange exposure of a recognisedmonetary asset or liability, no hedge accounting is applied and any gain or loss on the hedging instrument isrecognised in profit or loss.iv. Hedge of Net Investment in a Foreign OperationThe gain or loss on a financial instrument used to hedge a net investment in a foreign operation is recognised in theCompany’s profit or loss. On consolidation, only the portion of the gain or loss on the hedging instrument that isdetermined to be an effective hedge is reclassified to other comprehensive income. This amount is recognised in theconsolidated profit or loss on disposal of the foreign operation.v. Separable Embedded DerivativesChanges in the fair value of separable embedded derivatives are recognised immediately in profit or loss.j. Inventoriesi. Finished Goods and ComponentsInventories are measured at the lower of cost and net realisable value.Cost is calculated using the weighted average cost formula and comprises all costs of purchase, costs of conversionand other costs incurred in bringing the inventories to their present location and condition. In the case ofmanufactured inventories and work-in-progress, cost includes an appropriate share of overheads based on normaloperating capacity. Costs of inventories also include the transfer from other comprehensive income, if any, of gainsor losses on qualifying cash flow hedges relating to purchases of raw materials.Net realisable value is the estimated selling price in the ordinary course of business less the estimated costs ofcompletion and the estimated costs necessary to make the sale.2. Summary of Significant Accounting Policies (cont’d)j. Inventories (cont’d)ii. Long-term ContractsThe accounting policy for recognition of contract revenue is set out in Note 2(u)(ii).Long-term contracts-in-progress at the balance sheet date are recorded in the balance sheet at cost plus attributableprofit less recognised losses, net of progress billings and allowance for foreseeable losses, and are presented inthe balance sheet as “Work-in-progress” (as an asset) or “Excess of progress billings over work-in-progress” (as aliability), as applicable. Long-term contract costs include the cost of direct materials, direct labour and costs incurredin connection with the project. When it is probable that total contract costs will exceed total contract revenue, theexpected loss is recognised as an expense immediately.Progress billings not yet paid by the customer are included in the balance sheet under “Trade receivables”. Amountsreceived before progress billings are included in the balance sheet, as “Advance payments from customers”.k. Trade ReceivablesTrade receivables (including service concession receivables) are recognised initially at fair value and subsequently measuredat amortised cost using the effective interest method.An allowance for impairment of trade receivables is established when there is objective evidence that the Group will notbe able to collect all amounts due according to the original terms of the receivables. The amount of the allowance is thedifference between the asset’s carrying amount and the present value of estimated future cash flows, discounted at theeffective interest rate. The amount of the allowance is recognised in profit or loss.l. Government GrantsAsset related grants are credited to a deferred asset grant account at fair value and are released to profit or loss on thestraight-line basis over the estimated useful lives of the relevant assets.Non-monetary government grants and assets received are valued at fair value or nominal amounts.Grants that compensate the Group for expenses incurred are recognised in profit or loss as other income on a systematicbasis in the same periods in which the expenses are recognised.m. Impairment – Non-financial AssetsThe carrying amounts of the Group’s non-financial assets, other than inventories and deferred tax assets, are reviewed ateach reporting date to determine whether there is any indication of impairment. If any such indication exists, the assets’recoverable amounts are estimated. An impairment loss is recognised whenever the carrying amount of an asset or itscash-generating unit (CGU) exceeds its recoverable amount. A CGU is the smallest identifiable asset group that generatescash flows that largely are independent from other assets and groups. Impairment losses are recognised in profit or lossunless it reverses a previous revaluation that was credited to equity, in which case it is charged to equity. Impairmentlosses recognised in respect of CGUs are allocated first to reduce the carrying amount of any goodwill allocated to theCGU (group of CGUs) and then, to reduce the carrying amounts of the other assets in the CGU (group of CGUs) on apro rata basis.Goodwill, intangible assets with indefinite useful lives and intangible assets not yet available for use are tested forimpairment annually and as and when indicators of impairment occur.176 Powering the Future <strong>Sembcorp</strong> Industries Annual Report 2012 177
Notes to the Financial StatementsNotes to the Financial Statements2. Summary of Significant Accounting Policies (cont’d)m. Impairment – Non-financial Assets (cont’d)i. Calculation of Recoverable AmountThe recoverable amount of an asset or CGU is the greater of its value in use and its fair value less costs to sell. Inassessing value in use, the estimated future cash flows are discounted to their present value using a pre-tax discountrate that reflects current market assessments of the time value of money and the risks specific to the asset or CGU.2. Summary of Significant Accounting Policies (cont’d)o. Deferred IncomeWhen the Group receives advance payments from customers in respect of connection and capacity charges for the supplyand delivery of gas and utilities, the Group recognises the deferred income to profit or loss on a straight-line basis overthe period stipulated in the respective customer contract commencing from the date of supply and delivery of gas andutilities.ii.Subject to an operating segment ceiling test, for the purposes of goodwill impairment testing, CGUs to whichgoodwill has been allocated are aggregated so that the level at which impairment testing is performed reflectsthe lowest level at which goodwill is monitored for internal reporting purposes. Goodwill acquired in a businesscombination is allocated to groups of CGUs that are expected to benefit from the synergies of the combination.Reversals of ImpairmentAn impairment loss in respect of goodwill is not reversed, even if it relates to an impairment loss recognised inan interim period that would have been reduced or avoided had the impairment assessment been made at asubsequent reporting or balance sheet date. In respect of other assets, impairment losses recognised in prior periodsare assessed at each reporting date for any indications that the loss has decreased or no longer exists.An impairment loss is reversed if there has been a change in the estimates used to determine the recoverableamount. An impairment loss is reversed only to the extent that the assets’ carrying amount does not exceed thecarrying amount that would have been determined, net of depreciation or amortisation, if no impairment loss hadbeen recognised.When the Group receives a deferred income and a financial asset as consideration for providing construction services ina service concession arrangement, the Group recognises the deferred income as the difference between the fair valueof the construction services provided and the fair value of the financial asset received. The fair value of the constructionservices provided is estimated as the value of construction services at an arm’s length transaction between willing parties.The fair value of the financial asset received is estimated as the present value of the minimum guaranteed sum receivablefrom the grantor of the service concession which is discounted at the imputed rate of interest i.e. the prevailing rateof interest for a similar instrument of the grantor. On completion of the construction services, the deferred income ina service concession arrangement is amortised over the estimated useful life. Subsequent to initial recognition, thedeferred income is measured at cost less accumulated amortisation.p. Employee Benefitsi. Defined Contribution PlansA defined contribution plan is a post-employment benefit plan under which an entity pays fixed contributionsinto a separate entity and will have no legal or constructive obligation to pay further amounts. Obligations forcontributions to defined contribution plans are recognised as an expense in profit or loss as incurred.Goodwill that forms part of the carrying amount of an investment in an associate or joint venture is not recognisedseparately, and therefore is not tested for impairment separately. Instead, the entire amount of the investment inan associate or joint venture is tested for impairment as a single asset when there is objective evidence that theinvestment in an associate or joint venture may be impaired.n. Non-derivative Financial LiabilitiesThe Group initially recognises debt securities issued and subordinated liabilities on the date that they are originated. Allother financial liabilities (including liabilities designated at fair value through profit or loss) are recognised initially on thetrade date, which is the date that the Group becomes a party to the contractual provisions of the instrument.The Group derecognises a financial liability when its contractual obligations are discharged, cancelled or expired.Financial assets and liabilities are offset and the net amount presented in the balance sheets when, and only when, theGroup has a legal right to offset the amounts and intends either to settle on a net basis or to realise the asset and settlethe liability simultaneously.The Group classifies non-derivative financial liabilities into the other financial liabilities category. Such financial liabilitiesare recognised initially at fair value plus any directly attributable transaction costs. Subsequent to initial recognition, thesefinancial liabilities are measured at amortised cost using the effective interest method.Other financial liabilities comprise loans and borrowings, bank overdrafts, and trade and other payables.Bank overdrafts that are repayable on demand and form an integral part of the Group’s cash management are includedas a component of cash and cash equivalents for the purpose of the statement of cash flows.ii.Defined Benefit PlansA defined benefit plan is a post-employment benefit plan other than a defined contribution plan. The Group’snet obligation in respect of defined benefit pension plans is calculated separately for each defined benefit planby estimating the amount of future benefit that employees have earned in return for their service in the currentand prior periods; that benefit is discounted to determine the present value, and the fair value of any plan assetsis deducted. The discount rate is the yield at balance sheet date on high quality bonds that have maturity datesapproximating the terms of the Group’s obligations. The calculation is performed by a qualified actuary on a regularbasis using a relevant actuarial method. In the intervening years the calculation is updated based on informationreceived from the actuary.When the benefits of a plan change, the portion of the increased benefit relating to past service by employees isrecognised as an expense in profit or loss on a straight-line basis over the average period until the benefits becomevested. To the extent that the benefits vest immediately, the expense is recognised immediately in profit or loss.Actuarial gains and losses arise mainly from changes in actuarial assumptions and differences between actuarialassumptions and what has actually occurred. They are recognised in profit or loss, over the expected averageremaining working lives of the employees participating in the plan, only to the extent that their cumulative amountexceeds 10% of the greater of the present value of the obligation and of the fair value of plan assets. Unrecognisedactuarial gains and losses are reflected in the balance sheet.For defined benefit plans, the actuarial cost charged to profit or loss consists of current service cost, interest cost,expected return on plan assets and past service cost as well as actuarial gains or losses to the extent that they arerecognised. The past service cost for the enhancement of pension benefits is accounted for when such benefit vestsor becomes a constructive obligation.178 Powering the Future <strong>Sembcorp</strong> Industries Annual Report 2012 179
Notes to the Financial StatementsNotes to the Financial Statements2. Summary of Significant Accounting Policies (cont’d)p. Employee Benefits (cont’d)ii. Defined Benefit Plans (cont’d)Where the calculation results in a benefit to the Group, the recognised asset is limited to the net total of anyunrecognised actuarial losses and past service costs and the present value of any future refunds from the plan orreductions in future contributions to the plan.The Group recognises gains and losses on the curtailment or settlement of a defined benefit plan when thecurtailment or settlement occurs. The gain or loss on curtailment comprises any resulting change in the fair value ofplan assets, change in the present value of defined benefit obligation and any related actuarial gains and losses andpast service cost that had not previously been recognised.iii. Short-term Employee BenefitsShort-term employee benefit obligations are measured on an undiscounted basis and are expensed as the relatedemployment service is provided.The amount expected to be paid is accrued when the Group has a present legal or constructive obligation to pay thisamount as a result of past service provided by the employee and the obligation can be estimated reliably.iv. Staff Retirement BenefitsRetirement benefits payable to certain categories of employees upon their retirement are provided for in the financialstatements based on their entitlement under the staff retirement benefit plan or, in respect of unionised employeesof a subsidiary who joined on or before December 31, 1988, based on an agreement with the union.The Group’s net obligation in respect of retirement benefits is the amount of future benefit that employees haveearned in return for their service in the current and prior periods. The obligation is calculated using the projectedfuture salary increase and is discounted to its present value and the fair value of any related assets is deducted.v. Equity and Equity-related Compensation BenefitsShare Option PlanThe share option programme allows the Group’s employees to acquire shares of the Group companies. The fair valueis measured at grant date and spread over the period during which the employees become unconditionally entitledto the options. The fair value of options granted is recognised as an employee expense with a corresponding increasein equity. At each balance sheet date, the Company revises its estimates of the number of options that are expectedto become exercisable. It recognises the impact of the revision of original estimates in employee expense and in acorresponding adjustment to equity over the remaining vesting period.The proceeds received net of any directly attributable transaction costs are credited to share capital when new sharesare issued. The amount in the share-based payments reserve is retained when the option is exercised or expires.Where treasury shares are issued, the difference between the cost of treasury shares and the proceeds received netof any directly attributable costs are transferred to share-based payments reserve.2. Summary of Significant Accounting Policies (cont’d)p. Employee Benefits (cont’d)v. Equity and Equity-related Compensation Benefits (cont’d)Performance Share PlanThe fair value of equity-related compensation is measured using the Monte Carlo simulation method as at the dateof the grant. The method involves projecting future outcomes using statistical distributions of key random variablesincluding the share prices and volatility of returns. This model takes into account the probability of achieving theperformance conditions in the future.The fair value of the compensation cost is measured at grant date and amortised over the service period to whichthe performance criteria relates and the period during which the employees become unconditionally entitled to theshares. In estimating the fair value of the compensation cost, market-based performance conditions are taken intoaccount. The compensation cost is charged to profit or loss with a corresponding increase in equity on a basis thatfairly reflects the manner in which the benefits will accrue to the employee under the plan over the service period towhich the performance period relates, irrespective of whether this performance condition is satisfied.The share-based payments reserve relating to the performance shares released is transferred to share capital whennew shares are issued. When treasury shares are issued, the cost of treasury shares is transferred to share-basedpayments reserve.Restricted Share PlanSimilar to the Performance Share Plan, the fair value of equity-related compensation is measured using the MonteCarlo simulation method as at the date of the grant. The method involves projecting future outcomes usingstatistical distributions of key random variables including the share prices and volatility of returns. This model takesinto account the probability of achieving the performance conditions in the future.The fair value of the compensation cost is measured at grant date and amortised over the service period to whichthe performance criteria relates and the period during which the employees become unconditionally entitled to theshares. In estimating the fair value of the compensation cost, non-market-based performance conditions are takeninto account. The compensation cost is charged to profit or loss with a corresponding increase in equity on a basisthat fairly reflects the manner in which the benefits will accrue to the employee under the plan over the serviceperiod to which the performance period relates.At the balance sheet date, the Company revises its estimates of the number of performance-based restricted sharesthat the employees are expected to receive based on the achievement of non-market performance conditions andthe number of shares ultimately given. It recognises the impact of the revision of the original estimates in employeeexpense and in a corresponding adjustment to equity over the remaining vesting period.The share-based payments reserve relating to the restricted shares released is transferred to share capital when newshares are issued. When treasury shares are issued, the cost of treasury shares is transferred to share-based paymentsreserve.In the Company’s separate financial statements, the fair value of options, performance shares and restricted sharesgranted to employees of its subsidiaries is recognised as an increase in the cost of the Company’s investment insubsidiaries, with a corresponding increase in equity over the vesting period.180 Powering the Future <strong>Sembcorp</strong> Industries Annual Report 2012 181
Notes to the Financial StatementsNotes to the Financial Statements2. Summary of Significant Accounting Policies (cont’d)p. Employee Benefits (cont’d)vi. Cash-related Compensation Benefits<strong>Sembcorp</strong> Challenge BonusThe Group recognises a liability and an expense for bonuses and profit-sharing, based on a formula that takes intoconsideration the share price of the Company. The Group recognises a provision when contractually obliged to payor where there is a past practice that has created a constructive obligation to pay.The compensation cost is measured at the fair value of the liability at each balance sheet date and spread overthe service period to which the performance criteria relates and the period during which the employees becomeunconditionally entitled to the bonus. The liability takes into account the probability of achieving the performanceconditions in the future.Until the liability is settled, the Group will re-measure the fair value of the liability at each balance sheet date and atthe date of settlement with any changes in fair value recognised in profit or loss for the period.q. ProvisionsA provision is recognised in the balance sheet when there is a present legal or constructive obligation as a result of a pastevent, the obligation can be reliably estimated and it is probable that an outflow of economic benefits will be requiredto settle the obligation. If the effect is material, provisions are determined by discounting the expected future cash flowsat a pre-tax rate that reflects current market assessments of the time value of money and, where appropriate, the risksspecific to the liability.r. Tax ExpenseTax expense comprises current and deferred tax. Tax expense is recognised in profit or loss except to the extent that itrelates to business combinations, or to items recognised directly in equity, in which case it is recognised in equity or inother comprehensive income.Current tax is the expected tax payable or receivable on the taxable income or loss for the year, using tax rates enactedor substantively enacted at the reporting date and any adjustment to tax payable in respect of previous years.Deferred tax is recognised in respect of temporary differences between the carrying amounts of assets and liabilities forfinancial reporting purposes and the amounts used for taxation purposes. Deferred tax is not recognised for the followingtemporary differences: the initial recognition of goodwill, the initial recognition of assets or liabilities in a transactionthat is not a business combination and that affects neither accounting nor taxable profit or loss, and differences relatingto investments in subsidiaries, joint ventures and associates to the extent that the Group is able to control the timingof the reversal of the temporary difference and it is probable that they will not reverse in the foreseeable future. Themeasurement of deferred tax reflects the consequences that would follow the manner in which the Group expects, at theend of the reporting period, to recover or settle the carrying amount of its assets and liabilities. Deferred tax is measuredat the tax rates that are expected to be applied to the temporary differences when they reverse, based on the laws thathave been enacted or substantively enacted by the reporting date. Deferred tax assets and liabilities are offset if there is alegally enforceable right to offset current tax liabilities and assets and they relate to taxes levied by the same tax authorityon the same taxable entity, or on different tax entities, but they intend to settle current tax liabilities and assets on a netbasis or their tax assets and liabilities will be realised simultaneously.A deferred tax asset is recognised for unused tax losses, tax credits and deductible temporary differences, to the extentthat it is probable that future taxable profits will be available against which they can be utilised. Deferred tax assets arereviewed at each reporting date and are reduced to the extent that it is no longer probable that the related tax benefitwill be realised.2. Summary of Significant Accounting Policies (cont’d)s. Share CapitalOrdinary shares are classified as equity.Incremental costs directly attributable to the issuance of new ordinary shares and share options are deducted against theshare capital account, net of any tax effects.Where the Company’s ordinary shares are repurchased (treasury shares), the consideration paid, excluding any directlyattributable incremental costs, is deducted from equity attributable to the Company’s equity holders and presented asreserve for own shares within equity, until they are cancelled, sold or reissued.When treasury shares are cancelled, the cost of treasury shares is deducted against the share capital account, if theshares are purchased out of capital of the Company, or against the accumulated profits of the Company, if the sharesare purchased out of profits of the Company.When treasury shares are subsequently sold or reissued pursuant to the Share-based Incentive Plans, the cost of thetreasury shares is reversed from the reserve for own shares account and the realised gain or loss on sale or reissue, netof any directly attributable incremental transaction costs and related tax, is recognised as a change in equity of theCompany. No gain or loss is recognised in profit or loss.Preference shares are classified as equity if it is non-redeemable or redeemable only at the Company’s option, and anydividends are discretionary. Discretionary dividends thereon are recognised as distributions within equity upon approvalby the Company’s shareholders.t. DividendsDividends on ordinary shares are recognised when they are approved for payments. Dividends on ordinary shares andredeemable convertible preference share capital classified as equity are accounted for as movements in revenue reserve.u. Revenue Recognitioni. Income on Goods Sold and Services RenderedRevenue from goods sold is recognised when the significant risks and rewards of ownership have been transferredto the buyer. Revenue from the provision of consultancy services is recognised using the percentage of completionmethod. The stage of completion is measured by reference to the percentage of cost incurred to-date to theestimated total costs for each project. Revenue on other service work is recognised when the work is completed.Revenue excludes goods and services or other sales taxes and is after deduction of any trade discounts. No revenueis recognised if there are significant uncertainties regarding recovery of the consideration due, associated costs orthe possible return of goods.ii.Contract RevenueRevenue from repair work, engineering, overhaul, service work and marine and civil construction contracts isrecognised based on percentage of completion. The percentage of completion is assessed by reference to surveys ofwork performed, or by reference to the ratio of costs incurred to-date to the estimated total costs for each contract,with due consideration given to the inclusion of only those costs that reflect work performed.When the outcome of a long-term contract can be estimated reliably, contract revenue and costs are recognised asincome and expense respectively using the percentage of completion method. When the outcome of a long-termcontract cannot be estimated reliably, revenue is recognised only to the extent of contract costs incurred that canprobably be recovered and contract costs are recognised as an expense in the period in which they are incurred.182 Powering the Future <strong>Sembcorp</strong> Industries Annual Report 2012 183
Notes to the Financial StatementsNotes to the Financial Statements2. Summary of Significant Accounting Policies (cont’d)u. Revenue Recognition (cont’d)iii. Sale of Electricity, Utilities and GasesRevenue from the sale of electricity, utilities and gases is measured at the fair value of the consideration receivedor receivable, net of returns and allowances, trade discounts and volume rebates. Revenue is recognised whenelectricity, utilities and gases are delivered based on contractual terms stipulated in respective agreements withcustomers.iv. Service Concession RevenueRevenue relating to construction services under a service concession arrangement is recognised based on the stageof completion of the work performed, consistent with the Group’s accounting policy on recognising revenue onconstruction contracts (see (ii) above). Operation or service revenue is recognised in the period in which the servicesare provided by the Group. When the Group provides more than one service in a service concession arrangement,the consideration received is allocated by reference to the relative fair values of the services delivered.v. Rental IncomeRental income receivable under operating lease is recognised in profit or loss on a straight-line basis over the termof the lease. Lease incentives granted are recognised as an integral part of total rental income, over the term of thelease.v. Dividend and Interest IncomeDividend income is recognised in profit or loss on the date that the Group’s right to receive payment is established.Interest income is recognised as it accrues in profit or loss, using the effective interest rate method.w. Leasesi. Operating LeaseWhen entities within the Group are lessees of an operating leaseWhere the Group has the use of assets under operating leases, payments made under the leases are recognised inprofit or loss on a straight-line basis over the term of the lease. Lease incentives received are recognised in profit orloss as an integral part of the total lease payments made.2. Summary of Significant Accounting Policies (cont’d)y. Segment ReportingAn operating segment is a component of the Group that engages in business activities from which it may earnrevenues and incur expenses, including revenues and expenses that relate to transactions with any of the Group’s othercomponents. All operating segments’ operating results are reviewed regularly by the Group President & CEO to makedecisions about resources to be allocated to the segment and assess its performance, and for which discrete financialinformation is available.Segment capital expenditure is the total cost incurred during the year to acquire property, plant and equipment, andintangible assets other than goodwill.z. Assets (or Disposal Groups) Held For SaleNon-current assets (or disposal groups) are classified as assets held for sale and measured at the lower of carrying amountand fair value less costs to sell if they are expected to be recovered principally through a sale transaction rather thanthrough continuing use.Any impairment losses on initial classification and subsequent gains or losses on remeasurement are recognised in profitor loss. Subsequent increases in fair value less costs to sell are recognised in profit or loss (not exceeding the accumulatedimpairment loss that has been previously recognised).aa. Financial Guarantee ContractsFinancial guarantee contracts are accounted for as insurance contracts and treated as contingent liabilities until suchtime as they become probable that the Company will be required to make a payment under the guarantee. A provisionis recognised based on the Group’s estimate of the ultimate cost of settling all claims incurred but unpaid at the balancesheet date. The provision is assessed by reviewing individual claims and tested for adequacy by comparing the amountrecognised and the amount that would be required to settle the guarantee contract.When entities within the Group are lessors of an operating leaseAssets subject to operating leases are included in investment properties and are measured at cost less accumulateddepreciation and impairment losses. Rental income (net of any incentives given to lessees) is recognised on a straightlinebasis over the lease term.ii.Finance LeaseWhen entities within the Group are lessors of a finance leaseAmounts due from lessees under finance leases are recorded as receivables at the amount of the Group’s netinvestment in the leases. Finance lease income is allocated to accounting periods so as to reflect a constant periodicrate of return on the Group’s net investment outstanding in respect of the leases.x. Finance CostsFinance costs comprise of interest expense and termination of interest rate swaps. Interest expense and similar chargesare expensed in profit or loss in the period using the effective interest method, except to the extent that they arecapitalised as being directly attributable to the acquisition, construction or production of a qualifying asset. The interestcomponent of finance lease payments is recognised in profit or loss using the effective interest method. Termination ofinterest rate swaps are recognised in profit or loss.184 Powering the Future <strong>Sembcorp</strong> Industries Annual Report 2012 185
Notes to the Financial StatementsNotes to the Financial Statements3. Property, Plant and EquipmentLeasehold andFurniture,freehold land, Tools and fittings andwet berthage Improvements Quays and Plant and Marine workshop office Motor Capitaland buildings to premises dry docks Infrastructure machinery vessels equipment equipment vehicles work-in-progress TotalNote S$’000 S$’000 S$’000 S$’000 S$’000 S$’000 S$’000 S$’000 S$’000 S$’000 S$’000GroupCost / ValuationBalance at January 1, 2012 808,638 44,520 356,494 252,234 2,984,961 17,350 43,380 123,573 56,543 1,522,098 6,209,791Translation adjustments (18,256) (884) (12) (7,453) (67,986) – (59) (1,027) (1,038) (41,002) (137,717)Additions 22,209 1,061 946 16,978 182,310 401 4,627 10,637 39,980 1,026,683 1,305,832Reclassification 196,088 3,229 8 (1,333) 1,026,404 – 383 2,461 94 (1,227,334) –Transfer from / (to) intangible assets 12 – – – 2,267 – – – (8,732) – (5,122) (11,587)Disposals / Write-offs (664) – (542) (270) (14,909) – (526) (4,836) (4,407) (724) (26,878)Acquisition of subsidiary 4,678 – – – 1,822 – – 331 6 210 7,047Balance at December 31, 2012 1,012,693 47,926 356,894 262,423 4,112,602 17,751 47,805 122,407 91,178 1,274,809 7,346,488Accumulated Depreciation and Impairment LossesBalance at January 1, 2012 302,899 27,343 188,463 3,171 1,250,841 10,323 35,020 103,669 38,487 – 1,960,216Translation adjustments (3,228) (196) (12) (1,279) (17,898) – (55) (884) (492) – (24,044)Depreciation for the year (v), 33(a) 31,763 2,769 20,231 4,112 189,746 897 3,639 9,227 4,378 – 266,762Reclassification (189) 217 – (211) 210 – (44) 17 – – –Transfer from / (to) intangible assets 12 – – – 217 – – – (6,269) – – (6,052)Disposals / Write-offs (345) – (542) (25) (13,075) – (524) (4,817) (4,276) – (23,604)Allowance made for impairment – net 33(a) 6 – – – 14,903 – – – 35 – 14,944Balance at December 31, 2012 330,906 30,133 208,140 5,985 1,424,727 11,220 38,036 100,943 38,132 – 2,188,222Carrying AmountAt December 31, 2012 681,787 17,793 148,754 256,438 2,687,875 6,531 9,769 21,464 53,046 1,274,809 5,158,266Cost / ValuationBalance at January 1, 2011 791,557 41,020 356,232 251,282 2,737,946 16,738 39,904 120,351 53,508 807,980 5,216,518Translation adjustments (4,156) (218) (1) (7,151) (2,088) – (27) (352) (843) 4,741 (10,095)Additions 5,462 2,745 520 14,697 88,924 496 4,318 9,186 8,948 918,018 1,053,314Reclassification 22,741 1,464 – 387 183,011 116 (506) 525 305 (208,043) –Transfer from / (to) intangible assets 12 3,858 – – 822 (573) – – 23 88 (214) 4,004Disposals / Write-offs (10,824) (491) (257) (7,803) (22,259) – (309) (6,160) (5,463) (384) (53,950)Balance at December 31, 2011 808,638 44,520 356,494 252,234 2,984,961 17,350 43,380 123,573 56,543 1,522,098 6,209,791Accumulated Depreciation and Impairment LossesBalance at January 1, 2011 287,171 25,527 168,268 3,489 1,113,048 9,476 31,938 98,901 40,121 – 1,777,939Translation adjustments (2,430) (271) – (1,424) (2,871) – (13) (245) (448) – (7,702)Depreciation for the year (v), 33(a) 26,613 2,581 20,244 7,226 146,476 847 3,637 10,840 3,955 – 222,419Reclassification (1,143) (8) – 79 1,283 – (236) 5 20 – –Transfer from / (to) intangible assets 12 1,864 – – 146 (1,253) – – (4) (3) – 750Disposals / Write-offs (8,990) (486) (49) (6,345) (21,177) – (306) (5,828) (5,158) – (48,339)Allowance (reversed) / made for impairment – net 33(a) (186) – – – 15,335 – – – – – 15,149Balance at December 31, 2011 302,899 27,343 188,463 3,171 1,250,841 10,323 35,020 103,669 38,487 – 1,960,216Carrying AmountAt December 31, 2011 505,739 17,177 168,031 249,063 1,734,120 7,027 8,360 19,904 18,056 1,522,098 4,249,575186 Powering the Future <strong>Sembcorp</strong> Industries Annual Report 2012 187
Notes to the Financial StatementsNotes to the Financial Statements3. Property, Plant and Equipment (cont’d)Leasehold andFurniture,freehold land,fittings andwet berthage Improvements Quays and Plant and office Motor Capitaland buildings to premises dry docks machinery equipment vehicles work-in-progress TotalNote S$’000 S$’000 S$’000 S$’000 S$’000 S$’000 S$’000 S$’000CompanyCostBalance at January 1, 2012 19,820 3,997 8,226 522,099 12,475 929 19,378 586,924Additions 189 822 – 32,147 1,698 298 148,184 183,338Reclassification – 75 – 7,006 280 – (7,361) –Transfer to intangible assets 12 – – – – – – (338) (338)Intercompany transfer – – – – (17) – – (17)Disposals / Write-offs (21) – – (617) (702) – – (1,340)Balance at December 31, 2012 19,988 4,894 8,226 560,635 13,734 1,227 159,863 768,567Accumulated Depreciationand Impairment LossesBalance at January 1, 2012 3,723 2,453 1,619 118,327 9,912 625 – 136,659Depreciation for the year 969 407 405 31,953 1,680 165 – 35,579Intercompany transfer – – – – (17) – – (17)Disposals / Write-offs (5) – – (211) (699) – – (915)Allowance made for impairment – net 6 – – 14,903 – – – 14,909Balance at December 31, 2012 4,693 2,860 2,024 164,972 10,876 790 – 186,215Carrying AmountAt December 31, 2012 15,295 2,034 6,202 395,663 2,858 437 159,863 582,352CostBalance at January 1, 2011 19,828 2,243 8,280 510,495 11,488 929 1,978 555,241Additions 29 1,759 – 10,460 1,405 – 19,319 32,972Reclassification – – – 1,431 201 – (1,632) –Transfer to intangible assets 12 – – – – (113) – (100) (213)Intercompany transfer – – – – (2) – – (2)Disposals / Write-offs (37) (5) (54) (287) (504) – (187) (1,074)Balance at December 31, 2011 19,820 3,997 8,226 522,099 12,475 929 19,378 586,924Accumulated Depreciationand Impairment LossesBalance at January 1, 2011 2,765 2,097 1,222 86,644 8,714 455 – 101,897Depreciation for the year 965 356 405 31,390 1,707 170 – 34,993Transfer to intangible assets 12 – – – – (3) – – (3)Intercompany transfer – – – – (1) – – (1)Disposals / Write-offs (7) – (8) (101) (505) – – (621)Allowance made for impairment – net – – – 394 – – – 394Balance at December 31, 2011 3,723 2,453 1,619 118,327 9,912 625 – 136,659Carrying AmountAt December 31, 2011 16,097 1,544 6,607 403,772 2,563 304 19,378 450,265188 Powering the Future <strong>Sembcorp</strong> Industries Annual Report 2012 189
Notes to the Financial StatementsNotes to the Financial Statements3. Property, Plant and Equipment (cont’d)Group and CompanyDuring the year, management noted indications of impairment with respect to 2 plants due to changes in projected operatingcosts updated based on market movements and management expectations. The Group tested the plants for impairment. Therecoverable amounts of the plants were based on calculations of their value-in-use (VIU) and were determined by discountingthe future cash flows generated from the continuing use of the plants. The calculations used cash flow projections from years2013 to 2020 and 2013 to 2014, which are based on financial budgets / forecasts approved by management. No terminalvalue was assumed and a pre-tax discount rate of 4.8% has been used. Forward High Sulphur Fuel Oil (HSFO) rates wereused to estimate the variable revenue and costs of direct materials for the cash flows projections. An impairment loss ofS$14,909,000 was recognised in the cost of sales.GroupIn 2011, management noted indications of impairment with respect to a plant due to changes in projected operating costsupdated based on market movements and management expectations. The Group tested the plant for impairment. Therecoverable amount of the plant was based on calculations of its VIU and was determined by discounting the future cashflows generated from the continuing use of the plant. These calculations used cash flow projections from years 2012 to 2021,which are based on financial budgets / forecasts approved by management. No terminal value was assumed and a pre-taxdiscount rate of 5.6% has been used. Forward HSFO rates were used to estimate the variable revenue and costs of directmaterials for the cash flow projections. The Group reassessed its estimates and noted no further impairment was required.The impairment loss of S$14,935,000 was recognised in the cost of sales in 2011.i. Property, plant and equipment with the following net book values have been pledged to secure loan facilities granted tosubsidiaries:ii.Group2012 2011Note S$’000 S$’000Freehold land and buildings – 23,152Leasehold land and buildings 85,304 40,481Plant and machinery 990,271 548,963Capital work-in-progress – 635,020Other assets – 1,09125(a) 1,075,575 1,248,707Assets with net book value of S$19,014,000 (2011: S$10,868,000) were acquired under finance lease.iii. Included in the cost of leasehold land and buildings, quays and dry docks and plant and machinery are amounts ofS$120,866,000, S$100,900,000 and S$667,000 (2011: S$120,866,000, S$100,900,000 and S$667,000) respectivelywhich were measured at valuation as determined by firms of professional valuers. Also included in the cost of quaysand dry docks is an amount of S$25,152,000 (2011: S$25,152,000) which was measured at Directors’ valuation. Theserevaluations were done on a one-off basis prior to January 1, 1997.iv. During the year, interest and direct staff costs amounting to S$25,112,000 (2011: S$64,729,000) and S$7,058,000(2011: S$8,225,000), respectively were capitalised as capital work-in-progress.v. During the year, depreciation amounting to S$529,000 (2011: S$nil) was capitalised as work-in-progress.4. Investment PropertiesGroup2012 2011Note S$’000 S$’000CostBalance at January 1 45,621 45,802Translation adjustments (290) (153)Disposals (2,097) (28)Balance at December 31 43,234 45,621Accumulated Depreciation and Impairment LossesBalance at January 1 22,614 21,690Depreciation for the year 33(a) 1,033 924Disposals (2,097) –Balance at December 31 21,550 22,614Carrying AmountAt December 31 21,684 23,007The following amounts are recognised in profit or loss:Group2012 2011S$’000S$’000Rental income 8,790 8,252Operating expenses arising from rental of investment properties 3,510 4,276In 2011, investment properties with net book value of S$9,211,000 have been pledged to secure loan facilities granted to asubsidiary. The loan facilities were repaid during the year. See Note 25 for details on pledge on investment properties.The fair value of the investment properties as at the balance sheet date is S$51,975,000 (2011: S$54,485,000). The fairvalues are mostly determined by independent professional valuers. In the absence of current prices in an active market, thefair values are determined by considering the aggregate of the estimated cash flow expected to be received from renting outthe properties or Directors’ valuation. A yield that reflects the specific risks inherent in the cash flows is then applied to thenet annual cash flows to obtain the fair values.5. Investments in SubsidiariesCompany2012 2011S$’000S$’000At cost and carrying value:Quoted equity shares 713,048 713,048Unquoted equity shares 603,911 453,912Preference shares 387,500 387,500Share-based payments reserve 4,092 6,7791,708,551 1,561,239190 Powering the Future <strong>Sembcorp</strong> Industries Annual Report 2012 191
Notes to the Financial StatementsNotes to the Financial Statements5. Investments in Subsidiaries (cont’d)The fair value of the equity interest of the listed subsidiary with carrying amount of S$713,048,000 (2011: S$713,048,000),amounts to S$5,820,705,514 (2011: S$4,833,716,318) based on the last transacted market price as at December 31, 2012(December 31, 2011).Details of significant subsidiaries are set out in Note 47.6. Interests in Associates and Joint VenturesGroup2012 2011S$’000S$’000Interests in associates 868,533 843,127Interests in joint ventures 637,076 501,5731,505,609 1,344,700The carrying value as at year end includes goodwill on acquisition as follows:Group2012 2011S$’000S$’000Balance at beginning of the year 2,093 2,098Translation during the year (106) (5)Balance at end of the year 1,987 2,093The fair value of the equity interest of a listed associate, with a carrying amount of S$203,829,000 (2011: S$205,025,000),amounts to S$164,461,000 (2011: S$138,494,000) based on the last transacted market price as at December 31, 2012(December 31, 2011).During the year, the Group acquired interest in joint ventures where the principal activities are the operation of four windpower assets which comprise three plants in Inner Mongolia and one plant in Hebei, People’s Republic of China, for aconsideration of S$58,313,000.Summarised financial information of associates is as follows:Group2012 2011S$’000S$’0006. Interests in Associates and Joint Ventures (cont’d)The summarised financial information relating to associates disclosed above is not adjusted for the percentage of ownershipheld by the Group.The Group’s interest in an associate has been pledged to banks to secure credit facilities granted to the associate.Summarised financial information of joint ventures, representing the Group’s share, is as follows:Group’s share2012 2011S$’000S$’000Combined resultsTurnover 466,578 458,402Expenses (369,434) (364,900)Profit before tax 97,144 93,502Tax expense (16,362) (13,556)Profit for the year 80,782 79,946Group’s share2012 2011S$’000S$’000Combined assets and liabilitiesNon-current assets 1,137,595 598,262Current assets 418,270 406,943Current liabilities (232,246) (164,980)Non-current liabilities (677,246) (331,961)Non-controlling interests (10,926) (8,426)Net assets 635,447 499,838Capital commitments 359,562 706,810The Group’s interest in a joint venture with a carrying amount of S$58,899,000 (2011: S$56,736,000) as at the balance sheetdate has been pledged to banks to secure credit facilities granted to the joint venture entity.Details of the significant associates and joint ventures are set out in Note 48.Combined resultsTurnover 5,766,482 6,444,647Profit for the year 215,755 266,272Combined assets and liabilitiesNon-current assets 6,486,964 6,739,073Current assets 6,121,982 5,189,589Total assets 12,608,946 11,928,662Non-current liabilities 4,509,523 3,685,440Current liabilities 4,419,646 4,793,237Total liabilities 8,929,169 8,478,677192 Powering the Future <strong>Sembcorp</strong> Industries Annual Report 2012 193
Notes to the Financial StatementsNotes to the Financial Statements7. Other Financial AssetsGroupCompany2012 2011 2012 2011S$’000 S$’000 S$’000 S$’000a. Non-current AssetsAvailable-for-sale financial assets:– Equity shares 151,277 131,607 – –– Unit trusts and funds 4,121 1,300 – –155,398 132,907 – –Financial assets at fair value through profit or loss,on initial recognition:– Interest rate swaps – 11,412 – –– Equity shares 45,044 17 – –Cash flow hedges:– Forward foreign exchange contracts 18,532 885 – –– Fuel oil swaps 2,125 59 – –221,099 145,280 – –b. Current AssetsFinancial assets at fair value through profit or loss,on initial recognition:– Forward foreign exchange contracts 853 330 – 24– Foreign exchange swap contracts 2,123 3,914 – –Cash flow hedges:– Forward foreign exchange contracts 33,195 7,842 – –– Fuel oil swaps 5,338 4,459 – –41,509 16,545 – 24The financial assets designated at fair value through profit or loss relates to investment in equity shares, which owns, operatesand manages a plant in the People’s Republic of China. The acquisition consideration was S$44,380,000.8. Long-term Receivables and PrepaymentsGroupCompany2012 2011 2012 2011Note S$’000 S$’000 S$’000 S$’000Long-term trade receivables 9 74 881 – –Service concession receivables (a) 244,887 253,438 – –Finance lease receivables due after 12 months 10 – 6,999 – –Amounts due from related parties 11 114,598 79,483 – –Staff loans 83 92 – –Other debtors (b) 6,952 – – –Loan and receivables 40(b) 366,594 340,893 – –Prepayments (c) 33,273 36,080 7,420 7,730Defined benefit assets 24(b) 5,352 3,491 – –405,219 380,464 7,420 7,7308. Long-term Receivables and Prepayments (cont’d)a. Service concession receivablesThe subsidiaries in Singapore, Chile and Panama each have entered into service concession arrangements with the localGovernments. Under these arrangements, the subsidiaries are to supply treated water to the local Governments forperiods ranging from 25 years to 30 years. All of these arrangements fall within the scope of INT FRS 112.The significant aspects of the service concession arrangements are as follows:i. The subsidiaries will receive a minimum guaranteed sum from the grantors in exchange for services performed.The subsidiaries recognised these as financial receivables as they have contractual rights under the concessionarrangements. The financial receivables are measured on initial recognition at their fair value using interest ratesranging from 3.5% to 12.0%; andii.Upon expiry of the concession arrangements, the assets are to be transferred to the local Governments.b. Other debtorsOther debtors balance relates primarily to an amount placed into an escrow account by <strong>Sembcorp</strong> (UK) Limited for asteam condensing turbine project.c. PrepaymentsPrepayments are charged to profit or loss on a straight-line basis over the period of prepayments. It relates primarily to:Groupi. Connection fees prepaid under the Generation Connection and Use of System Agreement for the use of thetransmission lines; andii.Service fees prepaid under the Gasoil Supply and Storage Agreement for the usage of the tank.Companyi. Connection and capacity charges prepaid for the use of pipelines and piperacks.9. Trade ReceivablesGroupCompany2012 2011 2012 2011Note S$’000 S$’000 S$’000 S$’000Trade receivables including work completedbut unbilled 603,549 563,153 30,880 33,686Allowance for doubtful receivables (26,426) (19,195) (101) –577,123 543,958 30,779 33,686Trade receivables due within 1 year 15 (577,049) (543,077) (30,779) (33,686)8 74 881 – –194 Powering the Future <strong>Sembcorp</strong> Industries Annual Report 2012 195
Notes to the Financial StatementsNotes to the Financial Statements10. Finance Lease ReceivablesMinimum Estimated Total gross Unearned Net valuelease residual investment interest of leasepayment value in lease income receivablesNote S$’000 S$’000 S$’000 S$’000 S$’000Group2012Within 1 year – – – – –After 1 year but within 5 years – – – – –Amount due within 1 year 15 – – – – –8 – – – – –2011Within 1 year 4,219 – 4,219 (386) 3,833After 1 year but within 5 years 4,219 3,000 7,219 (220) 6,9998,438 3,000 11,438 (606) 10,832Amount due within 1 year 15 (4,219) – (4,219) 386 (3,833)8 4,219 3,000 7,219 (220) 6,999In 2012, the lease receivables were settled in full. Prior to the settlement, interest rate was charged at 4.25% (2011: 4.25%)per annum. Those lease receivables relate to the leases of marine vessels for which the lessees also had the option to purchasethe marine vessels during the term of the leases. There were no contingent rents recognised.11. Amounts Due from Related PartiesJoint Related Non-controllingAssociates ventures companies interests Total2012 2011 2012 2011 2012 2011 2012 2011 2012 2011Note S$’000 S$’000 S$’000 S$’000 S$’000 S$’000 S$’000 S$’000 S$’000 S$’000GroupAmounts due from:Trade 5,292 4,028 86,772 18,966 570 986 46 31 92,680 24,011Non-trade 1,473 1,719 37,288 13,582 – – 49 – 38,810 15,301Loans 25,683 31,365 45,543 49,154 – – – – 71,226 80,51932,448 37,112 169,603 81,702 570 986 95 31 202,716 119,831Allowance fordoubtful receivables (2,056) (1,709) (19) (13,246) 138 38 – – (1,937) (14,917)30,392 35,403 169,584 68,456 708 1,024 95 31 200,779 104,914Amount duewithin 1 year 15 (5,683) (5,074) (79,695) (19,302) (708) (1,024) (95) (31) (86,181) (25,431)8 24,709 30,329 89,889 49,154 – – – – 114,598 79,483The non-trade amounts due from related parties are unsecured, repayable on demand and interest-free.The loans to associates are unsecured, not expected to be repaid in the next 12 months and bear interest rates of 1.12%(2011: 0.88%) per annum.The loan to a joint venture is unsecured, not expected to be repaid in the next 12 months and bears a weighted average rateof 0.41% (2011: 0.28%) per annum.196 Powering the Future <strong>Sembcorp</strong> Industries Annual Report 2012 197
Notes to the Financial StatementsNotes to the Financial Statements11. Amounts Due from Related Parties (cont’d)JointRelatedSubsidiaries Associates ventures companies Total2012 2011 2012 2011 2012 2011 2012 2011 2012 2011Note S$’000 S$’000 S$’000 S$’000 S$’000 S$’000 S$’000 S$’000 S$’000 S$’000CompanyAmounts due fromrelated parties 16,460 8,435 1,238 104 276 304 273 232 18,247 9,07515 16,460 8,435 1,238 104 276 304 273 232 18,247 9,075The amounts due from related parties are unsecured, repayable on demand and interest-free.12. Intangible AssetsService Intellectualconcession propertyGoodwill arrangements rights Water rights Others TotalNote S$’000 S$’000 S$’000 S$’000 S$’000 S$’000GroupCostBalance atJanuary 1, 2012 141,707 148,266 33,559 12,241 15,578 351,351Translation adjustments (1,985) (10,723) – (22) (614) (13,344)Additions – 6,961 – – 3,137 10,098Transfer fromproperty, plantand equipment 3 – 3,033 – – 8,554 11,587Disposals – (567) – – (18) (585)Write-offs 33(a) – – – – (4) (4)Balance atDecember 31, 2012 139,722 146,970 33,559 12,219 26,633 359,103AccumulatedAmortisation andImpairment LossesBalance atJanuary 1, 2012 1,901 10,105 2,685 – 4,777 19,468Translation adjustments – (1,702) – – (191) (1,893)Amortisation chargefor the year 33(a) – 8,711 3,356 – 2,287 14,354Impairment loss 33(a) – – – – 5 5Transfer (to) / fromproperty, plantand equipment 3 – (217) – – 6,269 6,052Disposals – (146) – – (11) (157)Write-offs 33(a) – – – – (2) (2)Balance atDecember 31, 2012 1,901 16,751 6,041 – 13,134 37,82712. Intangible Assets (cont’d)Service Intellectualconcession propertyGoodwill arrangement rights Water rights Others TotalNote S$’000 S$’000 S$’000 S$’000 S$’000 S$’000GroupCostBalance atJanuary 1, 2011 141,708 127,749 – 12,289 40,452 322,198Translation adjustments (1) (2,900) – (48) (2,386) (5,335)Additions – 3,740 33,559 – 1,279 38,578Transfer (to) / fromproperty, plantand equipment 3 – (4,336) – – 332 (4,004)Reclassification – 24,013 – – (24,013) –Write-offs 33(a) – – – – (86) (86)Balance atDecember 31, 2011 141,707 148,266 33,559 12,241 15,578 351,351AccumulatedAmortisation andImpairment LossesBalance atJanuary 1, 2011 1,980 2,775 – – 5,609 10,364Translation adjustments (79) (489) – – (993) (1,561)Amortisation chargefor the year 33(a) – 6,394 2,685 – 2,394 11,473Impairment loss 33(a) – – – – 5 5Transfer (to) / fromproperty, plantand equipment 3 – (758) – – 8 (750)Reclassification – 2,183 – – (2,183) –Write-offs 33(a) – – – – (63) (63)Balance atDecember 31, 2011 1,901 10,105 2,685 – 4,777 19,468Carrying AmountAt December 31, 2011 139,806 138,161 30,874 12,241 10,801 331,883Carrying AmountAt December 31, 2012 137,821 130,219 27,518 12,219 13,499 321,276198 Powering the Future <strong>Sembcorp</strong> Industries Annual Report 2012 199
Notes to the Financial StatementsNotes to the Financial Statements12. Intangible Assets (cont’d)Goodwill Others TotalNote S$’000 S$’000 S$’000CompanyCostBalance at January 1, 2012 18,946 802 19,748Additions – 609 609Transfer from property, plant and equipment 3 – 338 338Balance at December 31, 2012 18,946 1,749 20,695Accumulated Amortisation and Impairment LossesBalance at January 1, 2012 – 233 233Amortisation charge for the year – 454 454Balance at December 31, 2012 – 687 687Carrying AmountAt December 31, 2012 18,946 1,062 20,008CompanyCostBalance at January 1, 2011 18,946 179 19,125Additions – 410 410Transfer from property, plant and equipment 3 – 213 213Balance at December 31, 2011 18,946 802 19,748Accumulated Amortisation and Impairment LossesBalance at January 1, 2011 – 28 28Amortisation charge for the year – 202 202Transfer from property, plant and equipment 3 – 3 3Balance at December 31, 2011 – 233 233Carrying AmountAt December 31, 2011 18,946 569 19,51512. Intangible Assets (cont’d)Service concession arrangementsThe subsidiaries in South Africa and China have service concession agreements with the local municipalities in Mbombelaand Ilembe in South Africa; and Fuzhou, Xinmin and Yanjiao in People’s Republic of China. Under these agreements, thesubsidiaries are to supply drinking water to the local communities for periods of 25 to 30 years. All of these arrangementsfall within the scope of INT FRS 112.In January 2011, a new agreement was signed by Qitaihe with the local Government for an additional period of 15 yearsand the Build-Own-Operate-Transfer (BOOT) arrangement was replaced with Build-Own-Operate (BOO) arrangement. Thisarrangement does not fall within the scope of INT FRS 112. As such, the assets with carrying amount of S$3,578,000 havebeen reclassified to property, plant and equipment.The significant aspects of the above service concession arrangements are as follows:• The arrangements are 25 to 30 years concession arrangements for water treatment with the respective municipalgovernments. The Group has a total of 2 BOOT arrangements and 3 concession contracts as at the end of the reportingperiod.• Under the BOOT arrangement, the operator is required to design, construct, own as well as operate, manage andmaintain the assets and water services works for the supply of water.• Under the concession contract, the operator has a right of use of all assets of the local authority concerning water andsanitation. Concessional rights include rights to possess, use, operate, manage, maintain, rehabilitate, redesign, improveand expand existing assets and water services, as well as rights to own, design, construct any new assets and waterservices works within the geographical scope of concession.• Upon expiry of the concession, the assets are to be transferred to the local municipality at no cost.• The tariffs in the South Africa subsidiaries are subject to review every 5 years. The tariffs are adjusted annually withan escalation formula based on costs specified in the contract. Tariff adjustments have to be approved by the LocalMunicipality in the city where the project is located; the tariffs in China are regulated by the Administrative Measures onPricing of Municipal Water Supply issued by the State Development and Reform Commission (SDRC). Tariffs adjustmentshave to be approved by the Water Supply Company and Price Bureau, with the local institution controlling prices underthe SDRC, in the city where the project is located. The tariff adjustment is based on the previous year consumer priceindex as stipulated in the concession agreements.Water rightsThe water rights have infinite useful lives and are perpetual in nature. The water rights as established in the acquisitioncontracts were obtained from the General Water Directorate (DGA), a regulatory body under the Ministry of Public Worksin Chile. The rights allow the Group to extract water from the specific water sources and supply water to end customers.200 Powering the Future <strong>Sembcorp</strong> Industries Annual Report 2012 201
Notes to the Financial StatementsNotes to the Financial Statements12. Intangible Assets (cont’d)GoodwillGroupImpairment Testing for GoodwillFor the purpose of impairment testing, goodwill is allocated to the Group’s operating divisions which represent the lowestlevel within the Group at which the goodwill is monitored for internal management purposes.The aggregate carrying amounts of goodwill allocated to each unit are as follows:Group2012 2011Note S$’000 S$’000Cash-generating Unit (CGU)SUT Division (a) 18,946 18,946<strong>Sembcorp</strong> Cogen Pte Ltd (b) 26,378 26,378<strong>Sembcorp</strong> Gas Pte Ltd (c) 41,986 41,986<strong>Sembcorp</strong> Bournemouth Water Limited / (2011: Water Segment comprisingSouth Africa, United Kingdom and The Americas) (d) 29,857 31,765Multiple units with insignificant goodwill 20,654 20,731137,821 139,806The recoverable amounts are determined using value-in-use calculations. Cash flow projections used in the value-in-usecalculations were prepared with management’s past experience in operating the business and forward market outlook over thelong-term nature of the business. Pre-tax discount rates ranging from 4.8% to 7.2% (2011: 4.7% to 12.0%) have been used.At the balance sheet date, based on the following key assumptions, the recoverable amounts exceed their carrying amounts.a. SUT Divisioni. Use cash flow projections over a period of 10 years;ii. Estimation of demand and supply for industrial utilities and services are computed based on long-term securedcontracts with customers updated with new contracts signed over the financial year;iii. Scheduled plant maintenance and its associated costs have been accounted for in the forecast. Yearly maintenancecost is assumed to range from 3% to 4% of the asset value;iv. Expected capital expenditure for replenishment of parts has been included in the forecasts in accordance with plantmaintenance programme;v. Inflation rate assumption ranging from 3% to 6% has been used to project overheads and other general expenses;andvi. Cash flows are estimated based on the anticipated offtake with its secured customers over the remaining contractualperiod.12. Intangible Assets (cont’d)Goodwill (cont’d)Group (cont’d)b. <strong>Sembcorp</strong> Cogen Pte Ltdi. Use cash flow projections over a period of 10 years;ii. Estimation of demand and supply of electricity and electricity margin is derived based on forecasted marketconditions leading to pool price movement;iii. Scheduled plant maintenance and its associated costs have been accounted for in the forecast. Yearly maintenancecost is assumed to range from 6% to 10% of the asset value;iv. Expected capital expenditure for replenishment of parts has been included in the forecasts in accordance with plantmaintenance programme; andv. Inflation rate assumption of 3% has been used to project overheads and other general expenses.c. <strong>Sembcorp</strong> Gas Pte Ltdi. Use cash flow projections over a period of 10 years;ii.Forward depreciating USD / SGD exchange rate and High Sulphur Fuel Oil (HSFO) prices against current financial yearwere assumed in the forecast performance;iii. Projected maintenance cost to service the gas pipelines has been included in the forecast;iv. Inflation rate assumption of 3% has been used to project overheads and other general expenses; andv. Cash flows are estimated based on the sale and purchases quantities of gas over the remaining contractual periodof the existing contracts.d. <strong>Sembcorp</strong> Bournemouth Water Limited (2011: Water Segment comprising South Africa, United Kingdomand The Americas)In 2012, there was a change in the Chief Operating Decision Maker for the operations in United Kingdom, South Africaand The Americas, as the Group reorganises its reporting structure in a way that changes the composition of its cashgeneratingunits (CGU) to which goodwill has been allocated.i. These calculations use cash flow projections from years 2013 to 2017;ii.Terminal value is assumed based on cash flow in 2017 with 3.5% growth;iii. Included capital expenditure necessary to maintain and run the water plant at the required capacity;iv. Energy costs increase ranging from 4% to 8% per annum until 2017; andv. Staff cost increases at rates between 2% to 2.5% until 2017.CompanyThe Company’s goodwill relates to goodwill of SUT on the acquisition of the SUT Division in 2008.202 Powering the Future <strong>Sembcorp</strong> Industries Annual Report 2012 203
Notes to the Financial StatementsNotes to the Financial Statements13. Deferred Tax Assets and LiabilitiesMovements in deferred tax assets and liabilities (prior to offsetting of balances) during the year are as follows:Recognised in Recognised inprofit or loss equity Acquisition of TranslationAt Jan 1 (Note 32) (Note 29) subsidiary adjustments At Dec 31S$’000 S$’000 S$’000 S$’000 S$’000 S$’000Group2012Deferred tax liabilitiesProperty, plant and equipment 363,822 35,623 – 127 (6,203) 393,369Interests in associates 7,304 1,641 – – 21 8,966Fair value adjustments 30,322 – 6,904 – (1) 37,225Trade and other receivables 5,400 2,183 – – (79) 7,504Other items 8,080 (944) – – 1,112 8,248Total 414,928 38,503 6,904 127 (5,150) 455,312Deferred tax assetsProperty, plant and equipment (22,696) (14,234) – – 1,203 (35,727)Inventories (373) 16 – – – (357)Trade receivables (462) 313 – – 1 (148)Trade and other payables (2,480) 13 – – (13) (2,480)Tax losses (1,478) (270) – – (16) (1,764)Provisions (16,182) (856) – – (1,034) (18,072)Fair value adjustments (14,408) (2,583) 1,657 – 55 (15,279)Retirement benefit obligations (3,868) 2,107 – – 95 (1,666)Other items (25,985) 7 – – – (25,978)Total (87,932) (15,487) 1,657 – 291 (101,471)13. Deferred Tax Assets and Liabilities (cont’d)Recognised in Recognised inprofit or loss equity TranslationAt Jan 1 (Note 32) (Note 29) adjustments At Dec 31S$’000 S$’000 S$’000 S$’000 S$’000Group2011Deferred tax liabilitiesProperty, plant and equipment 357,155 12,098 – (5,431) 363,822Interests in associates 4,387 2,916 – 1 7,304Fair value adjustments 63,978 25 (33,681) – 30,322Trade and other receivables 5,792 (6) – (386) 5,400Other items 11,480 (4,779) – 1,379 8,080Total 442,792 10,254 (33,681) (4,437) 414,928Deferred tax assetsProperty, plant and equipment (25,657) 4,443 – (1,482) (22,696)Inventories (23) (350) – – (373)Trade receivables (629) 164 – 3 (462)Trade and other payables (7,520) 5,056 – (16) (2,480)Tax losses (1,619) 29 – 112 (1,478)Provisions (11,342) (5,774) – 934 (16,182)Fair value adjustments – (52) (14,381) 25 (14,408)Retirement benefit obligations – (3,754) – (114) (3,868)Other items (24,625) (573) – (787) (25,985)Total (71,415) (811) (14,381) (1,325) (87,932)Recognised in Recognised in Recognised inAt Jan 1, 2011 profit or loss At Dec 31, 2011 profit or loss equity At Dec 31, 2012S$’000 S$’000 S$’000 S$’000 S$’000 S$’000CompanyDeferred tax liabilitiesProperty, plant and equipment 42,084 (186) 41,898 (258) – 41,640Deferred tax assetsProvisions (1,549) – (1,549) – – (1,549)Derivative asset – – – – (30) (30)Total 40,535 (186) 40,349 (258) (30) 40,061204 Powering the Future <strong>Sembcorp</strong> Industries Annual Report 2012 205
Notes to the Financial StatementsNotes to the Financial Statements13. Deferred Tax Assets and Liabilities (cont’d)Deferred tax liabilities and assets are offset when there is a legally enforceable right to offset current tax assets against currenttax liabilities and when the deferred taxes relate to the same taxation authority. The amounts determined after appropriateoffsetting included in the balance sheet are as follows:14. Inventories and Work-In-ProgressGroupCompany2012 2011 2012 2011Note S$’000 S$’000 S$’000 S$’000GroupCompany2012 2011 2012 2011S$’000 S$’000 S$’000 S$’000Deferred tax liabilities 410,796 387,651 40,061 40,349Deferred tax assets (56,955) (60,655) – –353,841 326,996 40,061 40,349Raw materials 88,157 89,317 4,117 3,306Finished goods 102,857 101,149 5,640 5,466191,014 190,466 9,757 8,772Allowance for inventory obsolescence (17,758) (16,139) – –173,256 174,327 9,757 8,772Work-in-progress (a) 1,713,290 903,942 32 3291,886,546 1,078,269 9,789 9,101Deferred tax assets have not been recognised in respect of the following items:Group2012 2011S$’000S$’000a. Work-in-progress:Costs and attributable profits less allowancefor foreseeable losses 5,149,666 4,052,154 16,322 329Progress billings (4,322,418) (3,503,512) (16,290) –827,248 548,642 32 329Deductible temporary differences 6,786 6,975Tax losses 25,916 20,086Capital allowances 46,309 6,28779,011 33,348Tax losses of the Group amounting to S$10,821,000 (2011: S$12,745,000) will expire between 2014 and 2017 (2011: 2012and 2017). The capital allowances of S$45.8 million (2011: S$5.5 million) will expire in 2017 (2011: 2017). The remaining taxlosses and deductible temporary differences do not expire under current tax legislation.Comprising:Work-in-progress 1,713,290 903,942 32 329Excess of progress billings over work-in-progress (886,042) (355,300) – –827,248 548,642 32 329In 2012, the write-down of inventories to net realisable value by the Group amounted to S$3,859,000 (2011: S$8,228,000).The reversal of write-downs by the Group in 2012 amounted to S$30,000 (2011: S$154,000). The write-down and reversalare included in cost of sales.Deferred tax assets have not been recognised under the following circumstances:a. Where they qualified for offset against the tax liabilities of member companies within the Group under the Loss TransferSystem of Group Relief but the terms of the transfer have not been ascertained as at year end; and15. Trade and Other ReceivablesGroupCompany2012 2011 2012 2011Note S$’000 S$’000 S$’000 S$’000b. Where it is uncertain that future taxable profit will be available against which certain subsidiaries of the Group can utilisethe benefits.Trade receivables 9 577,049 543,077 30,779 33,686Current portion of finance lease 10 – 3,833 – –Service concession receivables 8(a) 10,529 10,686 – –Amounts due from related parties 11 86,181 25,431 18,247 9,075Other receivables and deposits 16 438,927 433,295 76,060 52,239Loans and receivables 40(b) 1,112,686 1,016,322 125,086 95,000Prepayments 44,905 41,050 5,570 5,715Advance to suppliers 17,910 32,887 2 1491,175,501 1,090,259 130,658 100,864206 Powering the Future <strong>Sembcorp</strong> Industries Annual Report 2012 207
Notes to the Financial StatementsNotes to the Financial Statements16. Other Receivables and DepositsGroupCompany2012 2011 2012 2011Note S$’000 S$’000 S$’000 S$’00019. Trade and Other PayablesGroupCompany2012 2011 2012 2011Note S$’000 S$’000 S$’000 S$’000Deposits 7,189 6,751 1,789 1,703Sundry receivables (a) 77,762 71,466 163 2,775Unbilled receivables (b) 349,990 348,386 74,387 46,758Loan receivables 4,116 4,153 – –Recoverable 3,795 6,509 (205) 1,077Interest receivable 507 499 – –443,359 437,764 76,134 52,313Allowance for doubtful receivables (4,432) (4,469) (74) (74)Other receivables and deposits 15 438,927 433,295 76,060 52,239a. Sundry receivables represent mainly GST receivables.b. Unbilled receivables represent revenue accrued for sale of utilities services, electricity, gas and other related products.17. Assets Held For SaleGroup2012 2011S$’000S$’000Property, plant and equipment 24,437 24,437In 2011, the carrying value of the assets is presented net of the provision of S$11.7 million made in previous year to reflectthe agreed consideration amount.18. Cash and Cash EquivalentsGroupCompany2012 2011 2012 2011S$’000 S$’000 S$’000 S$’000Fixed deposits with banks 884,979 2,135,152 – –Cash and bank balances 1,174,821 860,326 524,601 629,074Cash and cash equivalents in theconsolidated statement of cash flows 2,059,800 2,995,478 524,601 629,074Trade payables 1,767,406 1,888,872 2,429 2,872Advance payments from customers 34,671 40,640 715 17Amounts due to related parties 21 128,110 41,508 360,545 51,220Other payables and accrued charges 22 902,337 775,253 208,506 125,7742,832,524 2,746,273 572,195 179,88320. ProvisionsObligationsrelating toLoan disposal of Onerous Restorationundertakings business Claims contracts costs Warranty Others TotalS$’000 S$’000 S$’000 S$’000 S$’000 S$’000 S$’000 S$’000Group2012Balance atbeginning ofthe year – 1,010 65,312 4,140 32,316 47,027 4,804 154,609Translationadjustments – – (96) – (112) (426) (184) (818)Provisions(written back) /made duringthe year, net – (1,010) (518) – 14,695 (29,377) 999 (15,211)Provisions utilisedduring the year – – (2,843) (1,500) – (40) (423) (4,806)Balance at endof the year – – 61,855 2,640 46,899 17,184 5,196 133,774Provisions due:– within 1 year – – 61,082 2,292 – 17,184 2,520 83,078– after 1 year – – 773 348 46,899 – 2,676 50,696– – 61,855 2,640 46,899 17,184 5,196 133,774Fixed deposits with banks of the Group earn interest at rates ranging from 0.01% to 9.50% (2011: 0.01% to 9.00%) perannum.Included in the Company’s cash and cash equivalents at the balance sheet date are amounts of S$516.7 million (2011:S$621.8 million) placed with a bank under the Group’s cash pooling arrangement by a subsidiary.208 Powering the Future <strong>Sembcorp</strong> Industries Annual Report 2012 209
Notes to the Financial StatementsNotes to the Financial Statements20. Provisions (cont’d)Obligationsrelating toLoan disposal of Onerous Restorationundertakings business Claims contracts costs Warranty Others TotalS$’000 S$’000 S$’000 S$’000 S$’000 S$’000 S$’000 S$’000Group2011Balance atbeginning ofthe year 14,748 1,010 53,131 4,140 31,456 56,914 – 161,399Translationadjustments – – (29) – 23 (459) 99 (366)Provisions(written back) /made duringthe year, net (14,748) – 29,437 – 837 (7,144) 4,705 13,087Provisions utilisedduring the year – – (17,227) – – (2,284) – (19,511)Balance at endof the year – 1,010 65,312 4,140 32,316 47,027 4,804 154,609Provisions due:– within 1 year – 1,010 65,312 2,528 – 46,855 1,817 117,522– after 1 year – – – 1,612 32,316 172 2,987 37,087– 1,010 65,312 4,140 32,316 47,027 4,804 154,60920. Provisions (cont’d)Obligations relating toRestorationdisposal of business Claims costs TotalS$’000 S$’000 S$’000 S$’000Company2012Balance at beginning of the year 1,010 19,756 593 21,359Provisions (written back) / made during the year, net (1,010) (4,026) – (5,036)Provisions utilised during the year – (1,637) – (1,637)Balance at end of the year – 14,093 593 14,686Provisions due:– within 1 year – 14,093 – 14,093– after 1 year – – 593 593– 14,093 593 14,6862011Balance at beginning of the year 1,010 6,236 500 7,746Provisions (written back) / made during the year, net – 13,547 93 13,640Provisions utilised during the year – (27) – (27)Balance at end of the year 1,010 19,756 593 21,359Provisions due:– within 1 year 1,010 19,756 – 20,766– after 1 year – – 593 5931,010 19,756 593 21,359Loan UndertakingsThis relates to the Group’s share of loan undertakings of associates.Obligations Relating to Disposal of BusinessThis relates to the disposal of a business in which the Group and the Company retains certain obligations in respect ofcontracts pursuant to the Sale and Purchase Agreement.ClaimsThis provision relates to the obligations arising from contractual and commercial arrangements in the Group’s and the Company’soperations, based on the best estimate of the possible outflow considering both contractual and commercial factors.Onerous ContractsThe provision for onerous contracts relates to the Group’s exposure to the unavoidable cost of meeting its obligations underthe contracts, which exceeds the expected benefits to be derived by the Group. The provision is measured at the presentvalue of the lower of the expected cost of terminating the contract and the expected net cost of continuing with the contract.Before a provision is established, the Group recognises any impairment loss on the assets associated with the contracts.Restoration CostsRestoration costs relate to cost of dismantling and removing assets and restoring the premises to its original condition asstipulated in the operating lease agreements. The subsidiaries expect to incur the liability upon termination of the lease.WarrantyThe provision for warranty is based on estimates from weighting all possible outcomes by their associated probabilities andestimates made from historical warranty data associated with similar projects.210 Powering the Future <strong>Sembcorp</strong> Industries Annual Report 2012 211
Notes to the Financial StatementsNotes to the Financial Statements21. Amounts Due to Related PartiesJoint Related Non-controllingAssociates ventures companies interests Total2012 2011 2012 2011 2012 2011 2012 2011 2012 2011Note S$’000 S$’000 S$’000 S$’000 S$’000 S$’000 S$’000 S$’000 S$’000 S$’000GroupAmounts due to:Trade – – 2,871 2,424 63 78 24 26 2,958 2,528Non-trade 397 459 2,559 2,852 – – – – 2,956 3,311Advance payment– trade 1,858 2,341 – 32,510 – – – – 1,858 34,851Loans – – – – – – 128,071 140,410 128,071 140,4102,255 2,800 5,430 37,786 63 78 128,095 140,436 135,843 181,100Amounts dueafter 1 year 26 – – – – – (1) (7,733) (139,591) (7,733) (139,592)19 2,255 2,800 5,430 37,786 63 77 120,362 845 128,110 41,508Loans from non-controlling interests of S$7,733,000 (2011: S$139,591,000) bear interest at rate of 7.94% (2011: 3.53%to 8.35%) per annum, are unsecured and not expected to be repaid in the next 12 months. The remaining loan amount ofS$120,362,000 (2011: S$845,000) bears interest at rate of 7.94% (2011: nil) per annum, is unsecured and expected to berepaid within 12 months.The non-trade amounts due to related parties are unsecured, interest-free and repayable on demand.SubsidiariesTotal2012 2011 2012 2011Note S$’000 S$’000 S$’000 S$’000CompanyAmounts due to related parties (i) 25,345 51,220 25,345 51,220Loans from a related party (ii) 644,700 644,700 644,700 644,700670,045 695,920 670,045 695,920Amounts due after 1 year 26 (309,500) (644,700) (309,500) (644,700)19 360,545 51,220 360,545 51,220i. The amounts due to related parties are unsecured, interest-free and repayable on demand.ii. The loans from a related party of S$644,700,000 (2011: S$644,700,000) bear effective interest rate of 3.09% (2011:3.09%) per annum, are unsecured and repayable from December 31, 2013 onwards.212 Powering the Future <strong>Sembcorp</strong> Industries Annual Report 2012 213
Notes to the Financial StatementsNotes to the Financial Statements22. Other Payables and Accrued ChargesGroupCompany2012 2011 2012 2011Note S$’000 S$’000 S$’000 S$’00024. Retirement Benefit ObligationsGroup2012 2011Note S$’000 S$’000Accrued operating expenses 606,226 605,932 138,711 122,146Deposits 22,750 18,522 742 342Accrued interest payable 10,746 11,334 – –Other payables 106,724 77,861 3,306 3,286Accrued capital expenditure 155,891 61,604 65,747 –19 902,337 775,253 208,506 125,77423. Other Financial LiabilitiesGroupCompany2012 2011 2012 2011S$’000 S$’000 S$’000 S$’000Current LiabilitiesFinancial liabilities at fair value through profit or loss,on initial recognition:– Forward foreign exchange contracts 6 67 – –– Foreign exchange swap contracts 2,123 4,359 – –Cash flow hedges:– Interest rate swaps 6,071 7,797 – –– Forward foreign exchange contracts 5,509 8,776 177 –– Fuel oil swaps 2,552 1,510 – –16,261 22,509 177 –Non-current LiabilitiesFinancial liabilities at fair value through profit or loss,on initial recognition:– Interest rate swaps – 11,412 – –Cash flow hedges:– Interest rate swaps 159,968 161,477 – –– Forward foreign exchange contracts 1,199 13,664 – –– Fuel oil swaps 278 772 – –161,445 187,325 – –Provision for retirement gratuities (a) 1,409 1,343Defined benefit obligations (b) 10,045 16,39711,454 17,740Non-current 11,454 17,740a. Provision for Retirement GratuitiesGroup2012 2011S$’000S$’000Balance at beginning of the year 1,343 1,110Translation adjustments (21) –Provision made during the year 301 646Less: Amount due within 12 months (214) (413)Balance at end of the year 1,409 1,343b. Defined Benefit ObligationsCertain subsidiaries provide pension arrangements to its full time employees through defined benefit plans and therelated costs are assessed in accordance with the advice of professionally qualified actuaries.The numbers shown below have been based on calculations carried out by qualified independent actuaries to take intoaccount of the requirements of FRS 19 in order to assess the liabilities of the schemes at December 31, 2012.The present values of the funded defined benefit obligations, the related current service cost and, where applicable, pastservice cost were measured using the projected unit credit method. Details of the schemes are as follows:Group2012 2011S$’000S$’000Present value of funded defined benefit obligations 339,934 327,785Fair value of plan assets (321,055) (311,237)Deficit in scheme 18,879 16,548Unrecognised actuarial losses (14,186) (3,642)Net liability recognised in the balance sheet 4,693 12,906The amounts included in the balance sheet are as follows:Group2012 2011Note S$’000 S$’000Defined benefit obligations 10,045 16,397Defined benefit assets 8 (5,352) (3,491)4,693 12,906214 Powering the Future <strong>Sembcorp</strong> Industries Annual Report 2012 215
Notes to the Financial StatementsNotes to the Financial Statements24. Retirement Benefit Obligations (cont’d)b. Defined Benefit Obligations (cont’d)The proportion of fair value of plan assets at the balance sheet is analysed as follows:24. Retirement Benefit Obligations (cont’d)b. Defined Benefit Obligations (cont’d)Expenses / (income) recognised in the profit or loss are as follows:Group2012 2011% %Equity instruments 34.9 35.2Debt instruments 55.2 55.1Other assets 9.9 9.7100.0 100.0The plan assets do not include any of the Group’s own financial instruments, nor any property occupied by, or otherassets used by the Group. Changes in the present value of defined benefit obligations are as follows:Group2012 2011S$’000S$’000Current service cost 1,571 1,440Past service cost – 91Interest cost 14,658 16,118Expected return on plan assets (16,116) (16,605)113 1,044The expense / (income) is recognised in the following line items in the profit or loss:Group2012 2011S$’000S$’000Opening defined benefit obligations 327,785 318,015Translation adjustments (10,927) (4,904)Current service cost 1,571 1,440Past service cost – 91Interest cost 14,658 16,118Actuarial losses 19,937 11,214Benefits paid (13,359) (14,469)Employee contributions 269 280339,934 327,785Changes in the fair value of plan assets are as follows:Group2012 2011S$’000S$’000Opening fair value of plan assets 311,237 307,617Translation adjustments (9,938) (4,745)Expected return on plan assets 16,116 16,605Actuarial gains 9,393 1,529Contributions by employer 7,337 4,420Benefits paid (13,359) (14,469)Employee contributions 269 280321,055 311,237Group2012 2011S$’000S$’000Cost of sales 1,571 1,200Administrative expenses – 331Other expense (net) (1,458) (487)113 1,044Actual return in value of plan assets 25,509 18,134Principal actuarial assumptionsThe main financial assumptions used by the independent qualified actuaries to calculate the liabilities under FRS 19 wereas follows:Group2012 2011% %Discount rate at December 31 4.4 4.7Expected return on plan assets at December 31 4.9 – 5.6 5.3 – 5.7Future rate of annual salary increases 3.3 3.3Future rate of pension increases 2.0 – 3.6 2.1 – 3.6Past service cost and net actuarial results are amortised over the estimated service life of the employees under planbenefits. The estimated service life for pension plans is 11 to 12 years (2011: 9 to 12 years).Assumptions regarding future mortality are based on published statistics and mortality tables. The expected remaininglife expectancy of an individual retiring at age 65 is 22 (2011: 22) for male and 24 (2011: 24) for female.The overall expected long-term rate of return on assets is 4.9% to 5.6% (2011: 5.3% to 5.7%). The expected rate ofreturn on plan assets is a weighted average of the individual expected rate of return on each asset class.216 Powering the Future <strong>Sembcorp</strong> Industries Annual Report 2012 217
Notes to the Financial StatementsNotes to the Financial Statements24. Retirement Benefit Obligations (cont’d)b. Defined Benefit Obligations (cont’d)Principal actuarial assumptions (cont’d)The history of existing plans as of December 31 is as follows:Group2012 2011 2010 2009 2008S$’000 S$’000 S$’000 S$’000 S$’000Present value of funded definedbenefit obligations 339,934 327,785 318,015 209,474 151,053Fair value of plan assets (321,055) (311,237) (307,617) (187,686) (158,761)Deficit / (surplus) in scheme 18,879 16,548 10,398 21,788 (7,708)25. Interest-bearing BorrowingsGroupCompany2012 2011 2012 2011Note S$’000 S$’000 S$’000 S$’000Current liabilitiesSecured term loans (a) 44,747 40,822 – –Unsecured term loans (b) 66,240 142,596 – –Finance lease liabilities (c) 4,074 2,655 100 94115,061 186,073 100 94Non-current liabilitiesSecured term loans (a) 1,018,212 987,868 – –Unsecured term loans (b) 1,167,986 861,384 – –Finance lease liabilities (c) 18,587 7,113 54 1562,204,785 1,856,365 54 1562,319,846 2,042,438 154 250Effective interest rates and maturity of liabilities (excluding finance lease liabilities)GroupCompany2012 2011 2012 2011% % % %Floating rate loans 0.59 – 7.30 1.05 – 8.29 – –Fixed rate loans 1.63 – 12.61 1.57 – 13.08 – –Bonds & notes 1.14 – 5.00 0.46 – 5.00 – –GroupCompany2012 2011 2012 2011S$’000 S$’000 S$’000 S$’000Within 1 year 110,987 183,418 – –After 1 year but within 5 years 939,873 618,388 – –After 5 years 1,246,325 1,230,864 – –Total borrowings 2,297,185 2,032,670 – –25. Interest-bearing Borrowings (cont’d)a. Secured Term LoansThe secured term loans are collaterised by the following assets:GroupNet Book Value2012 2011Note S$’000 S$’000Property, plant and equipment 3(i) 1,075,575 1,248,707Investment property 4 – 9,211Net assets of a subsidiary 162,871 157,7141,238,446 1,415,632b. Unsecured Term LoansIncluded in the unsecured term loans are the following medium term notes of the Group:A wholly-owned subsidiary of the Company, <strong>Sembcorp</strong> Financial Services Pte Ltd (SFS), has a S$1.5 billion MulticurrencyMulti-Issuer Debt Issuance Programme (the “Programme”), pursuant to which, the Company, together with SFS andcertain other subsidiaries of the Company (the “Issuing Subsidiaries”), may from time to time issue debt under theProgramme subject to availability of funds from the market. The obligations of the Issuing Subsidiaries under the notesare fully guaranteed by the Company.SFS has issued the following notes under the Programme:PrincipalNominal Year of Year of amountinterest rate issue maturity S$’000S$ medium term notes 5.00% 2009 2014 200,000S$ medium term notes 3.7325% 2010 2020 300,000S$ medium term notes 4.25% 2010 2025 100,000S$ medium term notes 6 month SOR + 0.55% 2010 2017 100,000700,000In 2012 and 2011, no new medium term notes were issued.A subsidiary, <strong>Sembcorp</strong> Marine Ltd (SCM) has a S$2 billion Multicurrency Multi-Issuer Debt Issuance Programme (the“Programme”) pursuant to which SCM, together with its subsidiaries, Jurong Shipyard Pte Ltd, Sembawang ShipyardPte Ltd and SMOE Pte Ltd (the “Issuing SCM Subsidiaries”), may from time to time issue the notes, subject to availabilityof funds from the market. The obligations of Issuing SCM Subsidiaries under the notes are fully guaranteed by SCM.Under the Programme, SCM or any of the Issuing SCM Subsidiaries may from time to time issue notes in series ortranches in Singapore Dollars or any other currency. Such notes are listed on the Singapore Exchange Securities TradingLimited and are cleared through the Central Depository (Pte) Ltd. The notes are redeemable at par.As at December 31, 2012 and 2011, there were no outstanding notes issued by SCM or any of the Issuing SCMsubsidiaries.218 Powering the Future <strong>Sembcorp</strong> Industries Annual Report 2012 219
Notes to the Financial StatementsNotes to the Financial Statements25. Interest-bearing Borrowings (cont’d)c. Finance Lease LiabilitiesThe Group has obligations under finance leases that are payable as follows:2012 201126. Other Long-term Liabilities (cont’d)a. Deferred income relates mainly to:i. advance payments received from customers in respect of connection and capacity charges for the supply and deliveryof gas and utilities; andPayments Interest Principal Payments Interest PrincipalS$’000 S$’000 S$’000 S$’000 S$’000 S$’000ii.the difference between the fair value of the construction services provided and the fair value of the financial assetreceivable.GroupWithin 1 year 4,829 755 4,074 2,699 44 2,655After 1 year butwithin 5 years 12,015 1,575 10,440 7,150 37 7,113After 5 years 8,885 738 8,147 – – –Total 25,729 3,068 22,661 9,849 81 9,768Under the terms of the lease agreements, no contingent rents are payable. The interest rates range from 0.51% to6.09% (2011: 0.51% to 6.09%) per annum.The Company has obligations under finance leases that are payable as follows:2012 2011Payments Interest Principal Payments Interest PrincipalS$’000 S$’000 S$’000 S$’000 S$’000 S$’000CompanyWithin 1 year 107 7 100 107 13 94After 1 year butwithin 5 years 55 1 54 164 8 156Total 162 8 154 271 21 250Under the terms of the lease agreements, no contingent rents are payable. The effective interest rate is 6.09% (2011:6.09%) per annum.26. Other Long-term LiabilitiesGroupCompany2012 2011 2012 2011Note S$’000 S$’000 S$’000 S$’000Deferred income (a) 168,370 162,607 10,431 9,262Deferred grants (b) 5,112 4,461 – –Other long-term payables (c) 53,971 21,638 – –Amounts due to related parties 21 7,733 139,592 309,500 644,700235,186 328,298 319,931 653,962b. Deferred grants relate to government grants for capital assets.c. Other long-term payables relate primarily to retention monies of subsidiaries, lease payables and deposits / advancesfrom customers.27. Share CapitalGroup and CompanyNo. of ordinary shares2012 2011Issued and fully paid, with no par value:At the beginning of the year 1,787,547,732 1,788,981,732Cancellation of shares – (1,434,000)At the end of the year 1,787,547,732 1,787,547,732a. The holders of ordinary shares are entitled to receive dividends as declared from time to time and are entitled to one voteper share at meetings of the Company. All shares rank equally with regard to the Company’s residual assets.b. Movements of the share capital account during the year are set out in the Consolidated Statement of Changes in Equity.28. Other ReservesGroupCompany2012 2011 2012 2011Note S$’000 S$’000 S$’000 S$’000DistributableReserve for own shares (a) (8,163) (18,455) (8,163) (18,455)Non-distributableCurrency translation reserve (b) (331,720) (229,340) – –Capital reserve (c) 338,337 334,585 (69,005) (50,012)Merger reserve (d) 29,201 29,201 – –Share-based payments reserve (e) (5,794) (3,088) 71,267 58,583Fair value reserve (f) 33,550 15,894 – –Hedging reserve (g) (157,733) (175,119) (147) –(102,322) (46,322) (6,048) (9,884)a. Reserve for Own SharesAt December 31, 2012, the Company held 1,606,279 (2011: 3,929,773) of its own uncancelled shares as treasury shares.220 Powering the Future <strong>Sembcorp</strong> Industries Annual Report 2012 221
Notes to the Financial StatementsNotes to the Financial Statements28. Other Reserves (cont’d)b. Currency Translation ReserveThe currency translation reserve comprises:i. foreign exchange differences arising from the translation of the financial statements of foreign operations whosefunctional currencies are different from the presentation currency of the Group;ii.exchange differences on monetary items which form part of the Group’s net investment in foreign operations; andiii. gains or losses on instruments used to hedge the Company’s net investment in foreign operations that are determinedto be effective hedges.c. Capital reserve comprises acquisitions and disposals with non-controlling interests that do not result in a change of control,capitalisation of accumulated profits for the issue of bonus shares, capital reserve (net of goodwill) on consolidationand equity accounting, capital redemption reserve, convertible loan stock reserve and transfer from revenue reserve inaccordance with the regulations of the foreign jurisdiction in which the Group’s subsidiaries, associates and joint venturesoperate, and treasury shares of a subsidiary.d. Merger reserve represents the difference between the value of shares issued by the Company in exchange for the valueof shares acquired in respect of the acquisition of subsidiaries accounted for under the pooling-of-interest method.e. Share-based payments reserve comprises the cumulative value of services received from employees recorded on grantof equity-settled share options, performance shares and performance based restricted shares. The expense for servicereceived is recognised over the performance period and / or vesting period.f. Fair value reserve includes the cumulative net change in the fair value of available-for-sale investments until theinvestments are derecognised.g. Hedging reserve comprises the effective portion of the cumulative net change in the fair value of cash flow hedginginstruments related to hedged transactions that have not yet occurred.29. Other Comprehensive IncomeTax effects relating to each component of other comprehensive income:GroupGroup2012 2011Before tax Tax expense Net of tax Before tax Tax expense Net of taxS$’000 S$’000 S$’000 S$’000 S$’000 S$’000Foreign currencytranslation differencesfor foreign operations (131,501) – (131,501) 13,192 – 13,192Exchange differences onmonetary items formingpart of net investmentin a foreign operation (506) – (506) (223) – (223)Share of other comprehensiveincome of associatesand joint ventures 662 – 662 (5,869) – (5,869)Cash flow hedges:net movement inhedging reserves(Note (a)) 36,868 (8,183) 28,685 (164,731) 23,019 (141,712)Available-for-sale financial assets:net movement infair value reserve(Note (b)) 22,498 (378) 22,120 (156,177) 23,957 (132,220)Other comprehensiveincome (71,979) (8,561) (80,540) (313,808) 46,976 (266,832)Group2012 2011S$’000S$’000a. Cash flow hedges:Net change in fair value of hedging instruments 44,757 (131,658)Amount transferred to profit or loss (7,889) (33,073)Tax (8,183) 23,019Net movement in the hedging reserve during the year recognisedin other comprehensive income 28,685 (141,712)b. Available-for-sale financial assets:Changes in fair value 22,498 (156,177)Tax (378) 23,957Net change in fair value during the year recognised in other comprehensive income 22,120 (132,220)222 Powering the Future <strong>Sembcorp</strong> Industries Annual Report 2012 223
Notes to the Financial StatementsNotes to the Financial Statements30. TurnoverGroup2012 2011S$’000S$’00032. Tax ExpenseGroup2012 2011S$’000S$’000Sale of gas, water, electricity and related services 5,387,723 4,771,780Ship and rig repair, building, conversion and related services 4,393,109 3,921,807Construction and engineering related activities 94,126 152,519Service concession revenue 100,223 87,475Others 213,877 113,48510,189,058 9,047,06631. Finance Income and Finance CostsGroup2012 2011Finance income– associates and joint ventures 1,402 1,345– bank and others 27,150 63,22328,552 64,568Finance costsInterest paid and payable to:– banks and others 119,224 60,977Amortisation of capitalised transaction costs and transactions costs written off 9,867 4,793Interest rate swap– fair value through profit or loss – (101)– ineffectiveness of cash flow hedge (767) (1)– termination of interest rate swap 11,673 –139,997 65,668S$’000S$’000Current tax expenseCurrent year 147,385 185,798Over provided in prior years (48,703) (70,472)98,682 115,326Deferred tax expenseMovements in temporary differences 37,685 18,451(Over) / under provided in prior years (6,089) 1,609Changes in tax rates (8,580) (10,617)23,016 9,443Tax expense 121,698 124,769Reconciliation of effective tax rateProfit for the year 1,033,058 1,145,810Total tax expense 121,698 124,769Share of results of associates and joint ventures (163,251) (170,573)Profit before share of results of associates and joint ventures, and tax expense 991,505 1,100,006Tax using Singapore tax rate of 17% 168,556 187,001Effect of changes in tax rates (8,580) (10,617)Effect of different tax rates in foreign jurisdictions (2,505) 5,092Tax incentives and income not subject to tax (18,405) (11,384)Expenses not deductible for tax purposes 29,230 22,742Utilisation of deferred tax benefits not previously recognised (942) (1,091)Over provided in prior years * (54,792) (68,863)Deferred tax benefits not recognised 6,893 4,547Others 2,243 (2,658)Tax expense 121,698 124,769* In 2012, a subsidiary of the Company wrote back S$41,317,000 of tax provision relating to prior year’s gain on disposal of equity investments. In 2011, asubsidiary of the Company had been allowed tax deduction of its losses from foreign exchange transactions for tax purposes for the Years of Assessment2008 and 2009. Accordingly, the Group reversed the tax provision of S$54,392,000 which had been provided for in 2007 and 2008.224 Powering the Future <strong>Sembcorp</strong> Industries Annual Report 2012 225
Notes to the Financial StatementsNotes to the Financial Statements33. Profit For The YearThe following items have been included in arriving at profit for the year:Group2012 2011Note S$’000 S$’000a. ExpensesAllowance made for impairment losses– property, plant and equipment 3 14,944 15,149– associate – 99– joint ventures – 921– interests in other investments 150 82– receivables 1,987 1,567– inventory obsolescence 3,829 8,074– intangible assets 12 5 5Amortisation of intangible assets 12 14,354 11,473Audit fees paid / payable– auditors of the Company 1,439 1,215– overseas affiliates of the auditors of the Company 1,286 1,205– other auditors 343 270Non-audit fees paid / payable– auditors of the Company 902 329– overseas affiliates of the auditors of the Company 68 81– other auditors 1,192 318Depreciation– property, plant and equipment 3 266,233 222,419– investment properties 4 1,033 924Professional fee paid to directors or a firm in which a director is a member 3 294Operating lease expenses 33,756 28,529Property, plant and equipment written off 2,666 1,643Intangible assets written off 12 2 23Bad debts (written back) / written off (2,663) 18133. Profit For The Year (cont’d)Group2012 2011b. Other incomeGrants received– income related 1,124 2,491Gross dividend income 3,623 4,650c. Other expenses (net)Net exchange loss (23,018) (6,569)Net change in fair value of derivative instruments 1,149 (7,280)Gain / (loss) on disposal of– property, plant and equipment 329 980– intangible assets 82 –– investment properties 7,858 822– subsidiaries 38 (63)– associates 96 –– other investments and financial assets 46 355– assets held for sale – 16334. Earnings Per ShareS$’000S$’000Group2012 2011S$’000S$’000a. Basic earnings per shareBasic earnings per share is based on:i. Profit attributable to owners of the Company 753,283 809,282No. of shares No. of shares‘000 ‘000Staff costsStaff costs 800,224 753,527Included in staff costs are:Equity-settled share-based payments 29,746 26,559Cash-settled share-based payments 9,733 6,761Contributions to:– defined benefit plan 1,571 1,530– defined contribution plan 41,815 36,063ii.Weighted average number of ordinary shares:Issued ordinary shares at beginning of the year 1,783,618 1,787,750Effect of share options exercised, performance shares and restricted shares released 3,507 3,192Effect of own shares held (791) (4,739)Effect of shares cancelled – (532)Weighted average number of ordinary shares at the end of the year 1,786,334 1,785,671226 Powering the Future <strong>Sembcorp</strong> Industries Annual Report 2012 227
Notes to the Financial StatementsNotes to the Financial Statements34. Earnings Per Share (cont’d)Group2012 2011S$’000S$’000b. Diluted earnings per shareDiluted earnings per share is based on:i. Profit attributable to owners of the Company 753,283 809,282The weighted average number of ordinary shares adjusted for the unissued ordinary shares under the Share Option Planwas arrived at as follows:ii.No. of shares No. of shares‘000 ‘000Weighted average number of shares issued used in the calculationof basic earnings per share 1,786,334 1,785,671Weighted average number of unissued ordinary shares from:– share options 2,278 3,277– performance shares 3,515 3,642– restricted shares 9,241 8,296Number of shares that would have been issued at fair value (969) (1,501)Weighted average number of ordinary shares 1,800,399 1,799,385For the purpose of calculating diluted earnings per ordinary share, the weighted average number of ordinary sharesoutstanding is adjusted for the effects of all dilutive potential ordinary shares. The Company has three categories of dilutivepotential ordinary shares: share options, performance shares and restricted shares.For share options, the weighted average number of ordinary shares in issue is adjusted to take into account the dilutive effectarising from the exercise of all outstanding share options granted to employees where such shares would be issued at a pricelower than the fair value (average share price during the year). The difference between the weighted average number ofshares to be issued at the exercise prices under the options and the weighted average number of shares that would have beenissued at the fair value based on assumed proceeds from the issue of these shares are treated as ordinary shares issued for noconsideration. The number of such shares issued for no consideration is added to the number of ordinary shares outstandingin the computation of diluted earnings per share. No adjustment is made to the profit attributable to owners of the Company.For performance shares and restricted shares, the weighted average number of ordinary shares in issue is adjusted as if alldilutive performance shares and restricted shares are released. No adjustment is made to the profit attributable to ownersof the Company.35. DividendsSubject to the approval by the shareholders at the next Annual General Meeting, the directors have proposed a final ordinaryone-tier tax exempt dividend of 15.0 cents per share (2011: one-tier tax exempt dividend of 17.0 cents comprising a finalordinary one-tier tax exempt dividend of 15.0 cents per share and a final bonus one-tier tax exempt dividend of 2.0 centsper share) amounting to an estimated net dividend of S$267,891,000 (2011: S$303,215,000) in respect of the year endedDecember 31, 2012, based on the number of issued shares as at December 31, 2012.The proposed dividend of 15.0 (2011: 17.0) cents per share has not been included as a liability in the financial statements.36. Share-based Incentive PlansThe Company’s Performance Share Plan (SCI PSP 2010) and Restricted Share Plan (SCI RSP 2010) (collectively, the “2010Share Plans”) were approved and adopted by the shareholders at an Extraordinary General Meeting of the Company held onApril 22, 2010. The 2010 Share Plans replaced the Share Plans which were approved and adopted by the shareholders at anExtraordinary General Meeting of the Company held on June 5, 2000 and expired in 2010.The Executive Resource & Compensation Committee (the “Committee”) of the Company has been designated as theCommittee responsible for the administration of the Share Plans. The Committee comprises the following members, all ofwhom are directors:Ang Kong Hua (Chairman)Goh Geok LingMargaret LuiThe SCI RSP 2010 is the incentive scheme for directors and employees of the Group whereas SCI PSP 2010 is aimed primarilyat key executives of the Group.The 2010 Share Plans are intended to increase the Company’s flexibility and effectiveness in its continuing efforts to attract,retain and incentivise participants to higher standards of performance and encourage greater dedication and loyalty byenabling the Company to give recognition to past contributions and services; as well as motivating participants to contributeto the long-term prosperity of the Group. The 2010 Share Plans will strengthen the Company’s competitiveness in attractingand retaining talented key senior management and senior executives.The SCI RSP 2010 is intended to apply to a broad base of senior executives as well as to the non-executive directors, whilethe SCI PSP 2010 is intended to apply to a select group of key senior management. Generally, it is envisaged that the rangeof performance targets to be set under the SCI RSP 2010 and the SCI PSP 2010 will be different, with the latter emphasisingstretched or strategic targets aimed at sustaining longer term growth.The 2010 Share Plans will provide incentives to high performing key senior management and senior executives to excelin their performance and encourage greater dedication and loyalty to the Company. Through the 2010 Share Plans, theCompany will be able to motivate key senior management and senior executives to continue to strive for the Group’s longtermshareholder value. In addition, the 2010 Share Plans aim to foster a greater ownership culture within the Group whichalign the interests of participants with the interests of shareholders, and to improve performance and achieve sustainablegrowth for the Company in the changing business environment.The 2010 Share Plans use methods fairly common among major local and multinational companies to incentivise and motivatekey senior management and senior executives to achieve pre-determined targets which create and enhance economic valuefor shareholders. The Company believes that the 2010 Share Plans will be effective tools in motivating key senior managementand senior executives to strive to deliver long-term shareholder value.228 Powering the Future <strong>Sembcorp</strong> Industries Annual Report 2012 229
Notes to the Financial StatementsNotes to the Financial Statements36. Share-based Incentive Plans (cont’d)While the 2010 Share Plans cater principally to Group executives, it is recognised that there are other persons who canmake significant contributions to the Group through their close working relationship with the Group. Such persons includeemployees of associated companies over which the Company has operational control.A participant’s awards under the 2010 Share Plans will be determined at the sole discretion of the Committee. In consideringan award to be granted to a participant, the Committee may take into account, inter alia, the participant’s performanceduring the relevant period, and his capability, entrepreneurship, scope of responsibility and skill set.Other information regarding the 2010 Share Plans and expired Share Plans is as follows:a. Share Option PlanUnder the rules of the Share Option Plan, participants who ceased to be employed by the Group or the associatedcompany by reason of ill health, injury or disability, redundancy, retirement at or after the legal retirement age, retirementbefore the legal retirement age, death, etc., or any other event approved by the Committee, may be allowed by theCommittee to retain their unexercised options. The Committee may determine the number of shares comprised in thatoption which may be exercised and the period during which such option shall be exercisable, being a period not later thanthe expiry of the exercise period in respect of that option. Such option may be exercised at any time notwithstanding thatthe date of exercise of such option falls on a date prior to the first day of the exercise period in respect of such option.Other information regarding the Share Option Plan is as follows:i. The exercise price of the options can be set at market price or a discount to the market price not exceeding 20% ofthe market price in respect of options granted at the time of grant. Market price is the volume-weighted averageprice for the shares on the Singapore Exchange Securities Trading Limited (SGX-ST) over the three consecutivetrading days prior to grant date of that option. For all options granted to date, the exercise prices are set at marketprice.ii.After the first 12 months of lock-out period, the Group imposed a further vesting of 4 years for managers and abovefor retention purposes.iii. In 2012 and 2011, all options were settled by the issuance of treasury shares.iv. The options granted expire after 5 years for non-executive directors and associated company’s employees, and 10years for the employees of the Group. There are no outstanding share options for non-executive directors.36. Share-based Incentive Plans (cont’d)a. Share Option Plan (cont’d)At the end of the year, details of the options granted under the Share Option Plan on unissued ordinary shares of theCompany are as follows:<strong>Sembcorp</strong> Industries LtdOrdinary shares2012Options Options Options Options OptionsExercise outstanding cancelled / outstanding exercisable exercisableDate of grant price at Options lapsed / at at atof options per share Jan 1, 2012 exercised not accepted Dec 31, 2012 Jan 1, 2012 Dec 31, 2012 Exercise period07/05/2002 S$1.23 157,250 (126,500) (30,750) – 157,250 – 08/05/2003 to 07/05/201217/10/2002 S$0.62 52,500 (26,500) (26,000) – 52,500 – 18/10/2003 to 17/10/201202/06/2003 S$0.78 31,000 (7,000) – 24,000 31,000 24,000 03/06/2004 to 02/06/201318/11/2003 S$0.93 72,000 (39,500) – 32,500 72,000 32,500 19/11/2004 to 18/11/201317/05/2004 S$0.99 174,250 (72,000) – 102,250 174,250 102,250 18/05/2005 to 17/05/201422/11/2004 S$1.16 178,625 (77,500) – 101,125 178,625 101,125 23/11/2005 to 22/11/201401/07/2005 S$2.37 383,650 (120,625) – 263,025 383,650 263,025 02/07/2006 to 01/07/201521/11/2005 S$2.36 646,000 (133,875) – 512,125 646,000 512,125 22/11/2006 to 21/11/201509/06/2006 S$2.52 1,190,664 (201,865) – 988,799 1,190,664 988,799 10/06/2007 to 09/06/20162,885,939 (805,365) (56,750) 2,023,824 2,885,939 2,023,824<strong>Sembcorp</strong> Industries LtdOrdinary shares2011Options Options Options Options OptionsExercise outstanding cancelled / outstanding exercisable exercisableDate of grant price at Options lapsed / at at atof options per share Jan 1, 2011 exercised not accepted Dec 31, 2011 Jan 1, 2011 Dec 31, 2011 Exercise period19/04/2001 S$1.19 111,100 (81,100) (30,000) – 111,100 – 20/04/2002 to 19/04/201107/05/2002 S$1.23 160,750 (3,500) – 157,250 160,750 157,250 08/05/2003 to 07/05/201217/10/2002 S$0.62 87,000 (34,500) – 52,500 87,000 52,500 18/10/2003 to 17/10/201202/06/2003 S$0.78 97,600 (65,475) (1,125) 31,000 97,600 31,000 03/06/2004 to 02/06/201318/11/2003 S$0.93 111,375 (37,375) (2,000) 72,000 111,375 72,000 19/11/2004 to 18/11/201317/05/2004 S$0.99 206,750 (29,000) (3,500) 174,250 206,750 174,250 18/05/2005 to 17/05/201422/11/2004 S$1.16 225,000 (44,250) (2,125) 178,625 225,000 178,625 23/11/2005 to 22/11/201401/07/2005 S$2.37 792,700 (391,175) (17,875) 383,650 792,700 383,650 02/07/2006 to 01/07/201521/11/2005 S$2.36 891,474 (222,349) (23,125) 646,000 891,474 646,000 22/11/2006 to 21/11/201509/06/2006 S$2.52 175,000 (175,000) – – 175,000 – 10/06/2007 to 09/06/201109/06/2006 S$2.52 1,735,790 (519,376) (25,750) 1,190,664 1,735,790 1,190,664 10/06/2007 to 09/06/20164,594,539 (1,603,100) (105,500) 2,885,939 4,594,539 2,885,939230 Powering the Future <strong>Sembcorp</strong> Industries Annual Report 2012 231
Notes to the Financial StatementsNotes to the Financial Statements36. Share-based Incentive Plans (cont’d)a. Share Option Plan (cont’d)At the end of the financial year, details of the options granted under the Share Option Plan on unissued ordinary sharesof <strong>Sembcorp</strong> Marine Ltd are as follows:<strong>Sembcorp</strong> Marine LtdOrdinary shares2012Options Options Options Options OptionsExercise outstanding cancelled / outstanding exercisable exercisableDate of grant price at Options lapsed / at at atof options per share Jan 1, 2012 exercised not accepted Dec 31, 2012 Jan 1, 2012 Dec 31, 2012 Exercise period07/11/2002 S$0.64 125,650 (11,900) (113,750) – 125,650 – 08/11/2003 to 07/11/201208/08/2003 S$0.71 73,420 (3,000) – 70,420 73,420 70,420 09/08/2004 to 08/08/201310/08/2004 S$0.74 241,010 (47,400) (4,200) 189,410 241,010 189,410 11/08/2005 to 10/08/201411/08/2005 S$2.11 1,503,750 (551,450) (4,200) 948,100 1,503,750 948,100 12/08/2006 to 11/08/201502/10/2006 S$2.38 1,856,482 (525,830) (22,325) 1,308,327 1,856,482 1,308,327 03/10/2007 to 02/10/20163,800,312 (1,139,580) (144,475) 2,516,257 3,800,312 2,516,257<strong>Sembcorp</strong> Marine LtdOrdinary shares2011Options Options Options Options OptionsExercise outstanding cancelled / outstanding exercisable exercisableDate of grant price at Options lapsed / at at atof options per share Jan 1, 2011 exercised not accepted Dec 31, 2011 Jan 1, 2011 Dec 31, 2011 Exercise period27/09/2001 S$0.47 54,810 (21,210) (33,600) – 54,810 – 28/09/2002 to 27/09/201107/11/2002 S$0.64 161,700 (31,500) (4,550) 125,650 161,700 125,650 08/11/2003 to 07/11/201208/08/2003 S$0.71 216,470 (132,200) (10,850) 73,420 216,470 73,420 09/08/2004 to 08/08/201310/08/2004 S$0.74 1,723,958 (1,427,648) (55,300) 241,010 1,723,958 241,010 11/08/2005 to 10/08/201411/08/2005 S$2.11 4,213,877 (2,617,027) (93,100) 1,503,750 4,213,877 1,503,750 12/08/2006 to 11/08/201502/10/2006 S$2.38 191,750 (191,750) – – 191,750 – 03/10/2007 to 02/10/2011 *02/10/2006 S$2.38 4,918,409 (3,046,002) (15,925) 1,856,482 4,918,409 1,856,482 03/10/2007 to 02/10/201611,480,974 (7,467,337) (213,325) 3,800,312 11,480,974 3,800,312* Applicable to non-executive directors of the Company only.36. Share-based Incentive Plans (cont’d)a. Share Option Plan (cont’d)Except as disclosed above, there were no unissued shares of the Company or its subsidiaries under options granted bythe Company or its subsidiaries as at the end of the financial year.<strong>Sembcorp</strong> Industries Ltd’s options exercised in 2012 and 2011 were all settled by way of issuance of treasury shares.<strong>Sembcorp</strong> Industries Ltd’s options were exercised on a regular basis throughout the year. The weighted average shareprice during the year was S$5.24 (2011: S$4.65).<strong>Sembcorp</strong> Marine Ltd’s options exercised in 2012 resulted in 1,139,580 (2011: 7,467,337) ordinary shares being issuedat a weighted average price of S$2.16 (2011: S$1.93). <strong>Sembcorp</strong> Marine Ltd’s options were exercised on a regular basisthroughout the year. The weighted average share price during the year was S$4.78 (2011: S$3.84).Fair value of share optionsThe fair value of services received is measured by reference to the fair value of share options granted.b. Performance Share PlanUnder the Performance Share Plan (SCI PSP 2010), the awards granted conditional on performance targets are set basedon medium-term corporate objectives at the start of each rolling three-year performance qualifying period. A specificnumber of performance shares shall be awarded at the end of the three-year performance cycle depending on the extentof the achievement of the performance conditions established at the onset.The performance levels were calibrated based on Wealth Added and Total Shareholder Return. A minimum thresholdperformance must be achieved to trigger an achievement factor, which in turn determines the number of shares to befinally awarded. Performance shares to be delivered will range between 0% to 150% of the conditional performanceshares awarded.To create alignment between senior management and other employees at the time of vesting, SCI PSP 2010 has in placea plan trigger. Under this trigger mechanism, the performance shares for the performance period 2012 to 2014 will bevested to the senior management participants only if the restricted shares for the performance period 2013 to 2014 arevested, subject to the achievement of the performance conditions for the respective performance periods.Senior management participants are required to hold a minimum percentage of the shares released to them under thePerformance Share Plan to maintain a beneficial ownership stake in the Group, for the duration of their employmentor tenure with the Group. A maximum cap is set based on a multiple of the individual participant’s annual base salary.Any excess can be sold off, but in the event of a shortfall, they have a two calendar year period to meet the minimumpercentage requirement.232 Powering the Future <strong>Sembcorp</strong> Industries Annual Report 2012 233
Notes to the Financial StatementsNotes to the Financial Statements36. Share-based Incentive Plans (cont’d)b. Performance Share Plan (cont’d)i. <strong>Sembcorp</strong> Industries Ltd Performance SharesThe details of the movement of the performance shares of <strong>Sembcorp</strong> Industries Ltd awarded during the year are asfollows:2012 2011At January 1 2,633,333 2,611,665Conditional performance shares awarded 1,272,500 820,000Conditional performance shares lapsed – (205,832)Conditional performance shares released (1,357,500) (592,500)At December 31 2,548,333 2,633,33336. Share-based Incentive Plans (cont’d)b. Performance Share Plan (cont’d)Fair value of performance sharesThe fair values of the performance shares are estimated using a Monte Carlo simulation methodology at the grant dates.The fair values of performance shares granted during the year are as follows:Fair value Fair value Fair value Fair valueof <strong>Sembcorp</strong> of <strong>Sembcorp</strong> of <strong>Sembcorp</strong> of <strong>Sembcorp</strong>Industries Ltd Industries Ltd Marine Ltd Marine Ltdperformance performance performance performanceshares granted shares granted shares granted shares grantedon May 2, 2012 on April 29, 2011 on May 21, 2012 on July 15, 2011ii.With the Committee’s approval on the achievement factor for the achievement of the performance targets for theperformance period 2009 to 2011 (2011: performance period 2008 to 2010), a total of 1,357,500 (2011: 592,500)performance shares were released via the issuance of treasury shares.The total number of performance shares in awards granted conditionally and representing 100% of targets to beachieved, but not released as at end 2012, was 2,548,333 (2011: 2,633,333). Based on the multiplying factor, theactual release of the awards could range from zero to a maximum of 3,822,500 (2011: 3,950,000) performanceshares.Performance shares of a listed subsidiaryThe details of the movement of the performance shares of <strong>Sembcorp</strong> Marine Ltd awarded during the year are asfollows:2012 2011At January 1 1,765,000 1,970,000Conditional performance shares awarded 675,000 585,000Conditional performance shares lapsed (93,610) (242,916)Additional performance shares awarded arising from targets met 240,694 385,000Conditional performance shares released (722,084) (932,084)At December 31 1,865,000 1,765,000Fair value at measurement date S$4.35 S$3.44 S$3.76 S$3.40Assumptions under the Monte Carlo modelShare price S$5.16 S$5.40 S$4.48 S$5.28Expected volatility:<strong>Sembcorp</strong> Industries Ltd / <strong>Sembcorp</strong> Marine Ltd 28.0% 33.4% 27.9% 29.8%Morgan Stanley Capital International (MSCI)AC Asia Pacific excluding Japan Industrials Index 25.9% 38.1% 21.8% 24.1%Correlation with MSCI 85.5% 85.8% 84.3% 85.1%Risk-free interest rate 0.3% 0.5% 0.5% 0.4%Expected dividend 3.5% 3.4% 4.5% 2.9%The expected volatility is based on the historical volatility over the most recent period that is close to the expected life ofthe performance shares.During the year, the Group charged S$5,224,000 (2011: S$4,579,000) to the profit or loss based on the fair value of theperformance shares at the grant date being expensed over the vesting period.No performance shares of <strong>Sembcorp</strong> Marine Ltd were awarded to the directors of the Company.With the <strong>Sembcorp</strong> Marine Ltd’s committee’s approval on the achievement factor for the achievement of theperformance targets for the performance period 2009 to 2011 (2011: performance period 2008 to 2010), a total of722,084 (2011: 932,084) performance shares were released via the issuance of treasury shares.In 2012, there were additional 240,694 (2011: 385,000) performance shares awarded for over-achievement of theperformance targets for the performance period 2009 to 2011 (2011: performance period 2008 to 2010).The total number of performance shares in awards granted conditionally and representing 100% of targets to beachieved, but not released as at December 31, 2012, was 1,865,000 (2011: 1,765,000). Based on the multiplyingfactor, the actual release of the awards could range from zero to a maximum of 2,797,500 (2011: 2,647,500)performance shares.234 Powering the Future <strong>Sembcorp</strong> Industries Annual Report 2012 235
Notes to the Financial StatementsNotes to the Financial Statements36. Share-based Incentive Plans (cont’d)c. Restricted Share PlanUnder the Restricted Share Plan (SCI RSP 2010), the awards granted conditional on performance targets are set based oncorporate objectives at the start of each rolling two-year performance qualifying period. The performance criteria for therestricted shares are calibrated based on Return on Total Assets (excluding <strong>Sembcorp</strong> Marine Ltd) and Group Profit fromOperations (excluding <strong>Sembcorp</strong> Marine Ltd) for awards granted in 2012.A minimum threshold performance must be achieved to trigger an achievement factor, which in turn determines thenumber of shares to be finally awarded. Based on the criteria, restricted shares to be delivered will range from 0% to150% of the conditional restricted shares awarded.The managerial participants of the Group will be awarded restricted shares under SCI RSP 2010, while the non-managerialparticipants of the Group will receive their awards in an equivalent cash value. This cash-settled notional restricted sharesaward for non-managerial participants is known as the <strong>Sembcorp</strong> Challenge Bonus.A specific number of restricted shares shall be awarded at the end of the two-year performance cycle depending onthe extent of the achievement of the performance conditions established at the onset. There is a further vesting periodof three years after the performance period, during which one-third of the awarded shares are released each year tomanagerial participants. Non-managerial participants will receive the equivalent in cash at the end of the two-yearperformance cycle, with no further vesting conditions.Senior management participants are required to hold a minimum percentage of the shares released to them under theRestricted Share Plan to maintain a beneficial ownership stake in the Group, for the duration of their employment ortenure with the Group. A maximum cap is set based on a multiple of the individual participant’s annual base salary.Any excess can be sold off, but in the event of a shortfall, they have a two calendar year period to meet the minimumpercentage requirement.To align the interests of the non-executive directors with the interests of shareholders, up to 30% of the aggregatedirectors’ fees approved by shareholders for a particular financial year may be paid out in the form of restricted sharesawards under the SCI RSP 2010.From 2011, non-executive directors were not awarded any shares except as part of their directors’ fees (except for MrTang Kin Fei, who is the Group President & CEO, and who does not receive any directors’ fees). In 2012, the awardsgranted consisted of the grant of fully paid shares outright with no performance and vesting conditions attached, butwith a selling moratorium. Non-executive directors are required to hold shares (including shares obtained by othermeans) worth at least one-time the annual base retainer; any excess may be sold as desired. A non-executive director candispose of all of his shares one year after leaving the Board.The actual number of shares awarded to each non-executive director was determined by reference to the volumeweightedaverage price of a share on the SGX-ST over the 14 trading days immediately following the date of the AnnualGeneral Meeting (AGM). The number of shares to be awarded was rounded down to the nearest hundred and anyresidual balance was settled in cash.36. Share-based Incentive Plans (cont’d)c. Restricted Share Plan (cont’d)i. <strong>Sembcorp</strong> Industries Ltd Restricted SharesThe details of the movement of the restricted shares of <strong>Sembcorp</strong> Industries Ltd awarded during the year are asfollows:2012 2011At January 1 6,170,329 5,515,446Conditional restricted shares awarded 2,454,400 2,305,800Conditional restricted shares lapsed (148,307) (267,668)Additional restricted shares awarded arising from targets met 419,370 399,560Conditional restricted shares released (2,187,355) (1,782,809)At December 31 6,708,437 6,170,329With the Committee’s approval on the achievement factor for the achievement of the performance targets for theperformance period 2010 to 2011, a total of 863,127 restricted shares were released in 2012. For awards in relationto the performance period 2009 to 2010, a total of 737,169 (2011: 872,309) were released in 2012. For awards inrelation to the performance period 2008 to 2009, a total of 495,035 (2011: 548,312) restricted shares were releasedin 2012. For awards in relation to the performance period 2007 to 2008, a total of 398 (2011: 279,488) restrictedshares were released in 2012. In 2012, there were 76,900 (2011: 82,700) shares released to non-executive directors.In 2012, there were additional 14,726 shares released to employees upon retirement or death in service. Of therestricted shares released, 14,726 (2011: 35,490) restricted shares were cash-settled. The remaining restricted shareswere released via the issuance of treasury shares.In 2012, additional 419,370 (2011: 399,560) restricted shares were awarded for the over-achievement of theperformance targets for the performance period 2010 to 2011 (2011: performance period 2009 to 2010).The total number of restricted shares outstanding, including award(s) achieved but not released, as at end 2012,was 6,708,437 (2011: 6,170,329). Of this, the total number of restricted shares in awards granted conditionallyand representing 100% of targets to be achieved, but not released was 4,565,100 (2011: 4,244,200). Based on themultiplying factor, the actual release of the conditional awards could range from zero to a maximum of 6,847,650(2011: 6,366,300) restricted shares.<strong>Sembcorp</strong> Challenge BonusWith the Committee’s approval on the achievement factor for the achievement of the performance targets for theperformance period 2010 to 2011 (2011: performance period 2009 to 2010), a total of S$3,458,548, equivalentto 580,274 (2011: S$2,661,000, equivalent to 494,042) notional restricted shares, were paid. A total of 400,000(2011: 600,000) notional restricted shares of <strong>Sembcorp</strong> Industries Ltd’s shares were awarded in 2012 for the<strong>Sembcorp</strong> Challenge Bonus.The total number of notional restricted shares in awards for the <strong>Sembcorp</strong> Challenge Bonus granted conditionally andrepresenting 100% of targets to be achieved, but not released as at end 2012, was 1,000,000 (2011: 1,200,000).Based on the multiplying factor, the number of notional restricted shares to be converted into the funding pool couldrange from zero to a maximum of 1,500,000 (2011: 1,800,000).236 Powering the Future <strong>Sembcorp</strong> Industries Annual Report 2012 237
Notes to the Financial StatementsNotes to the Financial Statements36. Share-based Incentive Plans (cont’d)c. Restricted Share Plan (cont’d)ii. Restricted shares of a listed subsidiaryThe details of the movement of the restricted shares of <strong>Sembcorp</strong> Marine Ltd awarded during the year are as follows:2012 2011At January 1 10,150,285 11,380,303Conditional restricted shares awarded 2,864,700 3,085,800Conditional restricted shares lapsed (523,398) (914,752)Additional restricted shares awarded arising from targets met 1,466,001 1,641,205Conditional restricted shares released (4,414,058) (5,042,271)At December 31 9,543,530 10,150,285With the <strong>Sembcorp</strong> Marine Ltd’s committee’s approval on the achievement factor for the achievement of theperformance targets for the performance period 2010 to 2011, a total of 1,709,403 restricted shares were releasedin 2012. For awards in relation to the performance period 2009 to 2010, a total of 1,434,630 (2011: 1,888,581)restricted shares were released in 2012. For awards in relation to the performance period 2008 to 2009, a total of1,185,425 (2011: 1,531,500) restricted shares were released in 2012. In 2011, 1,502,177 restricted shares werereleased for awards in relation to the performance period 2007 to 2008; and 16,413 restricted shares were releasedfor awards in relation to the performance period 2006 to 2007. In 2012, there were 84,600 (2011: 103,600)restricted shares released to non-executive directors. The restricted shares were either released via the issuance oftreasury shares or the issuance of new shares.In 2012, additional 1,466,001 (2011: 1,641,205) <strong>Sembcorp</strong> Marine Ltd’s restricted shares were awarded for theover-achievement of the performance targets for the performance period 2010 to 2011 (2011: performance period2009 to 2010).The total number of <strong>Sembcorp</strong> Marine Ltd’s restricted shares outstanding, including awards achieved but notreleased, as at December 31, 2012, was 9,543,530 (2011: 10,150,285). Of this, the total number of restricted sharesin awards granted conditionally and representing 100% of targets to be achieved, but not released was 5,688,200(2011: 6,242,400). Based on the multiplying factor, the actual release of the awards could range from zero to amaximum of 8,532,300 (2011: 9,363,600) restricted shares.36. Share-based Incentive Plans (cont’d)c. Restricted Share Plan (cont’d)Fair value of restricted sharesThe fair values of the restricted shares are estimated using a Monte Carlo simulation methodology at the grant dates.The fair values of restricted shares granted during the year are as follows:Fair value Fair value Fair value Fair valueof <strong>Sembcorp</strong> of <strong>Sembcorp</strong> of <strong>Sembcorp</strong> of <strong>Sembcorp</strong>Industries Ltd Industries Ltd Marine Ltd Marine Ltdrestricted restricted restricted restrictedshares granted shares granted shares granted shares grantedon May 2, 2012 on April 29, 2011 on May 21, 2012 on July 15, 2011Fair value at measurement date S$4.61 S$3.94 S$3.92 S$4.36Assumptions under the Monte Carlo modelShare price S$5.16 S$5.40 S$4.48 S$5.28Expected volatility:<strong>Sembcorp</strong> Industries Ltd / <strong>Sembcorp</strong> Marine Ltd 28.0% 33.4% 27.9% 29.8%Risk-free interest rate 0.2% – 0.4% 0.4% – 0.7% 0.5% – 0.8% 0.3% – 0.5%Expected dividend 3.5% 3.4% 4.5% 2.9%The expected volatility is based on the historical volatility over the most recent period that is close to the expected lifeof the restricted shares.During the year, the Group charged S$24,522,000 (2011: S$21,980,000) to the profit or loss based on the fair value ofrestricted shares at the grant date being expensed over the vesting period.Fair value of <strong>Sembcorp</strong> Challenge BonusDuring the year, the Group charged S$9,733,000 (2011: S$6,761,000) to the profit or loss based on the market valuesof the shares at the balance sheet date. The fair value of the compensation cost is based on the notional number ofrestricted shares awarded for <strong>Sembcorp</strong> Challenge Bonus and the market price at the vesting date.Challenge Bonus of a listed subsidiaryWith the <strong>Sembcorp</strong> Marine Ltd’s committee’s approval on the achievement factor for the achievement of theperformance targets for the performance period 2010 to 2011 (2011: performance period 2009 to 2010), a total ofS$8,163,619 (2011: S$7,336,725), equivalent to 1,533,650 (2011: 1,373,250) notional restricted shares, were paid.A total of 1,031,300 (2011: 1,122,200) notional restricted shares were awarded on May 21, 2012 (2011: July 15,2011) for the <strong>Sembcorp</strong> Marine Challenge Bonus.The total number of notional restricted shares in awards for the <strong>Sembcorp</strong> Marine Challenge Bonus grantedconditionally and representing 100% of targets to be achieved, but not released as at December 31, 2012, was1,974,400 (2011: 2,167,200). Based on the multiplying factor, the number of notional restricted shares to beconverted into the funding pool could range from zero to a maximum of 2,961,600 (2011: 3,250,800).238 Powering the Future <strong>Sembcorp</strong> Industries Annual Report 2012 239
Notes to the Financial StatementsNotes to the Financial Statements37. Acquisition of subsidiaryOn September 25, 2012, our subsidiary, <strong>Sembcorp</strong> Marine Ltd (SCM) through its wholly-owned subsidiary, SMOE Pte Ltd(SMOE) acquired from Smulders Group the entire share capital in its wholly-owned subsidiary, SLP Engineering Limited (SLP),for a consideration of £1.On September 27, 2012, SLP, based in Lowestoft Suffolk, United Kingdom (UK), was renamed Sembmarine SLP Limited andwas held through newly incorporated company Sembmarine North Sea Limited (SNS). SNS is 70% owned by SMOE and 30%owned by eight members of the SLP Management team.39. Related Parties (cont’d)Group (cont’d)b. Compensation of key management personnelThe Group considers the directors of the Company (including the Group President & CEO of the Company), the President& CEO of <strong>Sembcorp</strong> Marine Ltd, the Executive Vice President of ASEAN and Singapore (Utilities), the Executive Chairmanof <strong>Sembcorp</strong> Development Ltd, the Group Chief Financial Officer and the Executive Vice President of Group BusinessDevelopment and Commercial to be key management personnel in accordance with FRS 24 Related Party Disclosures.These persons have the authority and responsibility for planning, directing and controlling the activities of the Group.The principal activity of SLP is that of design, engineering, fabrication and installation of platforms, modules and structuresfor the oil and gas industry. This acquisition was strategic to the Group as the Group will now have a footprint in the UK,providing synergistic support and reach out to its North Sea clientele. SLP offers the opportunity for future growth in newbusiness areas within the renewable energy sector as well as in the fabrication of minimum facilities platform for marginal oiland gas fields in the North Sea and Asia Pacific waters.The key management personnel compensation is as follows:Group2012 2011S$’000S$’00038. Non-controlling InterestsOn May 15, 2010, our subsidiary, <strong>Sembcorp</strong> Marine Ltd (SCM) commenced proceedings in the High Court of Singaporeagainst PPL Holdings Pte Ltd and its wholly owned subsidiary, E-Interface Holdings Limited for various reliefs, including thetransfer of the remaining 15 per cent of the shares in PPL Shipyard Pte Ltd (PPLS) to SCM.On May 30, 2012, the High Court released its judgement together with the Grounds of Decision. The decision was notfavourable to SCM. On June 29, 2012, SCM filed an appeal to the Court of Appeal which was heard on November 8, 2012and judgement was reserved. Pending the outcome of the appeal, the Group will continue to consolidate its 85 per centinterest in PPLS and separately account for the 15 per cent as “non-controlling interest”.39. Related PartiesGroupa. Related party transactionsThe Group had the following significant transactions with related parties during the year:Group2012 2011S$’000S$’000Related CorporationsSales 20,860 77,644Purchases including rental 64,930 52,836Payment on behalf 11,198 7,602Purchase of investment and property, plant and equipment 2,150 3,141Sale of investment property and property, plant and equipment 8,503 –Rental income 78 –Directors’ fees and remuneration 6,333 6,191Other key management personnel remuneration 11,013 10,58017,346 16,771Fair value of share-based compensation 5,185 4,425Remuneration includes salary (which includes allowances, fees and other emoluments) and bonus (which includes AWS,discretionary bonus and performance targets bonus).In addition to the above, the Company provides medical benefits to all employees including key management personnel.The Group adopts an incentive compensation plan, which is tied to the creation of Economic Value Added (EVA), aswell as to attainment of individual and Group performance goals for its key executives. A “bonus bank” is used to holdincentive compensation credited in any year. Typically, one-third of the available balance is paid out in cash each year,with the balance being carried forward to the following year. The balances of the bonus bank in future will be adjustedby the yearly EVA performance of the Group and its subsidiaries and the payouts made from the bonus bank.The fair value of share-based compensation relates to performance shares and restricted shares granted that werecharged to the profit or loss.Associates and Joint VenturesSales 92,627 41,288Purchases including rental 21,143 13,569Rental income 891 –Payment on behalf 216 3,627240 Powering the Future <strong>Sembcorp</strong> Industries Annual Report 2012 241
Notes to the Financial StatementsNotes to the Financial Statements40. Financial InstrumentsFinancial risk management objectives and policiesThe Group’s activities expose it to market risk (including interest rate risk, foreign currency risk and price risk), credit risk andliquidity risk.As part of the Group’s Enterprise Risk Management framework, Group treasury policies and financial authority limits aredocumented and reviewed periodically. The policies set out the parameters for management of Group liquidity, counterpartyrisk, foreign exchange and derivative transactions and financing.The Group utilises foreign exchange contracts, foreign exchange swaps, interest rate swaps, interest rate options, contractsfor difference and various financial instruments to manage exposures to interest rate, foreign exchange and commodity pricerisks arising from operating, financing and investment activities. Exposures to foreign currency risks are also hedged naturallyby a matching sale or purchase of a matching asset or liability of the same currency and amount where possible. All suchtransactions must involve underlying assets or liabilities and no speculative transactions are allowed.The financial authority limits seek to limit and mitigate transactional risks by setting out the threshold of approvals requiredfor the entry into contractual obligations and investments.a. Market riskMarket risk is the risk that changes in market prices, such as interest rates, foreign exchange rates and prices will affectthe Group’s income or the value of its holdings of financial instruments. The objective of market risk management is tomanage and reduce market risk exposures within acceptable parameters.i. Interest rate riskThe Group’s exposure to market risk for changes in interest rate environment relates mainly to its fixed deposits anddebt obligations.40. Financial Instruments (cont’d)a. Market risk (cont’d)i. Interest rate risk (cont’d)Sensitivity analysisIt is estimated that 100 basis points (bp) change in interest rate at the reporting date would increase / (decrease)equity and profit before tax by the following amounts. This analysis assumes that all other variables, in particularforeign currency rates, remain constant.Profit before taxEquity100 bp 100 bp 100 bp 100 bpIncrease Decrease Increase DecreaseS$’000 S$’000 S$’000 S$’000GroupDecember 31, 2012Variable rate financial instruments 16,536 (16,536) 63,404 (63,404)December 31, 2011Variable rate financial instruments 12,157 (12,157) 75,297 (75,297)CompanyDecember 31, 2012Variable rate financial instruments 2,823 (2,823) – –December 31, 2011Variable rate financial instruments 4,020 (4,020) – –The Group’s policy is to maintain an efficient and optimal interest cost structure using a mix of fixed and variable ratedebts and long-term and short-term borrowings.The Group enters into interest rate swaps to reduce its exposure to interest rate volatility. In accordance with theGroup’s policy, the duration of such interest rate swaps must not exceed the tenor of the underlying debt.At December 31, 2012, the Group had interest rate swaps with an aggregate notional amount of S$1,101,865,000(2011: S$1,254,000,000), of which S$955,445,000 (2011: S$1,254,000,000) was designated as cash flow hedges.The Group receives a variable interest rate and pays a fixed rate interest ranging from 2.74% to 4.35% (2011:2.74% to 4.35%) per annum on the notional amount.242 Powering the Future <strong>Sembcorp</strong> Industries Annual Report 2012 243
Notes to the Financial StatementsNotes to the Financial Statements40. Financial Instruments (cont’d)a. Market risk (cont’d)ii. Foreign currency riskThe Group operates globally and is exposed to foreign currency exchange rate volatility primarily for Singapore dollar(SGD), United States dollar (USD), euros (EURO) and pounds sterling (GBP) on sales and purchases of assets andliabilities, which arise from the daily course of operations. Such risks are hedged either by forward foreign exchangecontracts in respect of actual or forecasted currency exposures which are reasonably certain or hedged naturally bya matching sale or purchase of a matching asset or liability of the same currency and amount.The Group’s gross exposure to foreign currencies is as follows:SGD USD EURO GBP OthersS$’000 S$’000 S$’000 S$’000 S$’000Group2012Financial assetsCash and cash equivalents 81,672 284,467 51,573 9,668 8,439Trade and other receivables 13,786 747,718 16,186 138,432 60,727Other financial assets – 3,004 – – 35,73095,458 1,035,189 67,759 148,100 104,896Financial liabilitiesTrade and other payables 143,697 556,113 88,846 11,858 72,454Interest-bearing borrowings – 136,195 – – 8,26514,3697 692,308 88,846 11,858 80,719Net financial (liabilities) / assets (48,239) 342,881 (21,087) 136,242 24,177Less: Foreign exchange contract – (315,661) – (140,788) 4,013Net currency exposure offinancial (liabilities) / assets (48,239) (27,220) (21,087) (4,546) 28,190Cash flow hedges forfuture dated transactionsForeign exchange forward contracts 83,851 (1,133,920) 22,873 – 4,818Foreign exchange swap agreements – (29,623) 54,310 – 84,157Fuel oil swap contracts – 243,962 – – –83,851 (919,581) 77,183 – 88,97540. Financial Instruments (cont’d)a. Market risk (cont’d)ii. Foreign currency risk (cont’d)SGD USD EURO GBP OthersS$’000 S$’000 S$’000 S$’000 S$’0002011Financial assetsCash and cash equivalents 68,474 691,729 124,347 1,450 19,503Trade and other receivables 21,839 487,908 13,618 74,584 1,094Other financial assets – – – – 28,88490,313 1,179,637 137,965 76,034 49,481Financial liabilitiesTrade and other payables 175,872 336,470 54,451 2,444 25,802Interest-bearing borrowings – 314,649 – – 10,597175,872 651,119 54,451 2,444 36,399Net financial (liabilities) / assets (85,559) 528,518 83,514 73,590 13,082Less: Foreign exchange contract – – – (74,477) –Net currency exposure offinancial (liabilities) / assets (85,559) 528,518 83,514 (887) 13,082Cash flow hedges forfuture dated transactionsForeign exchange forward contracts 289,478 (1,697,452) 139,757 – 29,035Foreign exchange swap agreements – 2,263 134,539 – –Fuel oil swap contracts – 201,517 – – –289,478 (1,493,672) 274,296 – 29,035The Company’s gross exposure to foreign currencies is as follows:USD EURO GBP OthersS$’000 S$’000 S$’000 S$’000Company2012Financial assetsCash and cash equivalents 12,965 – 7 –Trade and other receivables 37,035 – – –50,000 – 7 –Financial liabilitiesTrade and other payables 32,973 2,001 523 294Net financial assets / (liabilities) 17,027 (2,001) (516) (294)Cash flow hedges for future dated transactionsForeign exchange forward contracts – 8,783 – –244 Powering the Future <strong>Sembcorp</strong> Industries Annual Report 2012 245
Notes to the Financial StatementsNotes to the Financial Statements40. Financial Instruments (cont’d)a. Market risk (cont’d)ii. Foreign currency risk (cont’d)USD EURO GBP OthersS$’000 S$’000 S$’000 S$’000Company2011Financial assetsCash and cash equivalents 6,488 – 15 –Trade and other receivables 17,589 – – –24,077 – 15 –Financial liabilitiesTrade and other payables 22,279 17 – 39Net financial assets / (liabilities) 1,798 (17) 15 (39)Sensitivity analysisA 10% strengthening of the following currencies against the functional currencies of the Company and itssubsidiaries at the balance sheet date would have increased / (decreased) equity and profit before tax by the amountsshown below. The analysis assumes that all other variables, in particular interest rates, remain constant. The analysisis performed on the same basis for 2011.GroupCompanyProfitProfitEquity before tax Equity before taxS$’000 S$’000 S$’000 S$’0002012SGD 3,131 (429) – –USD (60,767) (4,753) – 1,702EURO 4,538 (191) 713 (200)GBP – (455) – (52)Others 10,252 (779) – (29)2011SGD 9,232 9,370 – –USD (114,020) 40,047 – 180EURO 11,536 19,384 – (2)GBP – (37) – 2Others 4,806 (1,579) – (4)A 10% weakening of the above currencies against the functional currencies of the Company and its subsidiaries atthe balance sheet date would have had the equal but opposite effect on the above currencies to the amounts shownabove, on the basis that all other variables remain constant.40. Financial Instruments (cont’d)a. Market risk (cont’d)iii. Price riskEquity securities price riskThe Group is exposed to equity securities price risk because of the investments held by the Group which are classifiedon the consolidated balance sheet either as available-for-sale or at fair value through profit or loss.Sensitivity analysisIf prices for equity securities increase by 10% with all other variables held constant, the increase in equity and profitbefore tax will be:Group2012 2011S$’000S$’000Equity 15,532 13,291Profit before tax 4,504 2A 10% decrease in the underlying equity prices would have had the equal but opposite effect to the amounts shownabove. The analysis is performed on the same basis for 2011 and assumes that all other variables remain constant.Commodity riskThe Group hedges against fluctuations in commodity prices that affect revenue and cost. Exposures are managed viaswaps, options, contracts for differences, fixed price and forward contracts.Contracts for differences are entered into with a counterparty at a strike price, with or without fixing the quantityupfront, to hedge against adverse price movements on the sale of electricity. Naphtha swaps are entered into forfixed quantity to hedge revenue indexed to naphtha. Exposure to price fluctuations arising on the purchase of fuel ismanaged via fuel oil swaps where the price of fuel is indexed to a benchmark fuel price index, for example SingaporeHigh Sulphur Fuel Oil 180 CST fuel oil.Sensitivity analysisIf prices for commodities increase by 10% with all other variables held constant, the increase in equity as a result offair value changes on cash flow hedges will be:Group2012 2011S$’000S$’000Equity 22,801 19,989A 10% decrease in the prices for commodities would have had the equal but opposite effect to the amounts shownabove. The analysis is performed on the same basis for 2011 and assumes that all other variables remain constant.246 Powering the Future <strong>Sembcorp</strong> Industries Annual Report 2012 247
Notes to the Financial StatementsNotes to the Financial Statements40. Financial Instruments (cont’d)a. Market risk (cont’d)iii. Price risk (cont’d)Notional amountAt the balance sheet date, the Group had financial instruments with the following notional contract amounts:Group2012 2011Notional Notionalamount amountS$’000S$’000Fuel oil swap agreements 270,083 238,594b. Credit riskThe Group monitors its exposure to credit risks arising from sales to trade customers on an on-going basis, and creditevaluations are done on customers that require credit. The credit quality of customers is assessed after taking intoaccount its financial position and past experience with the customers.The Group only deals with pre-approved customers and financial institutions with good credit rating. To minimise theGroup’s counterparty risk, the Group enters into derivative transactions only with creditworthy institutions. Cash andfixed deposits are placed in banks and financial institutions with good credit rating.As the Group and the Company does not hold any collateral, the maximum exposure to credit risk is the carrying amountof each financial asset, including derivative financial instruments, in the balance sheet.The Group’s and the Company’s maximum exposure to credit risk for loans and receivables at the balance sheet date isas follows:GroupCompany2012 2011 2012 2011Note S$’000 S$’000 S$’000 S$’000By business activityUtilities 922,838 804,942 125,086 95,000Marine 494,899 518,780 – –Urban Development 42,795 7,864 – –Others 18,748 25,629 – –1,479,280 1,357,215 125,086 95,000Loans and receivablesNon-current 8 366,594 340,893 – –Current 15 1,112,686 1,016,322 125,086 95,0001,479,280 1,357,215 125,086 95,00040. Financial Instruments (cont’d)b. Credit risk (cont’d)The age analysis of current trade and other receivables is as follows:Gross Impairment Gross Impairment2012 2012 2011 2011S$’000 S$’000 S$’000 S$’000GroupNot past due 933,313 333 843,378 303Past due 0 to 3 months 103,638 1,375 122,004 1,389Past due 3 to 6 months 21,059 2,417 18,083 1,762Past due 6 to 12 months 25,412 7,246 11,185 2,488More than 1 year 35,471 20,172 31,960 18,1431,118,893 31,543 1,026,610 24,085CompanyNot past due 111,924 5 87,022 –Past due 0 to 3 months 4,211 12 7,001 –Past due 3 to 6 months 2,674 12 437 –Past due 6 to 12 months 4,705 36 295 –More than 1 year 163 110 319 74123,677 175 95,074 74Movements in the allowance for impairment of current and non-current trade and other receivables are as follows:GroupCompany2012 2011 2012 2011S$’000 S$’000 S$’000 S$’000Balance at beginning of the year 39,541 46,268 74 408Currency translation difference (807) (588) – –Allowance made 9,727 4,648 101 –Allowance utilised (7,926) (7,706) – (203)Allowance written back (7,740) (3,081) – (131)Balance at end of the year 32,795 39,541 175 74The allowance account in respect of trade and other receivables is used to record impairment losses unless the Group issatisfied that no recovery of the amount owing is possible. At that point, the financial asset is considered irrecoverableand the amount charged to the allowance account is written against the carrying amount of the impaired financial asset.248 Powering the Future <strong>Sembcorp</strong> Industries Annual Report 2012 249
Notes to the Financial StatementsNotes to the Financial Statements40. Financial Instruments (cont’d)c. Liquidity riskThe Group manages its liquidity risk with the view to maintaining a healthy level of cash and cash equivalents appropriateto the operating environment and expected cash flows of the Group. Liquidity requirements are maintained within thecredit facilities established and are adequate and available to the Group to meet its obligations.The table below analyses the maturity profile of the Group’s and the Company’s financial liabilities (including derivativefinancial liabilities) based on expected contractual undiscounted cash inflows / (outflows), including interest paymentsand excluding the impact of netting agreements:Cash FlowsCarrying Contractual Less than Between Overamount cash flow 1 year 1 and 5 years 5 yearsS$’000 S$’000 S$’000 S$’000 S$’000Group2012DerivativesDerivative financial liabilities 177,706– inflow 589,194 545,422 43,772 –– outflow (769,151) (584,202) (159,113) (25,836)Derivative financial assets (62,166)– inflow 1,951,341 1,308,015 643,326 –– outflow (1,889,175) (1,266,506) (622,669) –Non-derivative financial liabilitiesTrade and other payables * 2,833,072 (2,854,684) (2,794,796) (26,570) (33,318)Interest-bearing borrowings 2,319,846 (2,858,472) (181,815) (1,193,460) (1,483,197)5,268,458 (5,830,947) (2,973,882) (1,314,714) (1,542,351)* Excludes advance payments from customers, deferred income, deferred grants, Goods and Services Tax and share of net liability of an associate.Cash FlowsCarrying Contractual Less than Between Overamount cash flow 1 year 1 and 5 years 5 yearsS$’000 S$’000 S$’000 S$’000 S$’000Group2011DerivativesDerivative financial liabilities 209,834– inflow 1,605,522 814,957 790,565 –– outflow (1,840,274) (865,488) (928,199) (46,587)Derivative financial assets (28,901)– inflow 1,786,887 1,726,862 57,505 2,520– outflow (1,748,449) (1,709,047) (39,402) –40. Financial Instruments (cont’d)c. Liquidity risk (cont’d)Cash FlowsCarrying Contractual Less than Between Overamount cash flow 1 year 1 and 5 years 5 yearsS$’000 S$’000 S$’000 S$’000 S$’000Company2012Trade and other payables * 879,851 (927,083) (590,409) (227,979) (108,695)Interest-bearing borrowings 154 (161) (106) (55) –880,005 (927,244) (590,515) (228,034) (108,695)2011Trade and other payables * 823,774 (890,718) (198,979) (579,222) (112,517)Interest-bearing borrowings 250 (269) (106) (163) –824,024 (890,987) (199,085) (579,385) (112,517)* Excludes advance payments from customers, deferred income, deferred grants, Goods and Services Tax and share of net liability of an associate.The following table indicates the periods in which the cash flow associated with derivatives that are cash flow hedgesare expected to impact the profit or loss.Cash FlowsCarrying Contractual Less than Between Overamount cash flow 1 year 1 and 5 years 5 yearsS$’000 S$’000 S$’000 S$’000 S$’000Group2012Derivative financial liabilities 175,577– inflow 336,260 292,488 43,772 –– outflow (514,068) (329,119) (159,113) (25,836)Derivative financial assets (59,190)– inflow 1,651,235 1,007,909 643,326 –– outflow (1,592,045) (969,376) (622,669) –(116,387) (118,618) 1,902 (94,684) (25,836)2011Derivative financial liabilities 193,996– inflow 1,262,951 472,386 790,565 –– outflow (1,472,328) (517,280) (910,981) (44,067)Derivative financial assets (13,245)– inflow 1,430,964 1,390,677 40,287 –– outflow (1,417,719) (1,378,317) (39,402) –180,751 (196,132) (32,534) (119,531) (44,067)Non-derivative financial liabilitiesTrade and other payables * 2,822,113 (2,707,130) (2,535,025) (148,813) (23,292)Interest-bearing borrowings 2,042,438 (2,703,184) (253,792) (862,048) (1,587,344)5,045,484 (5,606,628) (2,821,533) (1,130,392) (1,654,703)250 Powering the Future <strong>Sembcorp</strong> Industries Annual Report 2012 251
Notes to the Financial StatementsNotes to the Financial Statements40. Financial Instruments (cont’d)c. Liquidity risk (cont’d)Cash FlowsCarrying Contractual Less than Between Overamount cash flow 1 year 1 and 5 years 5 yearsS$’000 S$’000 S$’000 S$’000 S$’000Company2012Derivative financial liabilities– inflow 177 8,606 8,606 – –– outflow – (8,783) (8,783) – –177 (177) (177) – –2011Derivative financial liabilities– inflow – – – – –– outflow – – – – –– – – – –d. Estimation of fair valuesFRS 107 establishes a fair value hierarchy that prioritises the inputs used to measure fair value. The three levels of the fairvalue input hierarchy defined by FRS 107 are as follows:• Level 1 – Fair values are measured based on quoted prices (unadjusted) from active markets for identical financialinstruments.• Level 2 – Fair values are measured using inputs, other than those used for Level 1, that are observable for thefinancial instruments either directly (prices) or indirectly (derived from prices).• Level 3 – Fair values are measured using inputs which are not based on observable market data (unobservable input).SecuritiesThe fair value of financial assets at fair value through profit or loss, and available-for-sale financial assets, is based onquoted market prices (bid price) at the balance sheet date without any deduction for transaction costs. If the marketfor a quoted financial asset is not active, and for unquoted financial assets, the Group establishes fair value by usingvaluation techniques.40. Financial Instruments (cont’d)d. Estimation of fair values (cont’d)DerivativesThe fair value of forward exchange contracts is accounted for based on the difference between the contractual price andthe current market price.The fair value of interest rate swaps, based on current interest rates curves, is the indicative amount that the Company isexpected to receive or pay to terminate the swap with the swap counterparties at the balance sheet date.The fair value of fuel oil swaps contracts is accounted for based on the difference between the contractual strike pricewith the counterparty and the current market price.Contracts for Differences are accounted for based on the difference between the contracted price entered into withthe counterparty and the reference price. The fair value of Contracts for Differences cannot be reliably measured asthe financial instrument does not have quoted market prices in an active market. The gains and losses for Contracts forDifferences are taken to the profit or loss upon settlement.Non-derivative financial liabilitiesFair values are calculated based on discounted expected future principal and interest cash flows at the market rate ofinterest at the reporting date. For finance leases, the market rate of interest is determined by reference to similar leaseagreements.Other financial assets and liabilitiesThe carrying amounts of financial assets and liabilities with a maturity of less than one year (including trade and otherreceivables, cash and cash equivalents, and trade and other payables) are assumed to approximate their fair valuesbecause of the short period to maturity. All other financial assets and liabilities are discounted to determine their fairvalues.For financial instruments that are not actively traded in the market, the fair value is determined by independent thirdparty or using valuation techniques where applicable. The Company may use a variety of methods and make assumptionsthat are based on existing market conditions at each balance sheet date. Quoted market prices or dealer quotes forsimilar instruments are used to estimate the fair value for medium term notes for disclosure purposes. Other techniques,such as estimated discounted cash flows, are used to determine fair value for the remaining financial instruments. Wherediscounted cash flow techniques are used, the management will estimate the future cash flows and use relevant marketrate as the discount rate at the balance sheet date.252 Powering the Future <strong>Sembcorp</strong> Industries Annual Report 2012 253
Notes to the Financial StatementsNotes to the Financial Statements40. Financial Instruments (cont’d)e. Fair value hierarchyThe following table sets forth by level within the fair value hierarchy of the financial assets and liabilities that wereaccounted for at fair value on a recurring basis as of December 31, 2012. These financial assets and liabilities areclassified in their entirety based on the lowest level of input that is significant to the fair value measurement. Theassessment of the significance of a particular input to the fair value measurement requires judgement, and may affectthe valuation of assets and liabilities and their placement within the fair value hierarchy levels.Fair value measurement using:Level 1 Level 2 Level 3 TotalS$’000 S$’000 S$’000 S$’000GroupAt December 31, 2012Available-for-sale financial assets 135,425 19,895 – 155,320Financial assets at fair value through profit or loss 8 – 45,036 45,044Derivative financial assets – 62,166 – 62,166135,433 82,061 45,036 262,530Derivative financial liabilities – (177,706) – (177,706)135,433 (95,645) 45,036 84,824At December 31, 2011Available-for-sale financial assets 126,514 6,314 – 132,828Financial assets at fair value through profit or loss 17 – – 17Derivative financial assets – 28,901 – 28,901126,531 35,215 – 161,746Derivative financial liabilities – (209,834) – (209,834)126,531 (174,619) – (48,088)CompanyAt December 31, 2012Derivative financial liabilities – (177) – (177)– (177) – (177)At December 31, 2011Derivative financial liabilities – – – –– – – –40. Financial Instruments (cont’d)e. Fair value hierarchy (cont’d)The following table shows a reconciliation from the beginning balances to the ending balances for fair value measurementsin Level 3 of the fair value hierarchy:Fair value throughprofit or loss$’000GroupAt January 1, 2012 –Acquisition 44,380Currency translation adjustments (1,057)Total gain recognised in profit or loss 1,713At December 31, 2012 45,036See Note 7 for details on the investment in equity shares designated at fair value through profit or loss.Although the Group believes that its estimates of fair value are appropriate, the use of different assumption could leadto different measurement of fair value.For fair value measurement in Level 3, changing one of the assumptions used to reasonably possible alternativeassumption would have the following effect:Profit or lossFavourable (Unfavourable)$’000 $’000GroupDecember 31, 2012Fair value through profit or loss 26,311 (14,475)The favourable and unfavourable effect of using reasonably possible alternative assumption has been calculated byrecalibrating the model using alternative estimates of expected cash flows that might reasonably have been consideredby a market participant for the purpose of pricing the instruments at the reporting date.The fair value of the investment in equity shares is calculated by using expected cash flows and risk-adjusted discount ratebased on weighted average cost of capital of the Group. Key input and assumption used in the model at December 31,2012 include coal prices used in the forecasts provided by management to derive the expected cash flows.254 Powering the Future <strong>Sembcorp</strong> Industries Annual Report 2012 255
Notes to the Financial StatementsNotes to the Financial Statements40. Financial Instruments (cont’d)f. Fair value versus carrying amountsThe fair values of financial assets and liabilities, together with the carrying amounts shown in the balance sheets are as follows:Other financial Other financialliabilities liabilitiesFair value – within the outside the TotalDesignated hedging Available Loans and scope of scope of carrying Fairat fair value instruments for sale receivables FRS 39 FRS 39 amount valueNote S$’000 S$’000 S$’000 S$’000 S$’000 S$’000 S$’000 S$’000GroupDecember 31, 2012Cash and cash equivalents 18 – – – 2,059,800 – – 2,059,800 2,059,800Trade receivables 9 – – – 577,123 – – 577,123 577,123Service concession receivables 8,15 – – – 255,416 – – 255,416 255,416Amounts due from related parties 11 – – – 200,779 – – 200,779 200,779Staff loans 8 – – – 83 – – 83 83Other receivables and deposits 16 – – – 438,927 – – 438,927 438,927Available-for-sale financial assets:– Equity shares 7 – – 151,277 – – – 151,277 151,277– Unit trusts and funds 7 – – 4,121 – – – 4,121 4,121Financial assets at fair value through profit or loss, on initial recognition– Forward foreign exchange contracts 7 853 – – – – – 853 853– Equity shares 7 45,044 – – – – – 45,044 45,044– Foreign exchange swap contracts 7 2,123 – – – – – 2,123 2,123Cash flow hedges:– Forward foreign exchange contracts 7 – 51,727 – – – – 51,727 51,727– Fuel oil swaps 7 – 7,463 – – – – 7,463 7,46348,020 59,190 155,398 3,532,128 – – 3,794,736 3,794,736Trade payables 19 – – – – 1,767,406 – 1,767,406 1,767,406Amounts due to related parties * 21 – – – – 133,985 – 133,985 133,985Other payables * – – – – 890,248 – 890,248 890,248Other long-term payables 26 – – – – 53,971 – 53,971 53,971Financial liabilities at fair value through profit or loss, on initial recognition– Forward foreign exchange contracts 23 6 – – – – – 6 6– Foreign exchange swap contracts 23 2,123 – – – – – 2,123 2,123Cash flow hedges:– Forward foreign exchange contracts 23 – 6,708 – – – – 6,708 6,708– Interest rate swaps 23 – 166,039 – – – – 166,039 166,039– Fuel oil swaps 23 – 2,830 – – – – 2,830 2,830Interest-bearing borrowings– Short-term borrowings 25 – – – – 110,987 – 110,987 110,987– Long-term borrowings 25 – – – – 2,186,198 – 2,186,198 2,220,946– Finance lease liabilities 25 – – – – – 22,661 22,661 22,6682,129 175,577 – – 5,142,795 22,661 5,343,162 5,377,917* Excludes advance payments from customers, deferred income, deferred grants, Goods and Services Tax and share of net liability of an associate.256 Powering the Future <strong>Sembcorp</strong> Industries Annual Report 2012 257
Notes to the Financial StatementsNotes to the Financial Statements40. Financial Instruments (cont’d)f. Fair value versus carrying amounts (cont’d)Other financial Other financialliabilities liabilitiesFair value – within the outside the TotalDesignated hedging Available Loans and scope of scope of carrying Fairat fair value instruments for sale receivables FRS 39 FRS 39 amount valueNote S$’000 S$’000 S$’000 S$’000 S$’000 S$’000 S$’000 S$’000GroupDecember 31, 2011Cash and cash equivalents 18 – – – 2,995,478 – – 2,995,478 2,995,478Trade receivables 9 – – – 543,958 – – 543,958 543,958Service concession receivables 8,15 – – – 264,124 – – 264,124 264,124Finance lease receivables 10 – – – 10,832 – – 10,832 10,832Amounts due from related parties 11 – – – 104,914 – – 104,914 104,914Staff loans 8 – – – 92 – – 92 92Other receivables and deposits 16 – – – 433,295 – – 433,295 433,295Available-for-sale financial assets:– Equity shares 7 – – 131,607 – – – 131,607 131,607– Unit trusts and funds 7 – – 1,300 – – – 1,300 1,300Financial assets at fair value through profit or loss, on initial recognition– Forward foreign exchange contracts 7 330 – – – – – 330 330– Equity shares 7 17 – – – – – 17 17– Interest rate swaps 7 11,412 – – – – – 11,412 11,412– Foreign exchange swap contracts 7 3,914 – – – – – 3,914 3,914Cash flow hedges:– Forward foreign exchange contracts 7 – 8,727 – – – – 8,727 8,727– Fuel oil swaps 7 – 4,518 – – – – 4,518 4,51815,673 13,245 132,907 4,352,693 – – 4,514,518 4,514,518Trade payables 19 – – – – 1,888,872 – 1,888,872 1,888,872Amounts due to related parties * 21 – – – – 146,249 – 146,249 146,249Other payables * – – – – 765,354 – 765,354 765,354Other long-term payables 26 – – – – 21,638 – 21,638 21,638Financial liabilities at fair value through profit or loss, on initial recognition– Interest rate swaps 23 11,412 – – – – – 11,412 11,412– Forward foreign exchange contracts 23 67 – – – – – 67 67– Foreign exchange swap contracts 23 4,359 – – – – – 4,359 4,359Cash flow hedges:– Forward foreign exchange contracts 23 – 22,440 – – – – 22,440 22,440– Interest rate swaps 23 – 169,274 – – – – 169,274 169,274– Fuel oil swaps 23 – 2,282 – – – – 2,282 2,282Interest-bearing borrowings– Short-term borrowings 25 – – – – 183,418 – 183,418 183,418– Long-term borrowings 25 – – – – 1,849,252 – 1,849,252 1,874,308– Finance lease liabilities 25 – – – – – 9,768 9,768 9,78715,838 193,996 – – 4,854,783 9,768 5,074,385 5,099,460* Excludes advance payments from customers, deferred income, deferred grants, Goods and Services Tax and share of net liability of an associate.258 Powering the Future <strong>Sembcorp</strong> Industries Annual Report 2012 259
Notes to the Financial StatementsNotes to the Financial Statements40. Financial Instruments (cont’d)f. Fair value versus carrying amounts (cont’d)Other financial Other financialliabilities liabilitiesFair value – within the outside the Totalhedging Loans and scope of scope of carrying Fairinstruments receivables FRS 39 FRS 39 amount valueNote S$’000 S$’000 S$’000 S$’000 S$’000 S$’000CompanyDecember 31, 2012Cash and cash equivalents 18 – 524,601 – – 524,601 524,601Trade receivables 9 – 30,779 – – 30,779 30,779Amounts due from related parties 11 – 18,247 – – 18,247 18,247Other receivables and deposits 16 – 76,060 – – 76,060 76,060– 649,687 – – 649,687 649,687Trade payables 19 – – 2,429 – 2,429 2,429Amounts due to related parties 21 – – 670,045 – 670,045 670,045Other payables * – – 207,377 – 207,377 207,377Interest-bearing borrowings– Finance lease liabilities 25 – – – 154 154 161Cash flow hedges– Forward foreign exchange contracts 23 177 – – – 177 177177 – 879,851 154 880,182 880,189December 31, 2011Cash and cash equivalents 18 – 629,074 – – 629,074 629,074Trade receivables 9 – 33,686 – – 33,686 33,686Amounts due from related parties 11 – 9,075 – – 9,075 9,075Other receivables and deposits 16 – 52,239 – – 52,239 52,239– 724,074 – – 724,074 724,074Trade payables 19 – – 2,872 – 2,872 2,872Amounts due to related parties 21 – – 695,920 – 695,920 695,920Other payables * – – 124,982 – 124,982 124,982Interest-bearing borrowings– Finance lease liabilities 25 – – – 250 250 269– – 823,774 250 824,024 824,043* Excludes advance payments from customers and Goods and Services Tax.260 Powering the Future <strong>Sembcorp</strong> Industries Annual Report 2012 261
Notes to the Financial StatementsNotes to the Financial Statements40. Financial Instruments (cont’d)g. Capital managementThe Group aims to maintain a sound capital base so as to maintain investor, creditor and market confidence and tosustain future development and growth of its businesses, while at the same time maintaining an appropriate dividendpolicy to reward shareholders. The Group monitors Economic Value Added attributable to shareholders, which theGroup defines as net operating profit after tax less capital charge excluding non-controlling interests. Management alsomonitors the level of dividends paid to ordinary shareholders.The Group seeks to maintain a balance between the higher returns that might be possible with higher levels of borrowingsand the advantages and security afforded by a sound capital position. Capital is defined as equity attributable to theequity holders. The Group records a net gearing ratio of 0.07 as at December 31, 2012 (2011: net cash position).There were no changes in the Group’s approach to capital management during the year.Neither the Company nor any of its subsidiaries are subject to externally imposed capital requirements.41. Contingent Liabilities (Unsecured)Group2012 2011S$’000S$’000Guarantees given to banks to secure banking facilities provided to:– Associates 27,643 28,713– Joint venture 559,203 595,323– Others 125,242 26,261Performance guarantees to external party 17,099 –Performance guarantees granted for contracts awarded to the Group 36,645 717a. A Wayleave Agreement was entered into between SembGas and the Government of Singapore with respect tocertain pipelines where SembGas would indemnify the Government of Singapore against all claims, actions, demands,proceedings, liabilities, damages, costs and expenses arising out of or in connection with any occurrence during the use,maintenance or operations of these pipelines. No such claim has arisen to date.b. A Power and Water Purchase Agreement (PWPA) was entered into between <strong>Sembcorp</strong> Salalah Power & Water CompanySAOC (SSPWC) and a Buyer to purchase power and water for a period of 15 years from the date of commercial operationsas defined in the PWPA. Around the same time, a Turnkey Engineering, Procurement and Construction Contract (EPC)was entered into with a Contractor for the construction of the power and desalination plant. Through the EPC, SSPWChas contracted out all risks of construction of the plant to the Contractor.41. Contingent Liabilities (Unsecured) (cont’d)Companya. The Company has provided guarantees to banks to secure banking facilities provided to a wholly-owned subsidiary,<strong>Sembcorp</strong> Financial Services Pte Ltd. These financial guarantee contracts are accounted for as insurance contracts.The principal risk to which the Company is exposed is credit risk in connection with guarantee contracts it has issued. Thecredit risk represents the loss that would be recognised upon a default by the parties to which the guarantees were givenon behalf of. To mitigate these risks, management continually monitors the risks and has established processes includingperforming credit evaluations of the parties it is providing the guarantee on behalf of.There are no terms and conditions attached to the guarantee contracts that would have a material effect on the amount,timing and uncertainty of the Company’s future cash flows.Estimates of the Company’s obligation arising from financial guarantee contracts may be affected by future events,which cannot be predicted with any certainty. The assumptions made may well vary from actual experience so that theactual liability may vary considerably from the best estimates. As of balance sheet date, there is no provision made inrespect of the obligations.Intra-group financial guarantees comprise guarantees granted by the Company to banks in respect of banking facilitiesamounting to S$2,889 million (2011: S$3,158 million), which includes S$855 million (2011: S$806 million) drawn downas at balance sheet date. The periods in which the financial guarantees expire are as follows:Company2012 2011S$’000S$’000Less than 1 year 23,560 106,218Between 1 to 5 years 506,440 200,000More than 5 years 690,000 1,020,0001,220,000 1,326,218b. The Company has provided corporate guarantees of S$83.2 million (2011: S$64.8 million) to a subsidiary, <strong>Sembcorp</strong>Cogen Pte Ltd (SembCogen) for the following:i. long-term contract (End User Agreement) dated January 15, 1999 with a fellow subsidiary, SembGas to purchasenatural gas over the period of 22 years.Under the End User Guarantee Agreement, the Company and one of its subsidiaries, <strong>Sembcorp</strong> Utilities Pte Ltd,issued corporate guarantees in favour of SembGas for 70% and 30% respectively of SembCogen’s obligations underthe End User Agreement.As a result of delays in achieving various phases of commencement dates for the plants, the Buyer had sought for claimson liquidated damages and compensation for revenue losses from SSPWC under the PWPA.Taking into consideration the PWPA and the EPC contractual terms, SSPWC is confident that the final settlement shouldat least result in a neutral position. In addition, SSPWC had received a bankers’ guarantee as performance bond from theContractor which is adequately sized to cover SSPWC’s potential liquidated damages payment to the Buyer when or ifany claim arises. These claims and disputes are expected to be settled in 2014.ii.two long-term agreements entered in 2010 for the purchase of a total 42 BBtud (Billion British thermal units perday) of liquefied natural gas (LNG) from BG Singapore Gas Marketing Pte Ltd (BG). The agreements have a termof 10 years and SembCogen has an option to extend the term by 2 successive periods of 5 years each subject tofulfilment of conditions set in the agreements. The obligations of SembCogen under the LNG purchase agreementsare currently secured by corporate guarantees issued by the Company in favour of BG.262 Powering the Future <strong>Sembcorp</strong> Industries Annual Report 2012 263
Notes to the Financial StatementsNotes to the Financial Statements42. CommitmentsCommitments not provided for in the financial statements are as follows:Group2012 2011S$’000S$’000Commitments in respect of contracts placed 476,618 855,814Uncalled capital and commitments to subscribe for additional sharesin joint ventures and other investments 306,881 261,225783,499 1,117,039At the balance sheet date, commitments in respect of payments for non-cancellable operating leases with a term of morethan one year are as follows:GroupCompany2012 2011 2012 2011S$’000 S$’000 S$’000 S$’000Lease payments due:Within 1 year 34,714 31,344 9,060 8,294Between 1 and 5 years 101,784 90,306 30,863 31,720After 5 years 390,730 372,749 64,704 54,153527,228 494,399 104,627 94,167On January 15, 1999, SembGas entered into a long-term Gas Sales Agreement to purchase 2,625,000 BBtu (Billion Britishthermal units) of natural gas over a period of 22 years. SembGas also entered into agreements with certain customers for theon-sale of this gas, which agreements incorporated provisions, which specifically deal with, inter alia, SembGas’ liability forshortfalls in deliveries of gas and relief from such liability in certain circumstances.43. Segment Reportinga. Operating SegmentsFor management purposes, the Group is organised into business units based on their products and services, and has fourreportable operating segments as follows:i. The Utilities segment’s principal activities are in the provision of energy, water, on-site logistics and solid wastemanagement to industrial and municipal customers. Key activities in the energy sector include power generation andretail, process steam production and supply, as well as natural gas import, supply and retail. In the water sector, thebusiness offers wastewater treatment as well as the production and supply of reclaimed, desalinated and potablewater and water for industrial use.ii.The Marine segment focuses principally on providing integrated solutions in the repair, building and conversion ofships and rigs, and offshore engineering and construction.iii. The Urban Development (formally known as Integrated Urban Development) segment owns, develops, markets andmanages integrated urban developments comprising industrial parks as well as business, commercial and residentialspace in Asia.iv. Others / Corporate segment comprises businesses mainly relating to minting, design and construction activities,offshore engineering and the corporate companies.Management monitors the operating results of its business units separately for the purpose of making decisionsabout resource allocation and performance assessment.The Group operates in seven principal geographical areas: Singapore, China, Rest of ASEAN, Australia & India,Middle East & Africa, UK, Rest of Europe and Other Countries. In presenting information on the basis of geographicalsegments, segment revenue is based on the geographical location of customers. Segment assets and total assets arebased on the geographical location of the assets.On April 15, 2008, SembGas entered into another agreement to import an additional tranche of 90 BBtu per day of naturalgas over a period of 15 years, with first delivery of gas taken place in 2011.In 2010, SembCogen entered into two long-term agreements to purchase liquefied natural gas (LNG), usage of LNG Terminaland other charges over a period of 10 years and has the option to extend the term by two successive periods of 5 years.The Group leases out its investment properties. Non-cancellable operating lease rentals are receivable as follows:Group2012 2011S$’000S$’000Lease receivable:Within 1 year 10,460 3,408Between 1 and 5 years 14,084 2,61224,544 6,020264 Powering the Future <strong>Sembcorp</strong> Industries Annual Report 2012 265
Notes to the Financial StatementsNotes to the Financial Statements43. Segment Reporting (cont’d)a. Operating Segments (cont’d)Urban Others /Utilities Marine Development Corporate Elimination TotalS$’000 S$’000 S$’000 S$’000 S$’000 S$’00043. Segment Reporting (cont’d)a. Operating Segments (cont’d)Urban Others /Utilities Marine Development Corporate Elimination TotalS$’000 S$’000 S$’000 S$’000 S$’000 S$’0002012TurnoverExternal sales 5,615,449 4,428,011 11,605 133,993 – 10,189,058Inter-segment sales 48,886 2,112 4,018 44,727 (99,743) –Total 5,664,335 4,430,123 15,623 178,720 (99,743) 10,189,058ResultsSegment results 534,666 554,773 6,271 7,240 – 1,102,950Finance income 5,776 21,439 189 47,981 (46,833) 28,552Finance costs (130,841) (3,262) (563) (52,164) 46,833 (139,997)409,601 572,950 5,897 3,057 – 991,505Share of results ofassociates andjoint ventures 71,967 44,001 37,695 9,588 – 163,251481,568 616,951 43,592 12,645 – 1,154,756Tax (expense) / credit (71,726) (49,717) 1,408 (1,663) – (121,698)Non-controllinginterests (35,201) (240,523) (3,885) (166) – (279,775)Profit for the year 374,641 326,711 41,115 10,816 – 753,283AssetsSegment assets 6,041,185 5,368,451 192,761 1,632,196 (1,919,256) 11,315,337Interests inassociates andjoint ventures 436,553 433,303 563,768 71,985 – 1,505,609Tax assets 59,752 2,471 1,560 126 – 63,909Total assets 6,537,490 5,804,225 758,089 1,704,307 (1,919,256) 12,884,855LiabilitiesSegment liabilities 4,048,842 3,008,683 137,621 1,320,642 (1,919,256) 6,596,532Tax liabilities 392,449 229,054 8,519 13,874 – 643,896Total liabilities 4,441,291 3,237,737 146,140 1,334,516 (1,919,256) 7,240,428Capital expenditure 777,069 535,980 28 2,853 – 1,315,930Significantnon-cash itemsDepreciation andamortisation 180,696 94,415 1,459 5,050 – 281,620Allowance made forimpairment invalue of assetsand assetswritten off (net) 17,150 464 153 – – 17,7672011TurnoverExternal sales 4,893,451 3,956,312 8,862 188,441 – 9,047,066Inter-segment sales 44,033 3,918 3,969 21,650 (73,570) –Total 4,937,484 3,960,230 12,831 210,091 (73,570) 9,047,066ResultsSegment results 355,663 739,121 (246) 6,568 – 1,101,106Finance income 3,836 59,977 143 40,786 (40,174) 64,568Finance costs (59,854) (2,491) (47) (43,450) 40,174 (65,668)299,645 796,607 (150) 3,904 – 1,100,006Share of results ofassociates andjoint ventures 65,133 53,275 46,385 5,780 – 170,573364,778 849,882 46,235 9,684 – 1,270,579Tax (expense) / credit (43,839) (80,958) (90) 118 – (124,769)Non-controllinginterests (16,575) (312,696) (7,398) 141 – (336,528)Profit for the year 304,364 456,228 38,747 9,943 – 809,282AssetsSegment assets 5,331,221 4,671,541 169,787 1,714,706 (1,552,058) 10,335,197Interests inassociates andjoint ventures 404,512 395,951 478,860 65,377 – 1,344,700Tax assets 65,949 2,261 1,560 2,958 – 72,728Total assets 5,801,682 5,069,753 650,207 1,783,041 (1,552,058) 11,752,625LiabilitiesSegment liabilities 3,736,114 2,281,758 50,331 1,338,347 (1,552,058) 5,854,492Tax liabilities 376,638 262,336 9,826 8,673 – 657,473Total liabilities 4,112,752 2,544,094 60,157 1,347,020 (1,552,058) 6,511,965Capital expenditure 611,335 471,499 698 8,360 – 1,091,892Significantnon-cash itemsDepreciation andamortisation 141,719 86,706 1,430 4,961 – 234,816Allowance made forimpairment invalue of assetsand assetswritten off (net) 17,143 930 (166) 15 – 17,922266 Powering the Future <strong>Sembcorp</strong> Industries Annual Report 2012 267
Notes to the Financial StatementsNotes to the Financial Statements43. Segment Reporting (cont’d)b. Geographical SegmentsRest ofASEAN,Australia Middle East Rest ofSingapore China & India & Africa UK Europe Others ConsolidatedS$’000 S$’000 S$’000 S$’000 S$’000 S$’000 S$’000 S$’0002012Revenue from external customers 5,212,045 100,454 907,890 764,446 551,625 1,255,674 1,396,924 10,189,058Total assets 8,463,743 1,226,366 744,247 1,383,619 825,746 127 241,007 12,884,855Non-current assets 3,697,617 1,142,668 677,983 1,190,209 777,594 – 204,037 7,690,108Capital expenditure 952,892 50,883 38,928 185,175 38,705 – 49,347 1,315,9302011Revenue from external customers 4,595,732 87,659 518,514 111,812 964,366 1,971,252 797,731 9,047,066Total assets 7,546,508 947,856 800,370 1,259,582 988,369 37 209,903 11,752,625Non-current assets 2,743,114 885,639 756,092 1,151,478 818,420 – 180,821 6,535,564Capital expenditure 638,309 23,606 16,132 351,118 39,824 – 22,903 1,091,89244. Significant Accounting Estimates and JudgementsEstimates, assumptions concerning the future and judgements are made in the preparation of the financial statements.They affect the application of the Group’s accounting policies, reported amounts of assets, liabilities, income and expenses,and disclosures made. They are assessed on an on-going basis and are based on experience and relevant factors, includingexpectations of future events that are believed to be reasonable under the circumstances.Key sources of estimation uncertaintyThe key assumptions concerning the future and other key sources of estimation uncertainty at the balance sheet date, thathave a significant risk of causing a material adjustment to the carrying amounts of assets and liabilities within the nextfinancial year are discussed below.Information on other significant areas of estimation uncertainty and critical judgements in applying accounting policies thathave the most significant effect on the amounts recognised in the financial statements are described in the following notes:a. Impairment of goodwillThe Group determines whether goodwill is impaired at least on an annual basis. This requires an estimation of the valuein-useof the cash-generating units to which the goodwill is allocated. Estimating the value in use requires the Group tomake an estimate of the expected future cash flows from the cash-generating unit and also to choose a suitable discountrate in order to calculate the present value of those cash flows. Information about the assumptions and their risk factorsrelating to goodwill impairment are disclosed in Note 12.268 Powering the Future <strong>Sembcorp</strong> Industries Annual Report 2012 269
Notes to the Financial StatementsNotes to the Financial Statements44. Significant Accounting Estimates and Judgements (cont’d)b. TaxesThe Group is subject to taxes in numerous jurisdictions. Significant judgement is involved in determining the group-wideprovision for taxes. There are certain transactions and computation for which the ultimate tax determination is uncertainduring the ordinary course of business. The Group recognises liabilities for expected tax issues based on estimates ofwhether additional taxes will be due. The Group believes that its accruals for tax liabilities are adequate for all open yearsbased on its assessment of many factors, including interpretations of tax law and prior experience. Where the final taxoutcome of these matters is different from the amounts that were initially recorded, such differences will impact the taxesand deferred tax provisions in the period in which such determination is made. The tax expense is disclosed in Note 32.c. Pension assumptionsThe Group has decided on certain principal actuarial assumptions, as detailed in Note 24, in estimating its pensionliability as at the balance sheet date. If there were adverse changes to these actuarial assumptions, then the Group’sunrecognised actuarial losses would increase with the risk that they would fall outside the corridor and would need tobe recognised in the profit or loss.d. Depreciation of property, plant and equipmentProperty, plant and equipment are depreciated on a straight-line basis over their estimated useful lives. Managementestimates the useful lives of these property, plant and equipment to be within 1 to 80 years. The carrying amountof the Group’s property, plant and equipment are set out in Note 3. Changes in the expected level of usage andtechnological developments could impact the economic useful lives and the residual values of these assets, thereforefuture depreciation charges could be revised.e. Provisions and contingent liabilitiesEstimates of the Group’s obligations arising from contracts that exist as at balance sheet date may be affected byfuture events, which cannot be predicted with any certainty. The assumptions and estimates are made based on themanagement’s knowledge and experience and may vary from actual experience so that the actual liability may varyconsiderably from the best estimates.44. Significant Accounting Estimates and Judgements (cont’d)Critical accounting judgements in applying the Group’s accounting policiesIn the process of applying the Group’s accounting policies, management has made certain judgements, apart from thoseinvolving estimations, which have significant effect on the amounts recognised in the financial statements.a. Revenue recognitionThe Group has recognised revenue on construction contract, ship and rig repair, building and conversion based on thepercentage of completion method in proportion to the stage of completion. The percentage of completion is assessedby reference to surveys of work performed. Significant judgement is required in determining the appropriate stageof completion and estimating a reasonable contribution margin for revenue and costs recognition. Revenue fromconstruction contract, ship and rig repair, building and conversion is disclosed in Note 30.b. Impairment of investments and financial assetsThe Group follows the guidance of FRS 39 Financial Instruments: Recognition and Measurement in determining when aninvestment or financial asset is other than temporarily impaired. This determination requires significant judgement. TheGroup evaluates, among other factors, the duration and extent to which the fair value of an investment and financialasset is less than its cost; and the financial health of and near-term business outlook for the investment or financial asset,including factors such as industry and sector performance, changes in technology and operational and financing cashflow. The carrying amounts of trade receivables, amounts due from related parties and other receivables are disclosed inNote 9, Note 11 and Note 16 respectively.45. Subsequent EventsSubsequent to year end, the Group has increased its shareholding in <strong>Sembcorp</strong> Utilities (Netherlands) N.V. (SUNNV), from98.49% to 100% following the completion of squeeze-out proceedings under the Dutch Civil Code. The Group paid aconsideration of US$10.13 per share as set by the court order on the remaining 465,870 shares to the Dutch Ministry ofFinance on January 11, 2013 and SUNNV became a wholly-owned subsidiary of the Group.Where it is not probable that an outflow of economic benefits will be required, or the amount cannot be estimatedreliably, the obligation is disclosed as a contingent liability, unless the probability of outflow of economic benefits isremote. Possible obligations, whose existence will only be confirmed by the occurrence or non-occurrence of one ormore future events are also disclosed as contingent liabilities unless the probability of outflow of economic benefits isremote. Movements in provisions and disclosure of contingent liabilities are detailed in Note 20 and Note 41 respectively.270 Powering the Future <strong>Sembcorp</strong> Industries Annual Report 2012 271
Notes to the Financial StatementsNotes to the Financial Statements46. New or Revised Accounting Standards and InterpretationsBelow are the mandatory standards, amendments and interpretations to existing standards that have been published, andare relevant for the Group’s accounting period beginning on or after January 1, 2013 or later periods and which the Grouphas not early adopted:Applicable for the Group’s 2013 financial statementsAmendments to FRS 1 Presentation of Financial Statements: Presentation of Items of Other Comprehensive Income requiresitems of other comprehensive income that would be reclassified to profit or loss in the future to be presented separately fromthose that would never be reclassified to profit or loss. Consequently, where these items are presented before their relatedtax effects, the aggregated tax amount would also have to be allocated between these sections.FRS 19 Employee Benefits (revised 2011), which revises certain principles of the current FRS 19, including the eliminationof the option to defer recognition of re-measurement gains and losses for defined benefit plans and requiring these remeasurementsto be presented in other comprehensive income. The standard also requires a re-assessment of the basis usedfor determining the income and expense related to defined benefit plans. In addition, there are changes to the definition ofemployee benefits as short-term or other long-term employee benefits. The management anticipates that the adoption ofthe above amendments to FRS in the future periods will not have a material impact on the financial statements of the Groupand of the Company in the period of their initial adoption.FRS 113 Fair Value Measurement provides consistent guidance across FRSs on how fair value should be determined and whichdisclosures should be made in the financial statements. The adoption of this standard will require the Group to re-assess thebases used for determining the fair values computed for both measurement and disclosure purposes. On initial application ofthe standard, the Group does not expect substantial changes to the bases used for determining fair values.Applicable for the Group’s 2014 financial statementsFRS 110 Consolidated Financial Statements replaces all of the guidance on control and consolidation in FRS 27 “Consolidatedand Separate Financial Statements” and INT FRS 12 “Consolidation – Special Purpose Entities”. The same criteria are nowapplied to all entities to determine control. Additional guidance is also provided to assist in the determination of controlwhere this is difficult to assess. The Group has yet to assess the full impact of FRS 110 and intends to apply the standardfrom January 1, 2014.FRS 111 Joint Arrangements introduces a number of changes. The “types” of joint arrangements have been reduced to two:joint operations and joint ventures. The existing policy choice of proportionate consolidation for jointly controlled entitieshas been eliminated and equity accounting is mandatory for participants in joint ventures. Entities that participate in jointoperations will follow accounting much like that for joint assets or joint operations currently. The Group has yet to assess thefull impact of FRS 111 and intends to adopt the standard from January 1, 2014.FRS 112 Disclosure of Interests in Other Entities requires disclosure of information that helps financial statement readers toevaluate the nature, risks and financial effects associated with the entity’s interests in (1) subsidiaries, (2) associates, (3) jointarrangements and (4) unconsolidated structured entities. The Group has yet to assess the full impact of FRS 112 and intendsto adopt the standard from January 1, 2014.47. SubsidiariesDetails of significant subsidiaries are as follows:Effective equityheld by the GroupCountry of 2012 2011Name of significant subsidiaries incorporation % %Utilities<strong>Sembcorp</strong> Utilities Pte Ltd 1 Singapore 100 100<strong>Sembcorp</strong> Cogen Pte Ltd 1 Singapore 100 100<strong>Sembcorp</strong> Gas Pte Ltd 1 Singapore 70 70<strong>Sembcorp</strong> Salalah Power and Water Company SAOC 2 Oman 60 60<strong>Sembcorp</strong> Utilities (UK) Limited 2 United Kingdom 100 100<strong>Sembcorp</strong> Utilities (Netherlands) N.V. 2 The Netherlands 98.49 97.66<strong>Sembcorp</strong> Bournemouth Water Limited 2 United Kingdom 98.49 97.66<strong>Sembcorp</strong> Environment Pte. Ltd. 1 Singapore 100 100SembWaste Pte Ltd 1 Singapore 100 100<strong>Sembcorp</strong> Investments (UK) Limited 2 United Kingdom 98.49 97.66<strong>Sembcorp</strong> Utilities (South Africa) Pty Limited 2 South Africa 98.49 97.66<strong>Sembcorp</strong> Silulumanzi (Pty) Limited 2 South Africa 98.49 97.66The China Water Company Limited 3 Cayman Islands 98.69 97.96Marine<strong>Sembcorp</strong> Marine Ltd 1 Singapore 60.61 60.76Jurong Shipyard Pte Ltd 1 Singapore 60.61 60.76PPL Shipyard Pte Ltd 1 Singapore 51.52 51.65Sembawang Shipyard Pte Ltd 1 Singapore 60.61 60.76SMOE Pte Ltd 1 Singapore 60.61 60.76Urban Development<strong>Sembcorp</strong> Development Ltd 1 Singapore 100 100Vietnam Singapore Industrial Park Pte Ltd 1 Singapore 92.88 79.29Singapore Technologies Industrial Corp Ltd 1 Singapore 100 100Others<strong>Sembcorp</strong> Design and Construction Pte Ltd 1 Singapore 100 100Singapore Precision Industries Pte Ltd 1 Singapore 100 1001. Audited by KPMG LLP, Singapore.2. Audited by overseas affiliates of KPMG LLP.3. Audited by Shu Lun Pan Certified Public Accountants Co., Ltd.272 Powering the Future <strong>Sembcorp</strong> Industries Annual Report 2012 273
Notes to the Financial StatementsSupplementary InformationYear ended December 31, 201248. Associates and Joint VenturesDetails of significant associates and joint ventures are as follows:Effective equityheld by the GroupCountry of 2012 2011Name of significant associates and joint ventures incorporation % %Utilities^Phu My 3 BOT Power Company Ltd. Vietnam 33.33 33.33#Shanghai Cao Jing Co-generation Co. Ltd People’s Republic of China 30.00 30.00@Shenzhen Chiwan Sembawang Engineering Co., Ltd People’s Republic of China 32.00 32.00***Emirates <strong>Sembcorp</strong> Water & Power Company P.J.S.C United Arab Emirates 40.00 40.00*SembSita Pacific Pte Ltd Singapore 40.00 40.00^^Thermal Powertech Corporation India Ltd India 49.00 49.00Marine##COSCO Shipyard Group People’s Republic of China 18.18 18.23Urban Development@@Gallant Venture Ltd Singapore 23.92 23.92^^Vietnam Singapore Industrial Park J.V. Co., Ltd. Vietnam 47.37 40.44^^Wuxi-Singapore Industrial Park Development Co., Ltd People’s Republic of China 45.36 45.36**Sino-Singapore Nanjing Eco Hi-tech Island Development Co., Ltd People’s Republic of China 21.50 21.50##Sino-Singapore (Chengdu) Innovation Park Development Co., Ltd People’s Republic of China 25.00 –The auditors of significant associates and joint ventures are as follows:^ Audited by Ernst & Young Vietnam Limited.# Audited by PricewaterhouseCoopers Zhong Tian CPAs Limited Company.@ Audited by Shenzhen Dahua Tiancheng Certified Public Accountants.* Audited by Ernst & Young LLP.^^ Audited by overseas affiliates of KPMG LLP.## Audited by Zhongrui Yuehua Certified Public Accountants Co., Ltd.@@ The consolidated financial statements of Gallant Venture Ltd, a company listed on Singapore Exchange, and its subsidiaries are audited by Foo, Kon &Tan Grant Thornton.** Audited by Jiangsu GongZheng Tain Ye Certified Public Accountant Co., Ltd, China.*** Audited by Ernst & Young, Abu Dhabi.See Note 6 for details on pledge on the Company’s interests in its associate and joint venture.(Under SGX-ST Listing Manual requirements)A. Directors’ and Key Executives’ Remuneration Earned for the YearSummary compensation table for the year ended December 31, 2012Fair value ofshare-basedcompensation Directors’ fees BroughtBonus granted for ForwardSalary 1 Earned the year 3 Cash-based 4 Share-based 5 Bonus Bank 2Name of Director S$’000 S$’000 S$’000 S$’000 S$’000 S$’000Payable by CompanyAng Kong Hua – – – 183 78 –Tang Kin Fei 1,145 3,558 2,322 – – 6,578Goh Geok Ling – – – 105 45 –Evert Henkes – – – 148 63 –Bobby Chin Yoke Choong – – – 118 51 –Margaret Lui – – – 100 43 –Tan Sri Mohd Hassan Marican – – – 104 45 –Tham Kui Seng – – – 66 28 –Dr Teh Kok Peng – – – 16 7 –Payable by SubsidiariesGoh Geok Ling – – – 280 84 –Tan Sri Mohd Hassan Marican – – – 99 42 –Tang Kin Fei 4 – – – 287 64 –Fair value ofshare-basedcompensation Directors’ fees BroughtBonus granted for ForwardSalary 1 Earned the year 3 Cash-based 4 Share-based 5 Bonus Bank 2Name of Key Executive S$’000 S$’000 S$’000 S$’000 S$’000 S$’000Low Sin Leng 580 646 591 – – 1,111Tan Cheng Guan 4 594 1,194 591 32 – 1,269Koh Chiap Khiong 4 497 1,082 591 195 32 792Ng Meng Poh 512 1,602 591 – – 1,167Wong Weng Sun 795 2,830 1,273 – – 10,946Notes:1. The amount shown is inclusive of basic salary, fixed allowances, AWS and other emoluments.2. The Brought Forward Bonus Bank is the outstanding balance of bonus as at December 31, 2012 (excluding the bonus earned during the financial year).Typically, one-third of the accumulated bonus comprising Bonus Earned in the financial year and the Brought Forward Bonus is paid out in cash each year,with the balance being carried forward to the following year. The balances of the bonus bank in future will be adjusted by the yearly EVA performanceof the Group and the payouts made from the Bonus Bank.3. The fair value of the share plans granted for the year is disclosed. The shares granted to key executives are contingent upon meeting performancemeasures. If these performance measures are not met, the key executive will not be vested with any shares.4. Directors’ fees in cash from subsidiaries for Mr Tang Kin Fei, Mr Tan Cheng Guan and Mr Koh Chiap Khiong are payable to SCI.274 Powering the Future <strong>Sembcorp</strong> Industries Annual Report 2012 275
Supplementary InformationSupplementary Information(Under SGX-ST Listing Manual requirements)A. Directors’ and Key Executives’ Remuneration Earned for the Year (cont’d))Notes:5. To align the interests of the non-executive directors with the interests of shareholders, up to 30% of the aggregate directors’ fees approved byshareholders for a particular financial year may be paid out in the form of restricted share awards under the <strong>Sembcorp</strong> Industries Restricted SharePlan 2010.From 2011, the awards granted under the <strong>Sembcorp</strong> Industries Restricted Share Plan 2010 to all directors as part of their directors’ fees (except for MrTang Kin Fei, who is the Group President & CEO, and who does not receive any directors’ fees) will consist of the grant of fully paid shares outright withno performance and vesting conditions attached, but with a selling moratorium. Non-executive directors are required to hold shares (including sharesobtained by other means) worth at least one-time the annual base retainer (currently S$65,000); any excess may be sold as desired. A non-executivedirector can dispose of all of his shares one year after leaving the Board.The actual number of shares to be awarded to each non-executive director will be determined by reference to the volume-weighted average price of ashare on the Singapore Exchange Securities Trading Limited (SGX-ST) over the 14 trading days immediately following the date of the Annual GeneralMeeting (AGM). The number of shares to be awarded will be rounded down to the nearest hundred and any residual balance will be settled in cash.Details on the share options, performance shares and restricted shares granted to the directors are set out in the Share-basedIncentive Plans of the Directors’ Report.(Under SGX-ST Listing Manual requirements)B. Interested Person TransactionsInterested person transactions carried out during the financial year which fall under Chapter 9 of the Listing Manual of theSingapore Exchange Securities Trading Limited (SGX-ST) are as follows:Aggregate value of all interested person transactions conducted under shareholders’ mandatepursuant to Rule 920 of the SGX-ST Listing Manual (excluding transactions less than S$100,000)2012S$’000Sale of goods and servicesTemasek Holdings (Private) Limited and its Associates– PSA International Pte Ltd and its Associates 3,755– Singapore Power Ltd and its Associates 2,119– Temasek Capital (Private) Limited and its Associates 1,490– Singapore Technologies Telemedia Pte Ltd and its Associates 6177,981Starhub Ltd and its Associates 960SATS Ltd and its Associates 236Singapore Airlines Limited and its Associates 2,740Singapore Technologies Engineering Ltd and its Associates 7,85819,775Purchase of goods and servicesTemasek Holdings (Private) Limited and its Associates– Temasek Capital (Private) Limited and its Associates 1 1,269,077– Singapore Power Ltd and its Associates 4,259– Certis CISCO Security Pte Ltd 1491,273,485SMRT Corporation Ltd and its Associates 1,208Singapore Technologies Engineering Ltd and its Associates 6,0571,280,750Management and support services– Temasek Capital (Private) Limited and its Associates 2,370Sub-total 1,302,895Establishment of joint ventureTemasek Holdings (Private) Limited and its Associates– Tembusu Capital Pte. Ltd. and its Associates 92,837Sale of propertySingapore Technologies Engineering Ltd and its Associates 8,233Sub-total 101,070Total interested person transactions 1,403,965Note:1. This relates mainly to the purchase of gas by <strong>Sembcorp</strong> Cogen Pte Ltd from <strong>Sembcorp</strong> Gas Pte Ltd for the generation of electricity.276 Powering the Future <strong>Sembcorp</strong> Industries Annual Report 2012 277
EVA StatementYear ended December 31, 2012Shareholders’ Information2012 2011Note S$’000 S$’000Net operating profit before tax expense 991,505 1,100,006Adjust for:Share of associates’ and joint ventures’ profits 207,627 205,619Interest expense 1 139,857 69,337Others 2 (29,772) (6,849)Adjusted profit before interest and tax 1,309,217 1,368,113Cash operating taxes 3 (164,980) (160,805)Net operating profit after tax (NOPAT) 1,144,237 1,207,308Average capital employed 4 8,874,320 8,120,351Weighted average cost of capital 5 5.9% 5.9%Capital charge 523,585 479,101Economic Value Added (EVA) 620,652 728,207Non-controlling share of EVA (198,443) (255,857)EVA attributable to shareholders 422,209 472,350Less: Unusual items (UI) gains 6 49,175 –EVA attributable to shareholders (exclude UI) 373,034 472,350Notes:1. Interest expense includes imputed interest on present value of operating leases and capitalised interest charged to profit orloss upon disposal of the assets.2. Other adjustments include recovery of investment costs, timing difference of allowances made for / (write-back) of doubtfuldebts, warranty, inventory obsolescence and goodwill written off / impaired and construction-in-progress.3. The reported current tax is adjusted for the statutory tax impact of interest expense.4. Average capital employed is computed by taking monthly average total assets less non interest-bearing liabilities plus timingprovision, goodwill written off / impaired and present value of operating leases.2012 2011S$’000S$’000Major Capital Components:Property, plant and equipment 5,034,076 4,045,713Investments 1,697,060 1,546,745Other long-term assets 697,311 690,313Net working capital and long-term liabilities 1,445,873 1,837,580Average capital employed 8,874,320 8,120,3515. The Weighted Average Cost of Capital is calculated in accordance with the <strong>Sembcorp</strong> Group EVA Policy as follows:Statistics of Shareholders as of March 5, 2013Issued and fully paid-up capital:S$565,571,683.28Number of issued shares: 1,787,547,732Number / percentage of treasury shares: 2,929,029 (0.16%)Number of shareholders: 25,729Class of shares:Ordinary shares with equal voting rights @Shareholdings Held by the PublicBased on information available to the company as of March 5, 2013, 50.47% * of the issued ordinary shares of the company isheld by the public and therefore, the company has complied with Rule 723 of the SGX-ST Listing Manual.Substantial Shareholders Direct Interest Indirect Interest Total % *Temasek Holdings (Private) Limited 871,200,328 12,718,760 ** 883,919,088 49.53Top 20 Shareholders as of March 5, 2013No. Name No. of Ordinary Shares Held % *1 Temasek Holdings (Private) Limited 871,200,328 48.822 Citibank Nominees Singapore Pte Ltd 184,997,329 10.373 DBS Nominees Pte Ltd 175,389,890 9.834 DBSN Services Pte Ltd 136,119,198 7.635 HSBC (Singapore) Nominees Pte Ltd 96,631,600 5.416 United Overseas Bank Nominees Pte Ltd 79,219,663 4.447 Raffles Nominees (Pte) Ltd 25,911,927 1.458 BNP Paribas Securities Services 10,645,660 0.609 Startree Investments Pte Ltd 9,400,000 0.5310 DB Nominees (S) Pte Ltd 8,438,161 0.4711 OCBC Nominees Singapore Pte Ltd 5,692,773 0.3212 Merrill Lynch (Singapore) Pte Ltd 5,043,365 0.2813 Tang Kin Fei 3,936,206 0.2214 Bank of Singapore Nominees Pte Ltd 2,997,830 0.1715 Phillip Securities Pte Ltd 2,120,319 0.1216 Oversea Chinese Bank Nominees Pte Ltd 1,847,125 0.1017 Low Sin Leng 1,540,312 0.0918 Morgan Stanley Asia (Singapore) 1,355,048 0.0719 DBS Vickers Securities (S) Pte Ltd 1,320,356 0.0720 BNP Paribas Nominees Singapore Pte Ltd 1,317,276 0.071,625,124,366 91.06@Ordinary shares purchased and held as treasury shares by the company will have no voting rights.* The percentage of issued ordinary shares is calculated based on the number of issued ordinary shares of the company as of March 5, 2013 excluding 2,929,029ordinary shares held as treasury shares as at that date.** Temasek is deemed to be interested in the 12,718,760 Shares in which its subsidiaries and / or associated companies have or are deemed to have an interestpursuant to Section 7 of the Companies Act.i. Cost of Equity using Capital Asset Pricing Model with market risk premium at 5.0% (2011: 5.0%);ii. Risk-free rate of 2.39% (2011: 2.69%) based on yield-to-maturity of Singapore Government 10-year Bonds;iii. Ungeared beta ranging from 0.5 to 1.0 (2011: 0.5 to 1.0) based on <strong>Sembcorp</strong> Industries’ risk categorisation; andiv. Cost of Debt rate at 2.87% (2011: 2.63%).6. Unusual items (UI) refer to gain / loss on divestment of subsidiaries, associates, joint ventures, long-term investments anddisposal of major property, plant and equipment.278 Powering the Future <strong>Sembcorp</strong> Industries Annual Report 2012 279
Shareholders’ InformationCorporate InformationAnalysis of Shareholdings as of March 5, 2013No. of OrdinaryNo. of OrdinaryRange of Shareholdings Shareholders % Shares Held %1 – 999 2,975 11.56 1,582,928 0.091,000 – 10,000 20,210 78.55 65,252,209 3.6510,001 – 1,000,000 2,518 9.79 87,268,569 4.881,000,001 and above 26 0.10 1,633,444,026 91.3825,729 100.00 1,787,547,732 100.00Registered Office30 Hill Street #05-04Singapore 179360Tel: (65) 6723 3113Fax: (65) 6822 3254www.sembcorp.comBoard of DirectorsAng Kong HuaChairmanTang Kin FeiGroup President & CEOGoh Geok LingEvert HenkesBobby Chin Yoke ChoongMargaret LuiTan Sri Mohd Hassan MaricanTham Kui SengDr Teh Kok PengExecutive CommitteeAng Kong HuaChairmanGoh Geok LingTang Kin FeiMargaret LuiAudit CommitteeBobby Chin Yoke ChoongChairmanTan Sri Mohd Hassan MaricanEvert HenkesExecutive Resource &Compensation CommitteeAng Kong HuaChairmanGoh Geok LingMargaret LuiNominating CommitteeAng Kong HuaChairmanGoh Geok LingMargaret LuiRisk CommitteeEvert HenkesChairmanBobby Chin Yoke ChoongTan Sri Mohd Hassan MaricanTechnology Advisory PanelAng Kong HuaChairmanTang Kin FeiDr Teh Kok PengDr Josephine Kwa Lay KengDr Ng How YongProf Lui Pao ChuenCompany SecretaryKwong Sook MayRegistrarM & C Services Private Limited112 Robinson Road #05-01Singapore 068902Principal BankersAustralia and New ZealandBanking Group LimitedCIMB Bank BerhadCitibank N.A.DBS BankMaybankMizuho Corporate Bank, LtdNatixisOversea-Chinese BankingCorporation LimitedStandard Chartered BankSumitomo Mitsui Banking CorporationThe Bank of Tokyo-Mitsubishi UFJ, LtdThe Hongkong and ShanghaiBanking Corporation LimitedUnited Overseas Bank LimitedAuditorsKPMG LLPCertified Public Accountants16 Raffles Quay #22-00Hong Leong BuildingSingapore 048581Partner-in-Charge: Lau Kam Yuen(Appointed during the financial year endedDecember 31, 2010)280 Powering the Future <strong>Sembcorp</strong> Industries Annual Report 2012 281
Notice of Annual General MeetingNotice of Annual General Meeting<strong>Sembcorp</strong> Industries LtdCo Regn No. 199802418D(Incorporated in the Republic of Singapore)Notice is hereby given that the Fifteenth Annual General Meeting of <strong>Sembcorp</strong> Industries Ltd (the “Company”) will be heldat the Multi-function Room, <strong>Sembcorp</strong> Industries Ltd, Level 1, 30 Hill Street, Singapore 179360 on Thursday, April 25, 2013 at11.00 a.m. for the following purposes:Ordinary BusinessSpecial BusinessTo consider and, if thought fit, to pass the following resolutions which will be proposed as OrdinaryResolutions:8. That authority be and is hereby given to the directors to:a. i. issue shares in the capital of the Company (“shares”) whether by way of rights, bonus orotherwise; and / orResolution 101. To receive and adopt the Directors’ Report and Audited Accounts for the year ended December 31,2012 and the Auditors’ Report thereon.2. To declare a final tax exempt 1-Tier dividend of 15 cents per ordinary share for the year ended December31, 2012.3. To re-elect the following directors, each of whom will retire by rotation pursuant to Article 93 of theCompany’s Articles of Association and who, being eligible, will offer themselves for re-election:a. Ang Kong Huab. Tang Kin Feic. Margaret Lui4. To re-elect Dr Teh Kok Peng, a director retiring pursuant to Article 99 of the Company’s Articles ofAssociation and who, being eligible, will offer himself for re-election.5. To re-appoint Goh Geok Ling, a director retiring under Section 153 of the Companies Act, Cap. 50, tohold office from the date of this Annual General Meeting until the next Annual General Meeting.6. To approve directors’ fees of S$1,198,842 for the year ended December 31, 2012, comprising:a. S$839,189 to be paid in cash (2011: S$896,429); andb. S$359,653 to be paid in the form of restricted share awards under the <strong>Sembcorp</strong> IndustriesRestricted Share Plan 2010 (2011: S$384,184), with the number of shares to be awarded roundeddown to the nearest hundred and any residual balance settled in cash.7. To re-appoint KPMG LLP as Auditors of the Company and to authorise the directors to fix theirremuneration.Resolution 1Resolution 2Resolution 3Resolution 4Resolution 5Resolution 6Resolution 7Resolution 8Resolution 9ii.make or grant offers, agreements or options (collectively, “Instruments”) that might or wouldrequire shares to be issued, including but not limited to the creation and issue of (as well asadjustments to) warrants, debentures or other instruments convertible into shares,at any time and upon such terms and conditions and for such purposes and to such persons as thedirectors may, in their absolute discretion, deem fit; andb. (notwithstanding the authority conferred by this Resolution may have ceased to be in force) issueshares in pursuance of any Instrument made or granted by the directors while this Resolution wasin force,provided that:(1) the aggregate number of shares to be issued pursuant to this Resolution (including shares to beissued in pursuance of Instruments made or granted pursuant to this Resolution) does not exceed50% of the total number of issued shares in the capital of the Company excluding treasury shares(as calculated in accordance with paragraph (2) below), of which the aggregate number of sharesto be issued other than on a pro rata basis to shareholders of the Company (including shares to beissued in pursuance of Instruments made or granted pursuant to this Resolution) shall not exceed5% of the total number of issued shares in the capital of the Company excluding treasury shares(as calculated in accordance with paragraph (2) below);(2) (subject to such manner of calculation as may be prescribed by the Singapore Exchange SecuritiesTrading Limited (“SGX-ST”)) for the purpose of determining the aggregate number of shares thatmay be issued under paragraph (1) above, the percentage of issued shares shall be based on thetotal number of issued shares in the capital of the Company excluding treasury shares at the timethis Resolution is passed, after adjusting for:(i)new shares arising from the conversion or exercise of any convertible securities or share optionsor vesting of share awards which are outstanding or subsisting at the time this Resolution ispassed; and(ii) any subsequent bonus issue or consolidation or subdivision of shares;(3) in exercising the authority conferred by this Resolution, the Company shall comply with the provisionsof the Listing Manual of the SGX-ST for the time being in force (unless such compliance has beenwaived by the SGX-ST) and the Articles of Association for the time being of the Company; and(4) (unless revoked or varied by the Company in General Meeting) the authority conferred by thisResolution shall continue in force until the conclusion of the next Annual General Meeting of theCompany or the date by which the next Annual General Meeting of the Company is required bylaw to be held, whichever is the earlier.282 Powering the Future <strong>Sembcorp</strong> Industries Annual Report 2012 283
Notice of Annual General MeetingNotice of Annual General MeetingSpecial Business (cont’d)9. That approval be and is hereby given to the directors to:a. grant awards in accordance with the provisions of the <strong>Sembcorp</strong> Industries Performance Share Plan2010 (the “SCI PSP 2010”) and / or the <strong>Sembcorp</strong> Industries Restricted Share Plan 2010 (the “SCIRSP 2010”) (the SCI PSP 2010 and SCI RSP 2010, together the “Share Plans”); andb. allot and issue from time to time such number of fully paid-up ordinary shares in the capital of theCompany as may be required to be delivered pursuant to the vesting of awards under the SharePlans,provided that:(1) the aggregate number of (i) new ordinary shares allotted and issued and / or to be allotted andissued, (ii) existing ordinary shares (including shares held in treasury) delivered and / or to bedelivered, and (iii) ordinary shares released and / or to be released in the form of cash in lieu ofordinary shares, pursuant to the Share Plans, shall not exceed 7% of the total number of issuedordinary shares in the capital of the Company (excluding treasury shares) from time to time; and(2) the aggregate number of ordinary shares under awards to be granted pursuant to the Share Plansduring the period commencing from this Annual General Meeting and ending on the date of thenext Annual General Meeting of the Company or the date by which the next Annual GeneralMeeting of the Company is required by law to be held, whichever is the earlier, shall not exceed1% of the total number of issued ordinary shares in the capital of the Company (excluding treasuryshares) from time to time.10. To transact any other business.By Order of the BoardKwong Sook MayCompany SecretaryMarch 28, 2013Resolution 11Explanatory NotesResolutions 3 to 7 – Detailed information on these directors can be found under the Board of Directors and Corporate GovernanceReport sections in the Annual Report 2012.Resolution 8 – is to approve the payment of directors’ fees, comprising a cash component and a share component. Detailedinformation on compensation to the non-executive directors can be found under the Corporate Governance Report section in theAnnual Report 2012. Directors and their associates will abstain from voting on Resolution 8.The directors’ fees will only be paid after shareholders’ approval has been obtained at the forthcoming Annual General Meeting(“AGM”) of the Company. To align the interests of the non-executive directors with the interests of shareholders, up to 30% ofthe aggregate directors’ fees approved by shareholders for a particular financial year may be paid out in the form of restrictedshare awards under the <strong>Sembcorp</strong> Industries Restricted Share Plan 2010.For year 2012, the awards granted under the <strong>Sembcorp</strong> Industries Restricted Share Plan 2010 to all directors as part of theirdirectors’ fees (except for Mr Tang Kin Fei, who is the Group President & CEO, and who does not receive any directors’ fees)will consist of the grant of fully paid shares outright with no performance and vesting conditions attached, but with a sellingmoratorium. Non-executive directors are required to hold shares (including shares obtained by other means) worth at least onetimethe annual base retainer (currently S$65,000); any excess may be sold as desired. A non-executive director can dispose of allof his shares one year after leaving the Board.The actual number of shares to be awarded to each non-executive director will be determined by reference to the volumeweightedaverage price of a share on the SGX-ST over the 14 trading days immediately following the date of the AGM. Thenumber of shares to be awarded will be rounded down to the nearest hundred and any residual balance will be settled in cash.Statement pursuant to Article 55 of the Articles of Association of the Company:Resolution 10 – is to empower the directors to issue shares in the capital of the Company and to make or grant Instruments(such as warrants or debentures) convertible into shares, and to issue shares in pursuance of such Instruments, up to a numbernot exceeding 50% of the total number of issued shares in the capital of the Company excluding treasury shares, of which up to5% may be issued other than on a pro rata basis to shareholders. The aggregate number of shares which may be issued shall bebased on the total number of issued shares in the capital of the Company excluding treasury shares at the time that Resolution 10is passed, after adjusting for (a) new shares arising from the conversion or exercise of any convertible securities or share optionsor vesting of share awards which are outstanding or subsisting at the time that Resolution 10 is passed, and (b) any subsequentbonus issue or consolidation or subdivision of shares.Resolution 11 – is to empower the directors to offer and grant awards pursuant to the <strong>Sembcorp</strong> Industries Performance SharePlan 2010 and the <strong>Sembcorp</strong> Industries Restricted Share Plan 2010 (collectively, the “Share Plans”) and to issue ordinary sharesin the capital of the Company pursuant to the vesting of awards granted pursuant to the Share Plans provided that: (a) theaggregate number of (i) new ordinary shares allotted and issued and / or to be allotted and issued, (ii) existing ordinary shares(including shares held in treasury) delivered and / or to be delivered, and (iii) ordinary shares released and / or to be released in theform of cash in lieu of ordinary shares, pursuant to the Share Plans shall not exceed 7% of the total number of issued ordinaryshares in the capital of the Company (excluding treasury shares) from time to time; and (b) the aggregate number of ordinaryshares under awards to be granted pursuant to the Share Plans during the period commencing from this Annual General Meetingto the next Annual General Meeting shall not exceed 1% of the total number of issued ordinary shares in the capital of theCompany (excluding treasury shares) from time to time. Approval for the adoption of the Share Plans was given by shareholdersat an Extraordinary General Meeting of the Company held on April 22, 2010. The grant of awards under the Share Plans will bemade in accordance with their respective provisions.284 Powering the Future <strong>Sembcorp</strong> Industries Annual Report 2012 285
Notice of Annual General MeetingProxy FormNotes:1. A member of the Company entitled to attend and vote at the Annual General Meeting is entitled to appoint not more than two proxies to attend and vote inhis stead. A proxy need not be a member of the Company.2. The instrument appointing a proxy must be lodged at the office of the Company’s Registrar, M & C Services Private Limited, 112 Robinson Road #05-01,Singapore 068902 not later than 48 hours before the time appointed for the Annual General Meeting.Notice of Books Closure and Dividend Payment DateNotice is hereby given that the Register of Members and Share Transfer Books of the Company will be closed on May 3, 2013 todetermine the shareholders’ entitlements to the proposed dividend. Duly completed transfers of shares received by the Company’sShare Registrar, M & C Services Private Limited at 112 Robinson Road #05-01, Singapore 068902, up to 5.00 p.m. on May 2,2013 (the “Book Closure Date”) will be registered to determine shareholders’ entitlements to the proposed dividend. Subject asaforesaid, shareholders whose securities accounts with The Central Depository (Pte) Limited are credited with ordinary shares inthe capital of the Company as at 5.00 p.m. on the Book Closure Date will be entitled to the proposed dividend.<strong>Sembcorp</strong> Industries LtdCo Regn No. 199802418D(Incorporated in the Republic of Singapore)Fifteenth Annual General MeetingI / We, (Name), (NRIC / Passport No.)of(Address)being a member / members of SEMBCORP INDUSTRIES LTD hereby appoint:IMPORTANT1. For investors who have used their CPF moneys to buy <strong>Sembcorp</strong> Industries Ltd’s shares, this report isforwarded to them at the request of their CPF Approved Nominees solely FOR INFORMATION ONLY.2. This Proxy Form is not valid for use by CPF investors and shall be ineffective for all intents and purposesif used or purported to be used by them.3. CPF Investors who wish to vote should contact their CPF Approved Nominees.Name Address NRIC / Passport No. % of ShareholdingsThe proposed dividend, if approved by the members at the Annual General Meeting, will be paid on May 14, 2013.and / or (delete as appropriate)Name Address NRIC / Passport No. % of ShareholdingsGlue and seal along the edgeas my / our proxy / proxies to attend and vote for me / us on my / our behalf and, if necessary, to demand a poll, at the AnnualGeneral Meeting of the Company to be held on Thursday, April 25, 2013 at 11.00 a.m. at the Multi-function Room, <strong>Sembcorp</strong>Industries Ltd, Level 1, 30 Hill Street, Singapore 179360 and at any adjournment thereof.(Please indicate with an “X” in the spaces provided whether you wish your vote(s) to be cast for or against the Resolutions as set out in the Notice of Annual GeneralMeeting. In the absence of specific directions, the proxy / proxies will vote or abstain as he / they may think fit, as he / they will on any other matter arising at theAnnual General Meeting.)Resolutions For AgainstOrdinary Business1. To adopt the Directors’ Report and Accounts2. To declare a final dividend3. To re-elect Ang Kong Hua4. To re-elect Tang Kin Fei5. To re-elect Margaret Lui6. To re-elect Dr Teh Kok Peng7. To re-appoint Goh Geok Ling8. To approve directors’ fees for financial year ended December 31, 20129. To re-appoint KPMG LLP as Auditors and to fix their remunerationSpecial Business10. To approve the renewal of Share Issue Mandate11.To authorise the directors to grant awards and issue shares under the<strong>Sembcorp</strong> Industries’ Share PlansGlue and seal along the edgeTotal Number of Shares HeldSignature(s) or Common Seal of Member(s)Date286 Powering the Future
Notes:1. Please insert the total number of shares held by you. If you have shares entered against your name in the Depository Register (as defined in Section 130A of theCompanies Act, Chapter 50 of Singapore), you should insert that number of shares. If you have shares registered in your name in the Register of Members, youshould insert that number of shares. If you have shares entered against your name in the Depository Register and shares registered in your name in the Registerof Members, you should insert the aggregate number of shares entered against your name in the Depository Register and registered in your name in the Registerof Members. If no number is inserted, the instrument appointing a proxy or proxies shall be deemed to relate to all the shares held by you.2. A member entitled to attend and vote at a meeting of the Company is entitled to appoint one or two proxies to attend and vote instead of him. Where amember appoints two proxies, the appointments shall be invalid unless he specifies the proportion of his holding (expressed as a percentage of the whole) tobe represented by each proxy.3. The instrument appointing a proxy or proxies must be deposited at the office of the Company’s Registrar, M & C Services Private Limited, 112 Robinson Road#05-01, Singapore 068902 not less than 48 hours before the time appointed for the Annual General Meeting.1st FOLD4. The instrument appointing a proxy or proxies must be under the hand of the appointor or of his attorney duly authorised in writing. Where the instrumentappointing a proxy or proxies is executed by a corporation, it must be executed either under its seal or under the hand of an officer or attorney duly authorised.5. A corporation which is a member may authorise by resolution of its directors or other governing body such person as it thinks fit to act as its representative atthe Annual General Meeting, in accordance with Section 179 of the Companies Act, Chapter 50 of Singapore.6. The Company shall be entitled to reject the instrument appointing a proxy or proxies if it is incomplete, improperly completed or illegible or where the trueintentions of the appointor are not ascertainable from the instructions of the appointor specified in the instrument appointing a proxy or proxies. In addition, inthe case of members whose shares are entered against their names in the Depository Register, the Company may reject any instrument appointing a proxy orproxies lodged if such members are not shown to have shares entered against their names in the Depository Register 48 hours before the time appointed forholding the Annual General Meeting as certified by the Central Depository (Pte) Limited to the Company.2nd FOLDBUSINESS REPLY SERVICEPERMIT NO. 06735Postage will bepaid by addressee.For posting inSingapore only.The Company Secretary<strong>Sembcorp</strong> Industries Ltdc/o M & C Services Private Limited112 Robinson Road #05-01Singapore 0689023rd FOLD