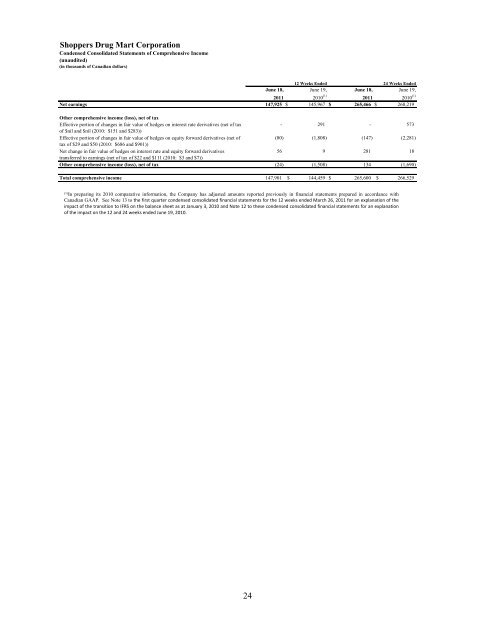
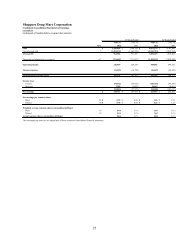
<strong>Shoppers</strong> <strong>Drug</strong> <strong>Mart</strong> Corporation Condensed Consolidated <strong>Statements</strong> <strong>of</strong> Comprehensive Income (unaudited) (in thousands <strong>of</strong> Canadian dollars) 12 Weeks Ended June 18, June 19, 24 Weeks Ended June 18, June 19, 2011 2010 (1) 2011 2010 (1) Net earnings 147,925 $ 145,967 $ 265,466 $ 268,219 Other comprehensive income (loss), net <strong>of</strong> tax Effective portion <strong>of</strong> changes in fair value <strong>of</strong> hedges on interest rate derivatives (net <strong>of</strong> tax - 291 - 573 <strong>of</strong> $nil and $nil (2010: $151 and $283)) Effective portion <strong>of</strong> changes in fair value <strong>of</strong> hedges on equity forward derivatives (net <strong>of</strong> (80) (1,808) (147) (2,281) tax <strong>of</strong> $29 and $50 (2010: $686 and $901)) Net change in fair value <strong>of</strong> hedges on interest rate and equity forward derivatives 56 9 281 18 transferred to earnings (net <strong>of</strong> tax <strong>of</strong> $22 and $111 (2010: $3 and $7)) Other comprehensive income (loss), net <strong>of</strong> tax (24) (1,508) 134 (1,690) Total comprehensive income 147,901 $ 144,459 $ 265,600 $ 266,529 (1) In preparing its 2010 comparative information, the Company has adjusted amounts reported previously in financial statements prepared in accordance with Canadian GAAP. See Note 13 to the first quarter condensed consolidated financial statements for the 12 weeks ended March 26, 2011 for an explanation <strong>of</strong> the impact <strong>of</strong> the transition to IFRS on the balance sheet as at January 3, 2010 and Note 12 to these condensed consolidated financial statements for an explanation <strong>of</strong> the impact on the 12 and 24 weeks ended June 19, 2010. 24
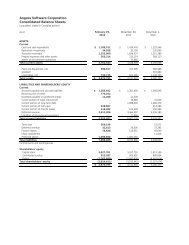
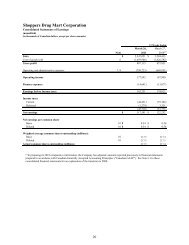
<strong>Shoppers</strong> <strong>Drug</strong> <strong>Mart</strong> Corporation Condensed Consolidated Balance Sheets (unaudited) (in thousands <strong>of</strong> Canadian dollars) June 18, January 1, June 19, January 3, Note 2011 2011 (1)(2) 2010 (1)(2) 2010 (1)(2) Current assets Cash $ 95,644 $ 64,354 $ 62,670 $ 44,391 Accounts receivable 412,954 432,089 486,362 470,935 Inventory 1,902,003 1,957,525 1,830,207 1,852,441 Income taxes recoverable 30,189 20,384 25,435 - Prepaid expenses and deposits 56,932 68,468 57,332 74,206 Total current assets 2,497,722 2,542,820 2,462,006 2,441,973 Non-current assets Property and equipment 1,717,219 1,690,110 1,590,063 1,547,725 Goodwill 2,498,495 2,493,108 2,493,037 2,483,430 Intangible assets 267,701 272,217 261,377 258,766 Other assets 24,471 19,678 17,453 16,716 Deferred tax assets 23,252 26,264 28,337 28,456 Total non-current assets 4,531,138 4,501,377 4,390,267 4,335,093 Total assets $ 7,028,860 $ 7,044,197 $ 6,852,273 $ 6,777,066 Liabilities Bank indebtedness $ 246,417 $ 209,013 $ 256,497 $ 270,332 Commercial paper - 127,828 183,590 260,386 Accounts payable and accrued liabilities 907,482 1,002,806 981,901 981,840 Income taxes payable - - - 17,046 Dividends payable 8 54,368 48,927 48,922 46,748 Current portion <strong>of</strong> long-term debt 249,612 - - - Associate interest 3(a) 129,260 138,993 120,041 130,189 Total current liabilities 1,587,139 1,527,567 1,590,951 1,706,541 Long-term debt 694,935 943,412 945,651 946,098 Other long-term liabilities 473,077 457,607 421,673 400,955 Deferred tax liabilities 25,207 23,064 22,681 21,676 Total long-term liabilities 1,193,219 1,424,083 1,390,005 1,368,729 Total liabilities 2,780,358 2,951,650 2,980,956 3,075,270 Shareholders' equity Share capital 8 1,521,417 1,520,558 1,519,944 1,519,870 Contributed surplus 10 9,934 11,702 11,036 10,274 Accumulated other comprehensive loss (8,509) (8,643) (2,815) (1,125) Retained earnings 2,725,660 2,568,930 2,343,152 2,172,777 Total shareholders' equity 4,248,502 4,092,547 3,871,317 3,701,796 Total liabilities and shareholders' equity $ 7,028,860 $ 7,044,197 $ 6,852,273 $ 6,777,066 (1) In preparing its 2010 comparative information, the Company has adjusted amounts reported previously in financial statements prepared in accordance with Canadian GAAP. See Note 13 to the first quarter condensed consolidated financial statements for the 12 weeks ended March 26, 2011 for an explanation <strong>of</strong> the impact <strong>of</strong> the transition to IFRS on the balance sheet as at January 3, 2010 and Note 12 to these condensed consolidated financial statements for an explanation <strong>of</strong> the impact on the balance sheet as at January 1, 2011 and June 19, 2010. (2) The Company has reclassified the Associate interest balance from long-term liabilities to current liabilities and has reflected this change in the comparative balance sheets. See Note 3(a) for further discussion. 25