English - Alps Know-How - Cipra
English - Alps Know-How - Cipra
English - Alps Know-How - Cipra

Create successful ePaper yourself
Turn your PDF publications into a flip-book with our unique Google optimized e-Paper software.
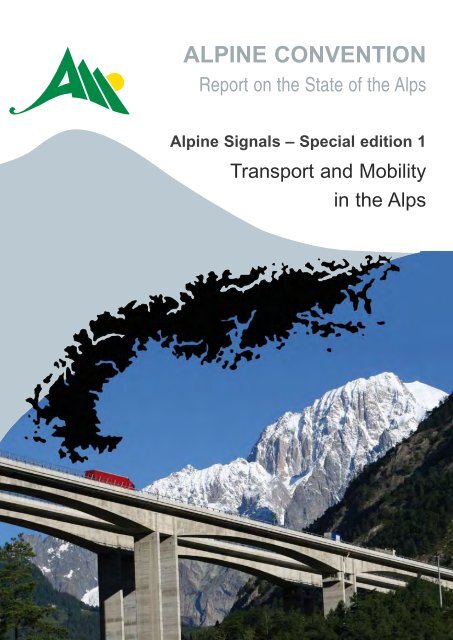
Alpine Convention<br />
Report on the State of the <strong>Alps</strong><br />
Alpine Signals – Special edition 1<br />
Transport and Mobility<br />
in the <strong>Alps</strong>
Permanent Secretariat of the Alpine Convention<br />
www.alpconv.org<br />
info@alpconv.org<br />
Office:<br />
Herzog-Friedrich-Straße 15<br />
A-6020 Innsbruck<br />
Austria<br />
Branche office:<br />
Drususallee 1<br />
I-39100 Bozen<br />
Italy<br />
Imprint<br />
Editor:<br />
Permanent Secretariat of the Alpine Convention<br />
Herzog-Friedrich-Straße 15<br />
A-6020 Innsbruck<br />
Austria<br />
Responsible for the publication series:<br />
Dr. Igor Roblek, Permanent Secretariat of the Alpine Convention<br />
Graphical design:<br />
Ingenhaeff-Beerenkamp, Absam (Austria)<br />
Ifuplan, Munich (Germany)<br />
Cover photo: Marco Onida<br />
© Permanent Secretariat of the Alpine Convention, Innsbruck, 2007 (if not indicated different).
Alpine Convention<br />
Report on the State of the <strong>Alps</strong><br />
Alpine Signals – Special edition 1<br />
Transport and Mobility in the <strong>Alps</strong>
The present document has been established under the coordination of the Permanent Secretariat of the Alpine Convention<br />
involving an “Integration Group” composed by experts from different Member Countries of the Alpine Convention. Based on<br />
discussions in this group, the different chapters have been drafted by different authors. The Working Group “RSA/SOIA” and the<br />
Working Group “Transport” have accompanied the drafting process. National delegations have provided extensive comments on<br />
previous drafts. The Permanent Secretariat thanks all persons involved for their intensive cooperation.<br />
The Integration Group was composed by:<br />
• Austria: Bernhard Schwarzl (UBA Wien), he was helped by several collaborators: a.o. A. Kurzweil, G. Banko, A. Bartel,<br />
C. Nagl, W. Spangl; Irene Brendt (Austrian Presidency),<br />
• Germany: Stefan Marzelli (ifuplan) and Konstanze Schönthaler (Bosch & Partner), involving also Claudia Schwarz and<br />
S. v. Andrian-Werburg,<br />
• Italy: Paolo Angelini (Ministero dell’Ambiente, della tutela del territorio e del Mare – DG RAS) who coordinated several<br />
authors, mainly Luca Cetara (EURAC-Bolzano), Flavio Ruffini (EURAC-Bolzano) and Massimo Santori (CSST-Roma),<br />
• Presidency of WG “Transport”: Marie-Line Meaux and Catherine Ferreol.<br />
The editing and the map layout was executed by ifuplan (Stefan Marzelli, Claudia Schwarz, Florian Lintzmeyer, Martin Kuhlmann<br />
and Sigrun Lange). An <strong>English</strong> proof read was carried out by Isabel Kirkwood, Great Britain.<br />
Data status: Only data delivered until May-July 2006 could be considered for this report due to the overall time schedule. In<br />
detail the data status is indicated in the according tables, figures and maps.<br />
Responsibilities<br />
Responsible<br />
Chapter authors<br />
Introduction Permanent Secretariat R. Schleicher-Tappeser<br />
A The Alpine Transport System Germany / Austria / Italy S. Marzelli, N. Ibesich and M. Santori<br />
A1 Transport Infrastructure Austria A. Kurzweil and N. Ibesich<br />
A2 Freight Transport Italy M. Santori<br />
A3 Passenger Transport Austria A. Kurzweil, N. Ibesich<br />
B Driving Forces of Mobility & Transport Italy F. Ruffini<br />
B1 Population in the <strong>Alps</strong> Italy F. Ruffini, Ch. Hoffmann, Th. Streifeneder,<br />
G. Zanolla<br />
B2 The Alpine and European Economy Italy F. Ruffini, Ch. Hoffmann, Th. Streifeneder,<br />
G. Zanolla, L. Cetara<br />
B3 The Change in Land Use Austria A. Bartel, G. Banko<br />
B4 Tourism and Transport Germany K. Schönthaler, S. v. Andrian-Werburg<br />
C Effects of Transport & Mobility in the <strong>Alps</strong> Permanent Secretariat R. Schleicher-Tappeser<br />
C1 Economic Effects Italy L. Cetara<br />
C2 Effects in the Social Sphere Italy F. Ruffini, Ch. Hoffmann, Th. Streifeneder,<br />
G. Zanolla<br />
C3.1 Air quality Austria / Germany K. Schönthaler, C. Nagl, W. Spangl<br />
C3.2 Noise – the health aspect Germany S. Marzelli, C. Schwarz<br />
D1-D8 Relevant Traffic Policies Working Group Transport M. Meaux, C. Ferreol<br />
for the <strong>Alps</strong> and the AC<br />
(France)<br />
E1 Conclusions and Synthesis Germany S. Marzelli based on contributions of K. Schönthaler,<br />
in View of Sustainable Mobility Italy S. v. Andrian-Werburg, F. Ruffini, Th. Streifeneder,<br />
Austria<br />
Ch. Hoffmann, G. Zanolla, L. Cetara, B. Schwarzl,<br />
A. Kurzweil, N. Ibesich, A. Banko, A.Bartel, C. Nagl,<br />
and W. Spangl<br />
E2 The Main Challenges for the Future Permanent Secretariat / R. Schleicher-Tappeser, M. Meaux<br />
Working Group Transport
For the drafting of the Report the authors have used data provided by public and private institutions. A special thank goes to:<br />
Austria<br />
• Umweltbundesamt,<br />
• Statistik Austria,<br />
• Bundesministerium für Land- und Forstwirtschaft, Umwelt und Wasserwirtschaft, and<br />
• Bundesministerium für Verkehr, Innovation und Technologie.<br />
France<br />
• INSEE et Institut français de l‘environnement (IFEN), Jacques Moreau,<br />
• Ministère de l‘Ecologie, du Développement et de l‘Aménagement Durables (MEDAD):<br />
» Conseil Général des Ponts, Jean Lafont,<br />
» Direction des études économiques et de l‘évaluation environnementale, Armelle Giry,<br />
» CERTU, J.Salager, and<br />
• SETRA: CETE de LYON , Département Infrastructures et Transport, Groupe Transport Economie, Michael Potier.<br />
Germany<br />
Italy<br />
• Bayerisches Staatsministerium für Umwelt, Gesundheit und Verbraucherschutz: Karlheinz Weißgerber,<br />
• Bayerisches Landesamt für Statistik und Datenverarbeitung: Blasius Schmidl, Roland Heitzer and Peter Dotzaue,<br />
• Bayerisches Staatsministerium für Wirtschaft, Infrastruktur, Verkehr und Technologie: Dr. Reinhold Koch,<br />
• Bayerisches Landesamt für Umwelt: Markus Meindl and Michael Gerke,<br />
• Bundesministerium für Verkehr, Bau und Stadtentwicklung: Dr. Ernst Albrecht Marburger, and<br />
• Autobahndirektion Südbayern: Herr F. Wolferstetter.<br />
• Agenzia per la Protezione dell’Ambiente e i servizi tecnici (APAT): M. Cirillo, A. Franchi, A. Gaeta, S. Lucci, M. Pantaleoni,<br />
• Accademia Europea di Bolzano – EURAC Research: F.V. Ruffini,<br />
• Istituto Nazionale di Statistica (ISTAT) – Dip. per la produzione statistica e il coordinamento tecnico-scientifico: N. Mignolli,<br />
P. Leonardi,<br />
• Ministero delle infrastrutture e dei trasporti: R. Napolitano, and<br />
• Ministero dell’Ambiente, della tutela del territorio e del Mare – Ufficio statistico – DG RAS: C. Terzani.<br />
Liechtenstein<br />
• Amt für Wald, Natur und Landschaft: Hermann Schmuck,<br />
• Amt für Volkswirtschaft: Harry Winkler and<br />
• Stabstelle für Landesplanung: Remo Looser.<br />
Switzerland<br />
• Bundesamt für Umwelt: Klaus Kammer & Peter Böhler,<br />
• Bundesamt für Statistik: Geoinformation: Anton Beyeler; Sektion Bevölkerung und Migration: Marcel Heininger; Sektion<br />
Tourismus; Sektion Arealstatistik; Sektion Betriebszählungen and Sektion Landwirtschaftliche Betriebszählungen,<br />
• Bundesamt für Verkehr: Walter Züst,<br />
• ETH Zurich, Departement für Umweltwissenschaften: Prof. Jochen Jaeger, and<br />
• Bundesamt für Raumentwicklung: Mr. Davide Marconi and Kontrollstelle IKSS.<br />
Slovenia<br />
• Ministry of the Environment and Spatial Planning, Spatial Planning Directorate,<br />
• Ministry of Transport,<br />
• Environmental Agency of the Republic of Slovenia and<br />
• The Statistical Office of the Republic Slovenia.
Contents<br />
Figures<br />
IX<br />
Tables<br />
XI<br />
Maps<br />
XII<br />
Abbreviations<br />
XIII<br />
Preface<br />
XV<br />
Introduction 1<br />
A The Alpine Transport System 5<br />
A1 Transport Infrastructure 10<br />
A1.1 Importance and role of transport infrastructure in the <strong>Alps</strong> 10<br />
A1.2 Road infrastructure 11<br />
A1.3 Rail infrastructure 15<br />
A1.4 Bottlenecks 18<br />
A2 Freight Transport 20<br />
A2.1 Freight transport and modal split development 20<br />
A2.2 Freight road transport 21<br />
A2.3 Freight rail transport 24<br />
A2.4 Main problems of road freight transport 24<br />
A2.5 Main problems of rail freight transport 25<br />
A3 Passenger Transport 27<br />
A3.1 Importance and role of passenger transport in the <strong>Alps</strong> 27<br />
A3.2 Some views on the modes of passenger transport 27<br />
A3.3 Individual motorised transport 29<br />
A3.4 Public transport 30<br />
B Driving Forces of Mobility and Transport 35<br />
B1 Population in the <strong>Alps</strong> 36<br />
B1.1 Demographic development 36<br />
B1.2 Population density and area of permanent settlement 41<br />
B1.3 Migration 43<br />
B2 The Alpine and European Economy 46<br />
B2.1 Accessibility and economic development: a complex relationship 46<br />
B2.2 The economic progress in the Alpine arc 47<br />
B2.3 Disparities in economic development 49<br />
B2.4 The situation of agriculture 54<br />
B3 The Change in Land Use 57<br />
B3.1 Spatial development processes in the <strong>Alps</strong> 57<br />
B3.2 Development of areas for settlement and transport infrastructure at national level 58<br />
B3.3 Regional differences in land-use development 59<br />
B3.4 Land-use transformation to the detriment of agricultural area 62<br />
B4 Tourism and Transport 64<br />
B4.1 A driving force behind traffic 64<br />
B4.2 Measuring tourism, traffic and their interrelations 64<br />
B4.3 Tourism centres and transport infrastructures in the <strong>Alps</strong> 65<br />
B4.4 Development of tourism demand 67<br />
B4.5 Tourism and traffic volumes 68<br />
VII
C Effects of Transport and Mobility in the <strong>Alps</strong> 73<br />
C1 Economic Effects 74<br />
C1.1 Trends of inter-regional trade in the Alpine space 74<br />
C1.2 Effects of transport enhancing development and economy 74<br />
C1.3 Adverse economic effects 76<br />
C1.4 Transport and development in the <strong>Alps</strong>: towards the identification of a trend for the Alpine countries? 77<br />
C1.5 External costs of transport from an economic perspective 79<br />
C2 Effects in the Social Sphere 83<br />
C2.1 Accessibility and social equity 83<br />
C2.2 The ageing population 84<br />
C3 Environmental and Health Effects 90<br />
C3.1 Air quality 90<br />
C3.2 Noise – the health aspect 98<br />
D Relevant Traffic Policies for the <strong>Alps</strong> and the Alpine Cooperation 107<br />
D1 The Transport Agenda of the Alpine Convention 108<br />
D2 The Framework for Action by the Alpine Countries: the Cooperating Bodies 109<br />
D2.1 The Alpine Convention Transport Working Group 109<br />
D2.2 The Zurich Declaration Monitoring Group 109<br />
D2.3 The process of bi- or multi-lateral cooperation on specific projects 109<br />
D3 EU-Directives Adopted or in the Process of Adoption 110<br />
D4 National Policies on Transport Infrastructure Programmes 113<br />
D5 Development of Alpine Transport Infrastructure 115<br />
D5.1 Road infrastructure policies 115<br />
D5.2 Rail infrastructure policies 115<br />
D6 The Transport of Freight through the <strong>Alps</strong>, a major Concern 117<br />
D6.1 The management and regulation of road freight traffic 117<br />
D6.2 Identification of optimum pricing for freight transport 118<br />
D6.3 Optimization of rail corridors 119<br />
D6.4 Offering alternatives using sea and river modes 119<br />
D7 Encouraging Sustainable Mobility for the Population in the Alpine Space 121<br />
D7.1 Sustainable mobility of passengers in and around Alpine communities 121<br />
D7.2 Sustainable mobility of passengers in access to tourist sites 123<br />
D8 Improving Transport in the <strong>Alps</strong>: some European Success Stories 125<br />
D8.1 Digest of current INTERREG projects 125<br />
D8.2 Insight in selected INTERREG projects 125<br />
E Main Conclusions for the <strong>Alps</strong> 127<br />
E1 Conclusions and Synthesis in View of Sustainable Mobility 127<br />
E1.1 The transport system 127<br />
E1.2 Economy, tourism and economic effects 129<br />
E1.3 Population and effects on the social sphere 130<br />
E1.4 Land use change and environmental effects 133<br />
E1.5 Synthesis 134<br />
E2 The Main Challenges for the Future 136<br />
E2.1 Overall objectives and frame conditions 136<br />
E2.2 Providing services in the framework of sustainable development 136<br />
E2.3 The need for integrated approaches 139<br />
E2.4 Towards a common Alpine transport policy for the next ten years 140<br />
Annex 143<br />
VIII
Figures<br />
Fig. A-1: Scheme of transport typology. 7<br />
Fig. A1-1: Regressive effect of special toll on the Brenner route 2004 on HDV transport costs. 15<br />
Fig. A1-2: Comparison of road pricing on Alpine crossing routes. 15<br />
Fig. A2-1: Total transport traffic flows (road and rail) crossing the Alpine Arc by country. 20<br />
Fig. A2-2: Alpine arc A,B,C. 20<br />
Fig. A2-3: Alpine-crossing transport volume 1994, 1999 and 2004. 20<br />
Fig. A2-4: Modal split by Alpine countries in 2004. 20<br />
Fig. A2-5: Number of vehicle movements on Alpine arc C by Alpine country. 21<br />
Fig. A2-6: Development of road freight traffic by Alpine crossing. 22<br />
Fig. A2-7: Total road transport volumes on Alpine crossings in 1994, 1999 and 2004. 22<br />
Fig. A2-8: Rate of freight transit traffic in relation to Alpine-crossing transit road traffic. 22<br />
Fig. A2-9: Distribution of Alpine-crossing transit freight traffic on main Alpine crossings in 2003. 22<br />
Fig. A2-10: Volumes of road freight traffic on main Alpine passes: bi-directional flows in 2004. 22<br />
Fig. A2-11: Volumes of road freight traffic on main Alpine roads: bi-directional flows in 2004. 23<br />
Fig. A2-12: Rail transport volume crossing the Alpine arc in Mio tonnes for 1994, 1999 and 2004. 24<br />
Fig. A2-13: Rail transport volumes on Alpine crossings for 1994, 1999 and 2004. 24<br />
Fig. A3‐1: Different modal split (by routes travelled) in Switzerland in Alpine and non-Alpine regions in 2000. 28<br />
Fig. A3‐2: Modal split in different types of area as shown by the example of Innsbruck/A and its surroundings in 2002. 28<br />
Fig. A3‐3: Modal split development as shown by the example of Ticino, Switzerland. 28<br />
Fig. A3‐4: Car traffic in the <strong>Alps</strong>. 29<br />
Fig. A3‐5: Development of car traffic 1995 – 2005. 29<br />
Fig. A3‐6: Passenger transport across the <strong>Alps</strong> for 2004/2005. 30<br />
Fig. A3‐7: Purpopse of passenger transport across the <strong>Alps</strong> in Switzerland. 30<br />
Fig. A3‐8: Development of passenger transport by rail in France. 31<br />
Fig. A3-9: Total distance driven yearly by Postbus in Mio km per year. 32<br />
Fig. B1‐1: Relative area distribution in the <strong>Alps</strong> at different altitudes. 41<br />
Fig. B2-1: The number of inhabitants accessible within the time-frame of one hour in the <strong>Alps</strong>. 46<br />
Fig. B2-2: The relation of employees in the transport sector to all employees. 49<br />
Fig. B2-3: Per capita Gross Domestic Product (GDP) in the Alpine Convention area. 51<br />
Fig. B2-4: Growth of real GDP in the regions of the Alpine arc. 53<br />
Fig. B3‐1: Relative change in settlement and traffic infrastructure area. 58<br />
Fig. B3‐2: Settlement and traffic infrastructure area per PSA. 58<br />
Fig. B3-3: Land use change in NUTS-2 regions. 63<br />
Fig. B4‐1: Tourism intensity in Alpine municipalities. 65<br />
Fig. B4-2: Second home intensity (beds/inhabitant) in French Alpine municipalities in 1999. 65<br />
Fig. B4‐3a-c: Development of tourist nights spent, arrivals and duration of tourist stays. 67<br />
Fig. B4‐4: Average daily traffic volumes (ADTV) in 2003 at the Brenner Pass. 68<br />
Fig. B4‐5: Seasonality of selected tourism centres in 2005. 69<br />
Fig. B4‐6: Average daily traffic volumes (ADTV) of passenger transport in 2004. 70<br />
Fig. C1-1: Transport growth in EU-25 with respect to passengers, goods and GDP. 78<br />
Fig. C1-2: Elasticity of transport demand with respect to fuel price. 78<br />
Fig. C1-3: Components of transport costs. 79<br />
Fig. C1-4: Composition of external costs of transport in EU-15 plus Norway and Switzerland by transport mode. 80<br />
Fig. C1-5: Composition of external costs of transport in EU-15 plus Norway and Switzerland by cost category. 80<br />
Fig. C2-1: Old-age index in Alpine Convention regions. 85<br />
IX
Fig. C3‐1: Annual means of NO 2<br />
on traffic stations in the <strong>Alps</strong>. 92<br />
Fig. C3‐2: Annual means of NO 2<br />
on traffic stations in the <strong>Alps</strong>. 93<br />
Fig. C3‐3: Percentage of stations showing where the future European limit value for NO 2<br />
were exceeded at all stations. 93<br />
Fig. C3‐4: Percentage of traffic stations in the <strong>Alps</strong> exceeding the European short-term limit value for NO 2<br />
. 93<br />
Fig. C3‐5: Trend of NOx emissions and concentrations at highways in Alpine valleys. 94<br />
Fig. C3‐6: Summer averages at background and traffic stations in the <strong>Alps</strong>. 95<br />
Fig. C3‐7:<br />
Fig. C3‐8:<br />
Percentage of background stations showing where the European limit value for O 3<br />
for the protection<br />
of human health (120 µg/m³ as maximum daily 8-hour mean value) has been exceeded at all stations. 95<br />
Percentages of background stations in the <strong>Alps</strong> deviating from the European target value for the<br />
protection of the vegetation (AOT). 95<br />
Fig. C3‐9: Number of days exceeding or reaching the threshold of 180 µg/m³ on background stations in the <strong>Alps</strong>. 96<br />
Fig. C3‐10: Maximum, mean and minimum annual mean value of the PM10 annual mean value (period 2001–2005). 96<br />
Fig. C3-11: Overall interrelation of human health and transport effects. 98<br />
Fig. C3-12: Sound pressure and human perception. 98<br />
Fig. C3‐13: Conceptual model representing relation between noise exposure, health and quality of life. 99<br />
Fig. C3‐14: Noise propagation. 100<br />
Fig. C3-15: Noise spread in mountainous areas. 100<br />
Fig. C3‐16: Measure points for road noise emission in Switzerland MFM-U. 101<br />
Fig. C3‐17: Swiss measure points monitoring railway noise. 101<br />
Fig. C3‐18: Pilot maps from the Swiss LDBS, area of Luzern displaying road noise and railway noise. 102<br />
Fig. C3‐19: Noise abatement expenditure on the existing highway and federal road system. 103<br />
Fig. D1-1: Structure of the Alpine Convention. 108<br />
Fig. D5‐1: The four rail tunnels currently under construction. 115<br />
Fig. E1.1: Dimensions of sustainable development. 127<br />
Fig. E1-2: Circle of demographic change and public services. 132
Tables<br />
Tab. A1-1: Main Alpine road corridors. 11<br />
Tab. A1-2: Main roads in relation to area and population of Alpine Convention perimeter. 11<br />
Tab. A1-3: Accidents in Mont Blanc, St. Gotthard and Tauern tunnel. 13<br />
Tab. A1-4: Road pricing in the Alpine countries. 14<br />
Tab. A1-5: Fuel price differences in the Alpine countries in EUR. 15<br />
Tab. A1-6: Taxes adopted in the Alpine countries as a response to transport pressure. 15<br />
Tab. A1-7: Railway lines per country. 16<br />
Tab. A3‐1: The least and most frequented rail connections presented as trains per day for 2006. 31<br />
Tab. B1‐1: Population change and density in the Alpine Convention area during the 1990s. 36<br />
Tab. B1‐2: Overview of municipality types and the population structure. 38<br />
Tab. B1‐3: Overview of the growth of the Alpine metropolises and their agglomerations in the Alpine Convention area. 40<br />
Tab. B1‐4: Population density in some Alpine regions 43<br />
Tab. B2-1: Share of employed persons aged 15 and over by economic activity 2005. 48<br />
Tab. B2-2: The ten regions with the highest Gross Domestic Product (GDP) in the Alpine Convention area. 51<br />
Tab. B2-3: The ten regions with the lowest Gross Domestic Product (GDP) in the Alpine Convention area. 52<br />
Tab. B3‐1: Land-use change per year in percent of initial area of the start year. 62<br />
Tab. B4‐1: Selected transport measuring stations. 69<br />
Tab. C1-1: Main Alpine origins and destinations for road transport of freight and GDP. 74<br />
Tab. C1-2: List of main Alpine tunnel projects and costs. 75<br />
Tab. C1-3: External costs of freight transport evaluated on the basis of main European studies. 80<br />
Tab. C2-1: The share of over-aged people in the Alpine Convention area. 85<br />
Tab. C2-2: Old-age index of the municipalities of the Alpine Convention. 87<br />
Tab. C2-3: Old-age index of the most populated municipalities. 87<br />
Tab. C2-4: Municipalities with an old-age index above and below 100. 88<br />
Tab. C3‐1: EU ambient air quality limit and target values, thresholds. 92<br />
Tab. C3‐2: Stations which exceeded the limit values plus margin of tolerance between 2000 and 2005. 93<br />
Tab. C3‐3: Noise immission by road traffic in Austria. 102<br />
Tab. C3‐4: Inhabitants affected by railway noise in Austria. 102<br />
Tab. C3‐5: Noise abatement expenditures along federal roads in Austria. 103<br />
Tab. C3‐6: Compilation of threshold. 104<br />
Tab. E1-1: Population growth, comparison between Europe and <strong>Alps</strong> (1994–2004). 131<br />
Tables in the Annex<br />
Annex A2-1: Modal split of freight transport of selected Alpine countries in Mio tonnes per year. 143<br />
Annex A2-2: Road and rail transport volumes on Alpine crossings in Mio tonnes. 143<br />
Annex A2-3: Road and rail crossing transit traffic in 2004 in Mio tonnes. 143<br />
Annex A2-4: Share of Alpine crossings in total cross-Alpine freight traffic on roads in 2004. 143<br />
Annex A2-5: Freight traffic flows on main Alpine motorways. 143<br />
Annex A2-6: Alpine NUTS-2 regions as origin and destination of traffic. 144<br />
Annex A2-7: NUTS-2 regions with highest volumes of generated traffic. 144<br />
Annex A2-8: Rail transport O/D-pairs with highest volumes. 145<br />
Annex A2-9: Number of vehicle movements between Italian NUTS-2 regions and Alpine countries in 2004. 145<br />
Annex A2-10: Freight traffic on Slovenian Alpine border crossings. 145<br />
Annex B3-1: Data sources and basic method by nation. 146<br />
XI
Maps<br />
Map A1-1: Road network and main Alpine passes and tunnels. 12<br />
Map A1-2: Density of main road network in relation to population (on NUTS-3 level). 12<br />
Map A1-3: Rail network in the <strong>Alps</strong>. 16<br />
Map A1-4: Density of rail network in relation to population (on NUTS-3 level). 17<br />
Map B1‐1: Population trend in Alpine municipalities between 1990 and 2001. 37<br />
Map B1‐2: Metropolises and their agglomerations in the Alpine arc. 40<br />
Map B1‐3: Population density in Alpine municipalities (inhabitants per km²). 42<br />
Map B1‐4: The migration balance in Alpine municipalities between 1990 and 1999. 44<br />
Map B2-1: Gross domestic product (GDP) per capita in the Alpine Convention area (on NUTS-3 level). 50<br />
Map B2-2: Unemployment rate in the Alpine Convention area in 2004/2005 (on NUTS-3 level). 53<br />
Map B2-3: Relative change in the number of farms in Alpine Convention area between 1990 and 2000 (on NUTS-3 level). 54<br />
Map B3‐1: Relative annual change in settlement and traffic infrastructure area on LAU-2 level. 59<br />
Map B3‐2: Relative annual change in cultivated area (on NUTS-3 level). 60<br />
Map B3‐3: Relative annual change in forest area (on NUTS-3 level). 61<br />
Map B3‐4: Absolute annual change in settlement and traffic infrastructure area change (on NUTS-3 level). 61<br />
Map B4-1: Tourism intensity (number of tourist beds per resident population) in Alpine municipalities. 66<br />
Map B4-2: Number of tourist arrivals in Austria. 69<br />
Map C2-1: Old-age index in Alpine municipalities. 86<br />
Map C3‐1: Air quality measuring stations (classification according to Directive 2001/752/EC). 91<br />
Map C3‐2: Major road sections with more than 6 Mio vehicle passages a year (German AC area). 101<br />
XII
Abbreviations<br />
AC<br />
Alpine Convention<br />
ADTV Average Daily Traffic Volumes<br />
AMS Arbeitsmarktservice Österreich<br />
AMSL Above Mean Sea Level<br />
AOT Accumulated Exposure Over a Threshold<br />
APAT L’Agenzia per la protezione dell’ambiente e per i servizi tecnici (Italian Agency for Environmental Protection<br />
and Technical Services)<br />
ARE Bundesamt für Raumentwicklung (Swiss Federal Office for Spatial Development)<br />
ASFINAG Autobahnen- und Schnellstrassenfinanzierungsaktiengesellschaft [Interstate and Highway Financing Inc. (AT)]<br />
AT<br />
Austria<br />
AVW Amt für Volkswirtschaft, Liechtenstein<br />
AWNL Amt für Wald, Natur und Landschaft, Liechtenstein<br />
BAG Bundesamt für Güterverkehr in Deutschland<br />
BEV Bundesamt für Eich- und Vermessungswesen in Österreich (Austrian Federal Office for Calibration and<br />
Measurement)<br />
BFS Bundesamt für Statistik in der Schweiz (Swiss Federal Statistical Office)<br />
BGA Bundesverband des Deutschen Groß- und Außenhandels (German Federal Office for Goods Transport)<br />
BLS Berner Alpenbahngesellschaft Bern–Lötschberg–Simplon (Bernese Alpine Rail Company)<br />
BMVIT Bundesministerium für Verkehr, Innovation und Technologie, Austria<br />
BRAVO Brenner Rail Freight Action Strategy Aimed at Achieving a Sustainable Increase of Intermodal Transport Volume<br />
by Enhancing Quality, Efficiency and System Technologies<br />
BBT SE Brenner Basistunnel Societas Europaea (European Corporation Brenner Base Tunnel)<br />
CAFT Cross-Alpine Freight Traffic<br />
cfr.<br />
Cross-reference<br />
CH<br />
Switzerland<br />
CHF Swiss Francs (Conversion rate as of 1 July 2006: 1 CHF = 0.63849 EUR)<br />
CIG Commission Inter-Gouvernementale (Intergovernmental Commission)<br />
cp.<br />
Compare<br />
CSST Centro Studi sui Sistemi di Trasporto (Italian Center for the Study of Transport Systems)<br />
DB<br />
Deutsche Bahn AG (German Federal Railway)<br />
DE<br />
Germany<br />
DETEC Swiss Federal Department of Environment, Transport, Energy and Communications<br />
DG TREN European Commission’s Directorate-General for Energy and Transport<br />
EC<br />
European Community<br />
ETCS European Train Control System<br />
EEA European Environmental Agency<br />
EEC European Economic Community<br />
ESPON European Spatial Planning and Observation Network<br />
EU<br />
European Union<br />
EU-15 15 EU Member Countries following the accession of Austria, Finland and Sweden in 1995<br />
EU-25 25 EU Member Countries after the eastward enlargement on 1 May 2004<br />
EUR Euro<br />
EUROSTAT Statistical Office of the European Communities<br />
ETA Estimated Time of Arrival<br />
ETCS European Train Control System<br />
FR<br />
France<br />
FSO Swiss Federal Statistical Office, Switzerland<br />
GDP Gross Domestic Product<br />
GHG Green House Gases<br />
GIS<br />
Geographical Information System<br />
GPS Global Positioning System<br />
HDV Heavy Duty Vehicle<br />
ICT<br />
Information and Communications Technology<br />
IFEN Institut Francais de l´Environnement (Environmental Institute of France)<br />
INEA Istituto Nazionale di Economia Agraria (Italian National Institute for Agricultural Economics)<br />
XIII
INSEE Institut National de la Statistique et des Études Économiques (National Institute for Statistics and Economic<br />
Studies, France)<br />
IQ-C International Group for Improving the Quality of Rail Freight Traffic on the North-South-Corridor<br />
ISTAT Istituto nazionale di statistica (Italian National Institute of Statistics)<br />
IT<br />
Italy<br />
LAU Local Administrative Unit<br />
LDV Light Duty Vehicles<br />
LfStaD Bayerisches Landesamt für Statistik und Datenverarbeitung (Bavarian State Office for Statistics and Data<br />
Processing)<br />
LI<br />
Liechtenstein<br />
LLV<br />
Liechtensteinische Landesverwaltung<br />
LSVA Leistungsabhängige Schwerverkehrsabgabe (Swiss Mileage Related Heavy Vehicle Tax)<br />
LTF<br />
Lyon Turin Ferroviaire<br />
LUCAS Land use and cover area statistical survey; introduced by EUROSTAT in 2000.<br />
MC<br />
Monaco<br />
MRHVT Mileage Related Heavy Vehicle Tax<br />
MoT Margin of Tolerance<br />
NEAT Neue Eisenbahn-Alpentransversalen (Swiss New Rail Link Through the <strong>Alps</strong>)<br />
Nox Nitrogen oxide<br />
NRLA Swiss New Rail Link Through the <strong>Alps</strong> (NEAT)<br />
NUTS Nomenclature of Territorial Units for Statistics<br />
ÖBB Österreichische Bundesbahnen (Austrian Federal Railway)<br />
OD<br />
Origin-Destination<br />
OECD Organisation for Economic Co-operation and Development<br />
p.a.<br />
Per anno (per year)<br />
Pkm Person kilometres<br />
PC<br />
Passenger car<br />
PM10 Particulate Matter < 10 µm<br />
ppb<br />
parts per billion<br />
PPP Public-Private-Partnership<br />
PSA Permanent Settlement Area<br />
RCA Rail Cargo Austria<br />
RFF Réseau Ferré de France (French Federal Railway)<br />
RFI<br />
Rete Ferroviaria Italia (Italian Federal Railway)<br />
SABE Seamless Administrative Boundaries of Europe<br />
SCEES Service Central des Enquêtes et Études Statistiques, Ministère de l’Agriculture<br />
SI<br />
Slovenia<br />
SME Small and Medium Sized Enterprises<br />
SNCF Société Nationale des Chemins de fer Français (French National Railway Company)<br />
SOIA System for the Observation of and Information on the <strong>Alps</strong><br />
TEN Trans-European Networks<br />
THEPEP Transport, Health and Environment Pan-European Programme<br />
TIPP Taxe intérieure sur les produits pétroliers<br />
Tkm Tonnes kilometres<br />
UBA Wien Umweltbundesamt, Austria<br />
UBA Berlin Umweltbundesamt, Germany<br />
UN-ECE United Nations Economic Commission for Europe<br />
VOC Volatile Organic Compounds<br />
WG EOI Working Group on Environmental Objectives and Indicators<br />
WG T Working Group on Transport<br />
WHO World Health Organisation<br />
XIV
Preface<br />
The Alpine Convention is a multilateral framework treaty, signed<br />
in 1991, between the eight states of the Alpine bow<br />
as well as the European Community. Its main objectives are<br />
the protection of the Alpine territory and the safeguarding of<br />
the interests of the people inhabiting it, embracing the environmental,<br />
social and economic dimensions in the broadest<br />
sense. In order to achieve its objectives, over the years the<br />
framework treaty has been equipped with a large number of<br />
thematic protocols.<br />
As stated in the Multi-Annual Work Programme of the Alpine<br />
Conference for the years 2005–2010, the Report on<br />
the State of the <strong>Alps</strong> is an instrument designed to provide a<br />
broader public with information and appraisals on the main<br />
developments taking place in the <strong>Alps</strong>, and at the same time<br />
it serves as a basis for strategy development for politics and<br />
administration.<br />
This report, published in a special edition series of the “Alpine<br />
Signals”, will be followed by other reports on the State of<br />
the <strong>Alps</strong> on other themes, with the aim of continuing to provide<br />
a dynamic picture of some of the important developments<br />
for the <strong>Alps</strong> and their population. At the time of publication of<br />
this first report, work has already begun on data collection<br />
and analysis in view of the second report, on the subject of<br />
water in the <strong>Alps</strong>.<br />
Marco Onida<br />
Secretary General of the Alpine Convention<br />
The Transport Protocol to the Alpine Convention, adopted<br />
in the year 2000, represents one of the most important<br />
cornerstones of the whole Alpine Convention. This first<br />
Report on the State of the <strong>Alps</strong> addresses coherently the<br />
subject of transport and mobility within the <strong>Alps</strong>, and between<br />
the Alpine space and other European regions, from environmental,<br />
social and economic perspectives.<br />
This report is the result of a joint effort by authors from various<br />
contracting parties and was approved by the IX th Alpine<br />
Conference in 2006 in Alpbach (Austria). It is the outcome<br />
of a complex process of data collection and assessment, as<br />
for the first time Alpine-wide statistical data were provided by<br />
the contracting parties in order to be analysed from a pan-<br />
Alpine perspective. This sometimes revealed inconsistencies<br />
between the data, as well as interpretation difficulties,<br />
but also facilitated discussions, raised awareness and<br />
improved comprehension of the transport dynamics among<br />
the contracting parties.<br />
The final outcome provides readers with a report rich in data,<br />
information and analysis, embracing a wide range of challenges,<br />
which it is hoped will further stimulate the discussions<br />
in the competent political fora. The key questions, not surprisingly,<br />
are all related to the dichotomy between the need to<br />
combine mobility and accessibility with the preservation of<br />
the Alpine environment and the quality of life of the population<br />
living in the <strong>Alps</strong>. Technological development plays an<br />
important role and already provides a set of improvements<br />
to the aforementioned dichotomy. <strong>How</strong>ever, key problems<br />
remain open and important political decisions lie unavoidably<br />
ahead of us. The last part of the report, “Main challenges for<br />
the future”, aims to contribute to the corresponding decisionmaking<br />
process.<br />
The Permanent Secretariat of the Alpine Convention wishes<br />
to thank all authors and representatives of the contracting<br />
parties for their contributions. Special thanks go to Mr<br />
Stefan Marzelli and his collaborators at ifuplan for the valuable<br />
editorial work.<br />
XV
Introduction<br />
Reporting on the state of the <strong>Alps</strong> is an important tool for<br />
developing and monitoring policies for the sustainable development<br />
of the Alpine space. Not by chance this first report<br />
on the state of the <strong>Alps</strong> focuses on transport and mobility.<br />
This introduction will first give some background on the role<br />
of this issue in the Alpine context and then introduce the aim,<br />
the focus and the structure of the present report.<br />
The evolution of the role of transport in the <strong>Alps</strong><br />
Since the beginnings of human history in the <strong>Alps</strong>, transport<br />
has been a central issue. The Romans succeeded in constructing<br />
and securing cross-Alpine roads which guaranteed<br />
the connection to their territories on the other side of the<br />
<strong>Alps</strong>. Likewise, the main valleys, at least on the southern<br />
side of the <strong>Alps</strong>, developed thanks to ensured accessibility.<br />
With the breakdown of the Roman Empire connections became<br />
unsafe, infrastructure partly decayed; settlements in the<br />
<strong>Alps</strong> became isolated and declined. In the boom time of the<br />
High Middle Ages, transport and trade along the valleys and<br />
across the <strong>Alps</strong> again played an important role. <strong>How</strong>-ever,<br />
in the following centuries the development of Alpine cities<br />
lagged behind, mainly because of the transport restrictions of<br />
the Alpine topography: the cultivated area accessible within<br />
a one-day there-and-back journey was only half as large for<br />
a city such as Innsbruck and two thirds as large for Bolzano<br />
compared to that for a city in the plains. Only the introduction<br />
of the railway drastically changed the situation – cities no<br />
longer depend on their immediate surroundings for everyday<br />
supplies.<br />
Facilitation of transport allowed for a strong development of<br />
tourism from the late 19 th century – the <strong>Alps</strong> had become the<br />
romantic symbol for freedom, peacefulness and authenticity,<br />
for the absence of the stress and dirt of industrialised cities<br />
– and led to a further improvement in the transport infrastructure.<br />
Cross-Alpine trade and Industries developed, but also<br />
increasing nationalism and militarisation and corresponding<br />
efforts for fortification boosted the construction of railways.<br />
<strong>How</strong>ever, for most of the Alpine territory access remained<br />
very difficult.<br />
Only some 100 years ago, the introduction of the motor car<br />
started to change the situation completely. Especially mass<br />
motorisation in the last 50 years and heavy investment in the<br />
infrastructure in particular have led to a full integration of the<br />
Alpine economies into the European markets, to rather late –<br />
compared to other regions – but radical changes in lifestyle,<br />
to a decline of Alpine agriculture and to new opportunities for<br />
Alpine locations. Directly (construction, transport services)<br />
and indirectly (tourism, new industries, trade) transport has<br />
led to the creation of new economic activities.<br />
Thanks to the central position of the Alpine mountain range<br />
in European geography, many Alpine regions, which were<br />
once among the most peripheral in Europe, today are in a<br />
rather favourable situation concerning accessibility.<br />
Changes in transport infrastructure and technology have always<br />
had a complex impact on local and overall development,<br />
creating new opportunities and new imbalances. The strong<br />
impact on the environment, however, is a rather new problem<br />
that has arisen already with the railways but acquired a new<br />
dimension with widespread motorised transport and the corresponding<br />
massive infrastructure. Environmental concerns<br />
have raised sharp political debates about Alpine transport in<br />
recent years; often they were associated with a concern for<br />
disappearing ways of life, and the spreading of urban settlement<br />
structures. The huge increase in cross-Alpine freight<br />
transport has met resistance by the Alpine population largely<br />
supported by the population outside the perimeter of the<br />
Alpine Convention.<br />
The concepts of transport and mobility<br />
Transport and mobility are closely linked, but they are not<br />
identical. Transport is a means of changing the location of<br />
people and of goods in order to fulfil different needs, such as<br />
going to school, shopping, meeting colleagues or delivering<br />
industrial products. The extent to which transport is needed to<br />
fulfil these needs depends on many trends and policies which<br />
shape the spatial organisation of society. The use of different<br />
transport modes – walking, bicycle, car, railway, truck, plane<br />
etc. – depends on distance, frequency, availability, degree of<br />
comfort, prices, and – last but not least – habits.<br />
Mobility, on the other hand is a much more abstract and<br />
emotionally charged concept. Mobility is associated with the<br />
freedom of moving, of making experiences, of exchanging<br />
goods and views, of having access to the rest of the world.<br />
Mobility is essential for personal development, for innovation,<br />
for trade, for business, for culture, for everything that<br />
makes up society.<br />
Mobility necessarily involves transport. <strong>How</strong>ever, how much,<br />
and which kind of transport is needed for ensuring a certain<br />
degree of mobility, depends on the spatial organisation of<br />
society, the transport systems and alternative means of communication.<br />
Most people like travelling for fun. <strong>How</strong>ever, in<br />
everyday life there is also much compulsory, unpleasant mobility:<br />
we would often like to avoid commuting, business travel,<br />
driving to a distant office or hospital, shipping goods over<br />
long distances if only jobs, schools, services, clients were<br />
nearby. The different lifestyles and the different structures we<br />
can find in the <strong>Alps</strong> involve very different mobility patterns.<br />
Mobility as opportunity is an important goal in modern societies,<br />
but mobility as obligation should be minimised.<br />
Different structures and interests across the Alpine<br />
space<br />
Given the strong pressure on some main corridors, the accelerated<br />
integration of the European economies, the declining<br />
market share of the railway, steadily increasing passenger<br />
mileage and the considerable costs of transport infrastructure,<br />
transport has for many years been the main political<br />
issue concerning the <strong>Alps</strong>. It is a complex issue for international<br />
negotiation as structures, needs, perspectives and interests<br />
vary considerably between the countries and regions<br />
involved.<br />
1
The main European economic centres are interested in easy<br />
and cheap transit through the <strong>Alps</strong> and therefore have a different<br />
perspective than the Alpine population. Tourism operators<br />
have different interests from freight hauliers. Densely<br />
populated valleys like those in the central <strong>Alps</strong> have completely<br />
different preconditions for public transport and other<br />
needs than large areas in the eastern and especially the<br />
western <strong>Alps</strong> with very few inhabitants. Settlement structures<br />
and tourism patterns differ strongly between the east and the<br />
west. Regions in federal states have more leeway for action<br />
than those in centralised countries. Road operators easily<br />
operate across borders whereas national railways still maintain<br />
different regulatory, tariff and technical systems. The relationship<br />
between direct and indirect costs differs between<br />
the main corridors making comparisons difficult. And finally<br />
the political and economic role of the Alpine population and<br />
the symbolic significance of the <strong>Alps</strong> differs from country to<br />
country.<br />
Therefore, transport is not merely a technical issue. Transport<br />
decisions are intrinsically linked to a regional specific<br />
mix of different economic, environmental, social, cultural and<br />
political issues which needs to be considered when looking<br />
for common solutions.<br />
The role of transport in the sustainable development of<br />
the Alpine space<br />
This historical and conceptual overview already shows that<br />
the issue of transport in the <strong>Alps</strong> – as few others – intensely<br />
concerns all kinds of policies and all dimensions of sustainable<br />
development.<br />
Evidently, the three basic development dimensions – economy,<br />
environment, society and culture – are all most relevant<br />
in this context.<br />
Also, all equity issues of sustainable development, i.e. social<br />
equity, equity between generations and equity between territories<br />
are essentially affected by Alpine transport policies.<br />
And finally, the systemic principles associated with sustainable<br />
development play a central role in the discussion of transport<br />
issues in the <strong>Alps</strong>: the diversity of conditions across the<br />
<strong>Alps</strong> has to be respected, while the diversity of approaches in<br />
different regions is a great potential. Respecting and making<br />
sensible use of subsidiarity, i.e. differentiatedly involving the<br />
appropriate levels in the multi-level governance systems in<br />
the <strong>Alps</strong> improves effectiveness. Networking and cooperation<br />
are essential for mutual learning, especially in international<br />
and cross-border activities. Participation of those ultimately<br />
concerned is a prerequisite for lasting changes.<br />
As will be evident throughout this report, solving problems<br />
and conflicts seriously requires a spirit of integrated sustainable<br />
development.<br />
The role of transport in the Alpine Convention<br />
Since the beginnings, transport has played an important role<br />
in the Alpine Convention although main transport decisions<br />
for the <strong>Alps</strong> are being taken by the transport ministers in<br />
other institutional settings. Among the eight implementation<br />
protocols of the Alpine Convention, the transport protocol<br />
was the one that was the most difficult to negotiate. It also<br />
raises the most controversial discussions in the ratification<br />
process. The transport protocol gives a broad overview on<br />
the issue and its interlinkage with other policy fields. It sets<br />
rules and gives general orientation for transport policies in<br />
the Alpine space. The Working Group Transport is the one<br />
with the longest history in the Alpine Convention and has the<br />
task of monitoring progress along the guidelines given by<br />
the protocol. It also maintains contacts with other institutions<br />
such as the Zurich Group, the coordination body of the Alpine<br />
Transport Ministers.<br />
The aim and focus of the report<br />
The report is addressed to the wide range of politicians, professionals<br />
and non-professionals involved or interested in<br />
the debate on transport in the Alpine space.<br />
The aims of the report can be summarised in four points:<br />
• to provide an understanding of the complex issue of<br />
transport in the <strong>Alps</strong>,<br />
• to provide overview on present state and on trends,<br />
• to show different structures and problems in different<br />
parts of the <strong>Alps</strong>,<br />
• to identify the main challenges that call for joint<br />
action.<br />
Compared to other European, national and regional reports<br />
on this issue, the specific focus of this report lies in:<br />
• the presentation of harmonised data for the whole Alpine<br />
area,<br />
• putting the issue of Alpine transport in the context of<br />
an sustainable development,<br />
• showing the specifics of transport problems in the <strong>Alps</strong><br />
compared to other regions which might justify specific<br />
policies, and<br />
• formulating the relevant questions and challenges<br />
without however formulating a political programme.<br />
The first edition of such a report does not yet fully meet all<br />
these objectives. The limited availability of appropriate data<br />
and the difficulties of data harmonisation have shown the<br />
importance of joint efforts. <strong>How</strong>ever, the overall approach<br />
has proven to be valuable for contributing to a coherent<br />
Alpine perspective on the subject.<br />
The indicator-related data that have been collected by the<br />
contracting parties of the Alpine Convention represent the<br />
skeleton of the facts presented in this report. In addition, data<br />
from other sources have been used in addition and have always<br />
been quoted with their source.<br />
Writing the first report on the state of the <strong>Alps</strong><br />
The present report is the first approach to writing a report on<br />
the state of the <strong>Alps</strong>.<br />
Since the nineties there have been efforts to establish a System<br />
for the observation of and information on the <strong>Alps</strong> (SOIA)<br />
which suffered from insufficient funds and coordination. New<br />
efforts have been made by a Working Group of the Alpine<br />
Conference, working on “Mountain Specific Environmental
Objectives” (2000–2002) and then on “Environmental Objectives<br />
and Indicators” (2003–2004). In its final report (WG<br />
EOI 2004) this group has proposed an indicator system. The<br />
group also outlined a corresponding reporting structure and<br />
format and delivered pilot chapters for selected topics.<br />
In November 2004, the Alpine Conference asked the Permanent<br />
Secretariat (established in 2003) to prepare a first<br />
report on the state of the <strong>Alps</strong>. Due to limited resources, in<br />
autumn 2005 the Permanent Committee decided to produce<br />
a report focused on transport and mobility based on original<br />
data from the member states according to the indicators proposed<br />
by the WG EOI.<br />
Besides the importance of the transport issue and its many<br />
links to all dimensions of sustainable development, as outlined<br />
above, the long experience of the Working Group<br />
Transport of the Alpine Convention and its willingness to be<br />
involved in this endeavour, were decisive for the decision to<br />
focus the first report on the state of the <strong>Alps</strong> on this issue.<br />
This report is a result of the joint effort of national teams provided<br />
by Italy, Germany and Austria, of the French Presidency,<br />
of the Working Group Transport and of the Permanent<br />
Secretariat. Chapters have been written by different authors<br />
considering the comments of the Contracting Parties. After<br />
the approval of the contents, final editing has been undertaken<br />
by the Permanent Secretariat supported by an external<br />
contractor and in close consultation with the authors.<br />
This approach of distributed responsibilities has enabled the<br />
report to be produced with very limited resources on all sides.<br />
<strong>How</strong>ever, it has also led to limitations in the homogeneity of<br />
the approach and concerning cross-references between the<br />
chapters. Case studies representing different Alpine realities<br />
and comparisons between different regions were only possible<br />
to a limited extent.<br />
Part B looks at the driving forces behind the developments<br />
described in part A. What are the services that the transport<br />
system is delivering? Why is freight transport increasing?<br />
<strong>How</strong> has the Alpine population, its distribution and<br />
its demands evolved? <strong>How</strong> does tourism create transport<br />
demands?<br />
Part C looks in the opposite direction and deals with selected<br />
impacts of transport in the <strong>Alps</strong>. The structure of part C corresponds<br />
to the three main pillars of sustainable development:<br />
chapter C1 deals with the impact on the economy,<br />
chapter C2 with the social impacts and chapter C3 with some<br />
selected environmental and health impacts. Given the wide<br />
range of issues on which transport has an effect, it was not<br />
possible to treat all of them.<br />
Part D again takes a different look at the subject: it describes<br />
transport-related policies at European, national and for some<br />
issues also at regional and local levels. In doing so, it tries<br />
to relate these policies to the facts and trends, to the drivers<br />
and the impacts described previously, allowing at the end to<br />
get an overall impression – surely not a systematic assessment<br />
– of the variety and the adequacy of these policies.<br />
Part E, finally, against the background of the foregoing descriptions<br />
and explanations and considering fundamental<br />
overall policy objectives, looks at the fundamental service<br />
functions Alpine transport is supposed to provide for identifying<br />
the main political challenges that have to be addressed<br />
in the future.<br />
To look at the driving forces and at the impact of transport in a<br />
perspective of sustainable development is an ambitious task<br />
which involves a range of theories and perspectives where<br />
the selected focus is not necessarily shared across all disciplines<br />
and countries involved. In this report it was not possible<br />
to provide a complete picture – especially concerning the impacts<br />
it was necessary to focus on a deliberate selection of<br />
relevant and well-documented issues. Undoubtedly, readers<br />
could possibly miss a more detailed discussion on social aspects,<br />
on biodiversity, on water etc. <strong>How</strong>ever, this report is<br />
only the first product in the long-term project of monitoring<br />
developments in the <strong>Alps</strong>.<br />
The construction logic of the report<br />
The report has five parts which correspond to its major<br />
intentions.<br />
Part A describes the Alpine Transport System. This chapter<br />
has a deliberate transport perspective. It provides facts<br />
about the situation and the trends concerning the infrastructure,<br />
freight transport, passenger transport and the overlapping<br />
of these systems and uses as well as an outlook on new<br />
infrastructures being built. Based on the most recent figures<br />
from the member states it provides a comprehensive overview<br />
on cross-Alpine and intra-Alpine traffic.<br />
3
Chapter A – The Alpine Transport System<br />
A<br />
The Alpine<br />
Transport System<br />
access of tourists from and to the Alpine destinations and<br />
the mobility of tourists around their holiday destination.<br />
• Because of its central geographical position between<br />
strong European economies, the transport system in the<br />
Alpine area has a vitally important role in the transit of<br />
passengers and freight from north to south as well from<br />
east to west.<br />
The chapters in part A of the report will outline<br />
• the Alpine transport infrastructure and its development<br />
for road and rail (chapter A1),<br />
• the status, trends and backgrounds of freight transport<br />
(chapter A2) both on road and rail, and finally<br />
• the passenger transport (chapter A3) in its forms of motorised<br />
individual and public transport by rail and bus.<br />
Setting the frame for these chapters in the following sections,<br />
the overall issue and its internal links will be presented and<br />
key terms for Alpine transport will be introduced.<br />
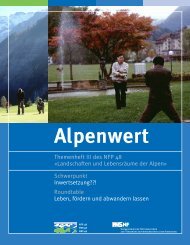
Road and rail at the Brenner (Source: S. Marzelli).<br />
In part A of this report the basis of the central topic is presented,<br />
the Alpine transport system. This complex system of<br />
local, regional, national and international transport systems<br />
comprises all the different types of infrastructure, such as<br />
railways, roads, waterways, airports and even urban transport<br />
systems such as trams, trolley buses and underground<br />
railways.<br />
Road and rail transport infrastructure<br />
The mountainous topography of the <strong>Alps</strong> constitutes a particular<br />
challenge for transport infrastructures. Thanks to<br />
technical progress, it has become easier to overcome steep<br />
slopes and deep valleys with the construction of long tunnels<br />
and bridges. But the topography, natural hazards and<br />
weather conditions still play an important role in regard to<br />
infrastructure and maintenance costs as well as duration of<br />
construction.<br />
In this report the focus is laid on:<br />
• road and rail infrastructure as these play the most important<br />
role for the Alpine transport infrastructure, and<br />
• freight and passenger transport which represent the<br />
highest traffic volume on the transport modes of road<br />
and rail transport. Passenger transport is subdivided into<br />
individual and public transport.<br />
As this report seeks to compile information for the whole area<br />
of the Alpine Convention for the first time, some deficiencies<br />
are unavoidable. These shortcomings are related to the different<br />
administrative structures of the Alpine Convention<br />
area and to the heterogeneity of road and railway companies<br />
and systems, which result in data differences due to the<br />
different categories and monitoring systems in place. Consequently,<br />
information and data research and their harmonisation<br />
is in some cases a time-consuming and long-term task.<br />
The need for an Alpine transport system<br />
The transport system of the <strong>Alps</strong> has to fulfil different functions<br />
and services (cp. basic service functions in chap. E2):<br />
• First, the transport system is necessary for the daily<br />
activities of the inhabitants of the Alpine area, such as<br />
work, shopping, business, education and leisure, as well<br />
as for their supply with public and private services.<br />
• Furthermore, the transport system is a main economic<br />
factor, as the infrastructure is used by the different<br />
economic sectors of the Alpine area to exchange goods<br />
within and beyond the Alpine region. This includes the<br />
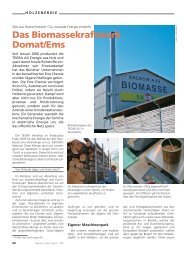
Nösslachbrücke, Austria (Source: BMVIT Alpenstraßen AG).<br />
The Alpine road infrastructure is characterised by several<br />
motorways especially from north to south and a few motorways<br />
– mainly in the western <strong>Alps</strong> – from east to west. By<br />
building a series of tunnels and Alpine passes over the last<br />
century, large part of the physical barriers of mountain ridges<br />
have been overcome. Higher ranked national roads connect<br />
the different motorways; in the end a dense road network has<br />
evolved through the Alpine valleys.<br />
The rail infrastructure has developed in another way. Within<br />
the last years the development focused on the expansion of<br />
both the high-speed inter-city system, and of the rail network<br />
in urban and suburban regions. Because of insufficient demand<br />
in some rural regions, more and more light railways are<br />
threatened with closure, or have already closed. Therefore in<br />
some countries the length of the railway network decreased<br />
in the last decades.<br />
5
Report on the State of the <strong>Alps</strong><br />
Freight transport<br />
The transport of goods to or from, as well as within and<br />
through, the Alpine area may be the most controversial topic<br />
of Alpine transport (see types of transport in the <strong>Alps</strong> on the<br />
next page). The wide breadth of study involved is impossible<br />
to reflect comprehensively in this report. But the report<br />
will go into the topic, giving an overview of freight transport<br />
development in the last ten years in general, as well as in<br />
terms of short and long distance freight transport. The use of<br />
road and rail for freight transport, and their areas of congestion,<br />
are also presented. Trends in freight transport show an<br />
overall increase, which will continue in the coming decades.<br />
With the exception of Switzerland, this increase will occur<br />
predominantly in road freight transport.<br />
Mobility<br />
Mobility is a complex concept as it represents an amalgamation<br />
of social and physical aspects. Mobility from a social<br />
perspective may be observed at three levels (Götz 2003):<br />
• Mobility is the physical movement of people and goods<br />
in space,<br />
• mobility simultaneously indicates the accessibility of personal<br />
options and opportunities to serve human needs in<br />
a social sense, and<br />
• mobility also describes the position of humans in a symbolic<br />
space and, vice versa, social position and lifestyle<br />
have an influence on mobility practice.<br />
The physical aspects are outlined according to UBA Berlin<br />
(2006): the term “mobility” is used to describe two aspects,<br />
the movability (possibility to move) and the actual movement<br />
of people and objects.<br />
Mobility can also be quantified. The more “activity objectives”<br />
(e.g. certain shops, restaurants, work places) are accessible<br />
within a given time frame, the higher the mobility. This<br />
definition implies that reaching activity objectives is the decisive<br />
factor for mobility, and not the distance travelled. It links<br />
mobility with the activities individuals seek to pursue (to<br />
meet their needs) and does not include a valuation as to<br />
whether these are desirable or undesirable, necessary or<br />
unnecessary.<br />
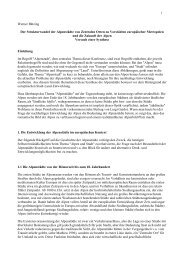
Freight transport by rail (Source: Rail Cargo Austria).<br />
Passenger transport<br />
The demand for passenger transport is also growing, reflecting<br />
an increased demand for mobility as already mentioned<br />
above. Therefore the major question is, which transport<br />
mode is chosen to serve these needs. Some case studies<br />
will offer insights into the general trend which is often in favour<br />
of motorised car transport. Car transport is increasing<br />
both on short- and long-distance journeys. Public transport<br />
performance remains difficult to examine as information is<br />
collected according to individual methods by different providers<br />
and modal split studies. <strong>How</strong>ever, some examples give<br />
an impression of railway and bus service development.<br />
The provision of public transport has in general changed over<br />
the last few years; particularly in rural areas it has declined in<br />
many cases. Development differs between regions:<br />
• Some light railway services were closed and replaced by<br />
bus systems; bus systems sometimes could not be conducted<br />
efficiently and were closed too, in the best cases<br />
they were substituted by on-demand systems.<br />
• In some rural regions this development could be halted<br />
by well-planned public transport concepts which include,<br />
for instance, mobility management, on-demand systems<br />
or synchronised bus and railway timetables.<br />
• Other regions may have access to profitable railway or<br />
post bus services, as is reported from Switzerland.<br />
Mobility encompasses both the capability to reach (movability)<br />
and the actual reaching of objectives (movement) – in<br />
short: potential and realised mobility.<br />
Potential mobility is a function of the density and diversity<br />
of activity opportunities available within the individual's radius<br />
of action, which is influenced by the available transport<br />
mode. Hence, potential mobility is above all a measure of the<br />
quality of activities and thus a measure of the quality of life.<br />
Realised mobility is quantified by the number of activity objectives<br />
actually reached. The variable "number of trips" used<br />
in statistics to express mobility is identical with the number of<br />
activity objectives.<br />
Changes in potential mobility have on average a relatively<br />
minor impact on realised mobility. This may be illustrated by<br />
observations within Germany:<br />
In the Federal Republic of Germany, the number of motorised<br />
trips, as well as trips on foot and by bike, has increased only<br />
slightly, if at all, since 1976, when records began. The daily<br />
average is a little more than three trips per person. A similar<br />
figure was determined as early as the 1920s for Berlin.<br />
<strong>How</strong>ever, those who equate mobility with auto-mobility come<br />
up with an impressive increase in mobility. Trips by car grew<br />
by more than 100% between 1960 and 1994 alone (UBA<br />
Berlin 2006).<br />
With the number of trips – and hence mobility – remaining<br />
constant, kilometres travelled can increase or decrease depending<br />
on the trend in average trip length. Both developments<br />
are possible. In the EU personal mobility in terms of<br />
kilometres per day increased from 17 km a day in 1970 to
Chapter A – The Alpine Transport System<br />
35 km in 1998 (European Commission 2001). This high level<br />
of realised mobility is now more or less seen as an acquired<br />
right.<br />
Today, the strategy of choice is to rely on ever faster means<br />
of transport. This accelerated transport enhance the accessibility<br />
of distant areas, but at the same time it reduces<br />
the meaning of spatial distance in terms of spatial qualities<br />
such as remoteness, maintaining differences or evaluation<br />
of characteristics. Mobility in this case is associated with<br />
more travel ("mobility of long distances"). The increasing traffic,<br />
generated by more and longer trips, in a feed back loop<br />
curbs the mobility of people by congestion, queue times etc.<br />
(UBA Berlin 2006).<br />
Accessibility<br />
Accessibility in terms of transport refers to the ease of reaching<br />
destinations. People living in highly accessible places<br />
can quickly reach many destinations whereas people in inaccessible<br />
regions have access to fewer places in the same<br />
amount of time.<br />
In a broader sense, accessibility can also be understood as<br />
access to information technology such as broadband-internet,<br />
mobile phone or service supplies.<br />
More precisely, transport accessibility is the circumstance<br />
under which a location or region can be reached in reference<br />
to other locations and regions, taking into account the travel<br />
time and travel expenses which are necessary to reach them<br />
(Wegener 2003). Furthermore, it is the real product of the<br />
present transport system. It can be calculated by means of<br />
different indicators, which are more or less complex:<br />
• Simple accessibility indicators: In the simplest way,<br />
accessibility can be defined as the travel effort (in terms<br />
of travel time and expenses). Considering certain destinations<br />
such as urban centres or tourism destinations,<br />
accessibility is normally expressed as travel effort in total<br />
or on average (Wegener et al. 2002). Another simple<br />
accessibility indicator is the transport infrastructure in a<br />
region (e.g. total length of roads, motorways or railway<br />
lines, number of railway stations or motorway exits).<br />
• Complex accessibility indicators: These indicators take<br />
into account the connectivity of transport networks by<br />
distinguishing between the network itself and the activities<br />
or opportunities that can be reached by it. Normally<br />
these indicators integrate a spatial resistance factor (e.g.<br />
travel time, cost) in order to describe the possibility of<br />
reaching destinations of interest (Spiekermann & Neubauer<br />
2002).<br />
A controversial debate is ongoing on the importance of<br />
accessibility to regional economic development (see also<br />
chapter C1). The complex relations between accessibility and<br />
regional economic success, does not allow to refer to a solid<br />
cause-relationship.<br />
<strong>How</strong>ever in general many areas with better access to commercial<br />
locations and markets will probably be more productive,<br />
more competitive and hence more successful than more<br />
isolated areas (Spiekermann 2006; Linneker 1997). On the<br />
other hand the importance of accessibility to the road network<br />
for the economic performance of peripheral regions is constricted<br />
due to the decreasing economic importance of the<br />
transport of bulk products, new communication technologies,<br />
the growing importance of soft location factors (information,<br />
services, recreational value) and globalisation. There is no<br />
clear evidence that, within peripheral regions, those areas<br />
with better accessibility to the road network have better-performing<br />
economies.<br />
Accessibility is also one of the main factors influencing spatial<br />
development. The access to road and public transport<br />
depends on the location of a community within the transport<br />
system. In general, urban and suburban areas have better<br />
access to the road and public transport network than do rural<br />
areas. Accessibility to transport services in urban regions<br />
leads to the evolution of a wide suburbanised belt surrounding<br />
their centres (Fröhlich, Tschopp & Axhausen 2005).<br />
Types of transport in the Alpine Area<br />
In the Alpine Convention Transport Protocol, Article 2 defines<br />
the following types of transport:<br />
• trans-Alpine transport is transport whose destination and<br />
origin is outside the Alpine area,<br />
• intra-Alpine transport is transport whose destination and<br />
origin lies within the Alpine area, including transport having<br />
origin or destination in the Alpine area.<br />
Fig. A-1: Scheme of transport typology.<br />
According to this, intra-Alpine transport may be further subdivided<br />
into (see Fig. A-1):<br />
1•<br />
internal transport (destination and origin within the Alpine<br />
area),<br />
2•<br />
import transport (origin outside and destination inside the<br />
Alpine area), and<br />
3•<br />
export transport (origin inside and destination outside the<br />
Alpine area).<br />
In this report these terms are used in this manner.<br />
<strong>How</strong>ever one should recognise different and sometimes confusing<br />
meanings from other points of view.<br />
“Alpine crossing” traffic is defined as traffic, both of goods<br />
and passengers, which crosses the main Alpine ridge on its<br />
way. This is for instance the freight transport monitored by<br />
the project “Cross Alpine Freight Transport” (CAFT), which<br />
is differentiated as:<br />
7
Report on the State of the <strong>Alps</strong><br />
• Transit traffic: The sum of passenger and freight traffic<br />
from an origin and to a destination outside the considered<br />
location, corresponding to trans-Alpine traffic.<br />
• Import traffic: The sum of passenger and freight traffic<br />
originating outside of the considered location with destination<br />
within the considered region.<br />
• Export traffic: The sum of passenger and freight traffic<br />
originating inside the considered region and with destination<br />
outside.<br />
• Internal traffic: Internal traffic originates and ends within<br />
the considered region, all of the last three categories correspond<br />
to intra-Alpine traffic.<br />
Traffic across national boundaries may fall under different<br />
categories depending on the point of view. Depending on its<br />
origin and destination in regard to the respective country borders,<br />
it may be categorised as import, export or transit traffic.<br />
For instance, traffic from the German Alpine area to the Italian<br />
<strong>Alps</strong>, passing through Austria is transit traffic from a national<br />
point of view in Austria, trans-Alpine traffic as it crosses<br />
the Brenner pass, import traffic from the Italian perspective<br />
and internal traffic in regard to the Alpine Convention area.<br />
Modal split<br />
Modal split is the proportion of total journeys (trips), volume,<br />
weight, vehicle or transport performance (vehicle, tonneor<br />
passenger-kilometres) carried out by various alternative<br />
modes of transport, such as road, rail, inland water, maritime<br />
and air, including non-motorised transport. Modal split can<br />
also be defined as the share of different modes of transport,<br />
including non-motorised modes and pedestrian trips, within<br />
overall transport demand.<br />
The modal split differs markedly across the European region,<br />
while future trends show a rather similar pattern. For the – at<br />
that time – EU-25 countries, road transport (tonne-kilometres<br />
for 2002) accounts for around 72%, rail for 16.4%, inland<br />
waterway transport for roughly 6% and pipeline transport for<br />
the remaining 5.6% of total inland European freight transport<br />
(excluding maritime and air transport). 82.5% of passenger<br />
transport was undertaken to by private car, 9.5% by<br />
bus and coach, 6.8% by rail and 1.1% by tram and metro.<br />
These figures do not include air transport that contributed<br />
around 5.7% of total transport performance. Also, short sea<br />
transport, including ferry-boat, is quite important among EU<br />
countries, especially for freight transport (The PEP 2007).<br />
in urban areas or walking and cycling. While these modes<br />
may indeed have fewer negative environmental and health<br />
impacts at comparable service levels, it is the total transport<br />
chain from origin to destination that needs to be assessed,<br />
including the provision and maintenance of the required infrastructures.<br />
The modal split in the Alpine area depends on the available<br />
infrastructure (public transport, rail, etc.) and the geographical<br />
situation of the community. Because of larger investments<br />
in road infrastructure, both passenger (see chapter<br />
A3) as well as freight transport (see chapter A2) increased<br />
on the road. This trend has been observed continuously over<br />
the last decades and will most likely continue in the future.<br />
Due to changing lifestyles, the purpose of transport has<br />
changed over the last years, with leisure and tourism transport<br />
becoming ever more important. More but shorter holidays,<br />
mainly involving car travel to and from the destinations,<br />
are resulting in increased traffic volumes on Alpine road connections.<br />
High diversity of conditions for transport in different<br />
parts of the <strong>Alps</strong><br />
It does not exist an “Alpine transport” as a self-contained<br />
system, as conditions for transport systems are even more<br />
divers in the Alpine space as they are in lowlands. Transport<br />
embraces urban transport in Alpine cities as well as transport<br />
in sparsely settled, remote territories.<br />
Furthermore, parts of the Alpine area lie in the catchment<br />
area or even the commuter belts of large metropolises<br />
outside the Alpine Convention area such as Lyon,<br />
Milano, München, Zürich or Wien. Therefore transport in the<br />
Alpine area has to consider large traffic flows between these<br />
metropolises and their surrounding areas and on the big<br />
transit axes as well as very low traffic flows which are however<br />
crucial for the survival of low populated areas. Traffic<br />
means appropriate to topography and traffic demand include<br />
the whole range from motorways and high speed railways to<br />
cable cars and even foot paths.<br />
In general, the eight countries which form the Alpine area<br />
have developed different transport systems, policies and<br />
strategies, and different histories of transport infrastructure,<br />
which makes an Alpine synthesis a complex task.<br />
Modal shift requires the existence of suitable alternative<br />
modes of transport of the same or similar quality and performance/cost<br />
levels. The relevance of modal split policies<br />
within the framework of sustainable transport in general and<br />
demand management in particular arises from differences in<br />
environmental and health impacts (resource consumption,<br />
pollutant and noise emissions, land consumption, accidents,<br />
physical activity, etc.) of the different transport modes, including<br />
non-motorised modes such as walking and cycling.<br />
It is difficult to make general statements about the environmental<br />
and health impacts of a modal shift towards the socalled<br />
environmentally friendly and healthy modes of transport,<br />
such as rail or inland water transport, public transport
Chapter A – The Alpine Transport System<br />
Bibliography<br />
BMVIT – Bundesministerium für Verkehr, Innovation und Technologie,<br />
Consult, H. (2006): Alpenquerender Güterverkehr in<br />
Österreich. Wien.<br />
European Commission (2001): White paper European transport<br />
policy for 2010: time to decide. Luxembourg.<br />
Fröhlich, Ph., Tschopp, M., Axhausen, K. W. (2005): Entwicklung<br />
der MIV und ÖV Erreichbarkeit in der Schweiz: 1950-<br />
2000. Arbeitsbericht Verkehrs- und Raumplanung, 310, IVT,<br />
ETH Zürich, Zürich.<br />
Götz, K. (2003): Moving through nets: The physical and<br />
social dimensions of travel. Proceedings of the 10 th International<br />
Conference on Travel Behaviour Research, Lucerne,<br />
10.–15. August 2003.<br />
Hyman, M. (2005): The impact of accessibility to the road network<br />
on the economy of peripheral regions of the EU.<br />
Linneker, B. (1997): Transport infrastructures and regional<br />
economic development in Europe: a review of theoretical<br />
and methodological approaches, TRP 133, Sheffield, Department<br />
of Town and Regional Planning.<br />
The PEP (2007): Modal split. http://www.thepep.org/CHWeb-<br />
Site/chviewer.aspx?cat=c14 (accessed 13 April 2007).<br />
Spiekermann, K. & Neubauer, J. (2002): European accessibility<br />
and Peripherality: concepts, models and indicators,<br />
Nordregio Working Paper 9.<br />
Spiekermann, K. (2006): Territorial impact of transport policy<br />
– chances and risks for mountain regions based on ESPON<br />
results MONTESPON. Vortrag at the Montespon Conference<br />
to Lucerne, Switzerland, 5 September 2006.<br />
UBA – Umweltbundesamt Berlin (2006): More Mobility with<br />
Less Traffic. http://www.umweltbundesamt.de/verkehr-e/<br />
nachhentw/mobilitaet/verkehr.htm (accessed 14 April 2007)<br />
Wegener, M., Eskelinnen, H., Fürst, F., Schürmann, C.,<br />
Spiekermann, K. (2002): Criteria for the Spatial Differentiation<br />
of the EU Territory: Geographical Position. Forschungen<br />
102.2, Bonn: Bundesamt für Bauwesen und Raumordnung.<br />
Wegener, M. (2003): Beschleunigung, Erreichbarkeit und<br />
Raumgerechtigkeit. In: Raum – Zeit – Planung. Konferenzband<br />
der 9. Konferenz für Planerinnen und Planer NRW am<br />
5. November 2003, Zeche Zollverein Essen: 26–35.<br />
9
Report on the State of the <strong>Alps</strong><br />
A1<br />
Transport Infrastructure<br />
Transport infrastructure is the essential frame for the<br />
functionality of a transport system. It steers the accessibility<br />
of the region as well as the accessibility of<br />
perialpine goods and services for the Alpine population.<br />
On the other hand, the major transport volumes are increasingly<br />
concentrated on a limited number of Alpine<br />
crossings.<br />
In the last few decades the Alpine road network has undergone<br />
a major extension, whereas the railway is basically<br />
still using the network that was established in the<br />
first half of the 20th century. Today, the modal split in<br />
many Alpine region clearly reflects this transport and<br />
infrastructure policy.<br />
The <strong>Alps</strong> have a longstanding history of ambitious transport<br />
infrastructure projects facilitating the transport of<br />
passengers and goods between northern and southern<br />
Europe. Nowadays, although the system continues to be<br />
supplemented by major projects, it is reaching its limits<br />
both in capacity as well as in negative environmental<br />
and social effects, such as noise, immissions and fragmentation<br />
of landscape.<br />
The following chapter will provide an overview of the<br />
current status of the Alpine road and rail transport network,<br />
and of projects and strategies to cope with the<br />
continued increase in traffic volume that is predicted for<br />
the European Union.<br />
A1.1 Importance and role of transport<br />
infrastructure in the <strong>Alps</strong><br />
The transport network in the <strong>Alps</strong> is characterised by a limited<br />
number of corridors, established for fast and easy access<br />
and transection of the mountain range in a North-South<br />
direction and a dense network of secondary roads. In the<br />
course of motorisation, short-distance connections over<br />
mountain ridges between neighbouring valleys were abandoned,<br />
whereas linear connections between intra- and perialpine<br />
regions were greatly improved. This pattern reflects<br />
the increasing relevance and integration of the Alpine region<br />
in its surrounding lowland and the territory of the European<br />
Union as a whole. Today, for many mountain regions the<br />
perialpine agglomerations such as München, Milano and<br />
Zürich are faster and easier to reach than neighbouring<br />
valleys or mountain ridges.<br />
Intra-Alpine transport<br />
In the <strong>Alps</strong> the transport infrastructure provides links between<br />
remote areas and valleys and the centres and villages<br />
inside and outside the <strong>Alps</strong>. Depending on the local<br />
situation, an improved accessibility through transport infrastructure<br />
can either lead to a strengthening or to a depletion<br />
of the local economy (see also Chapter C1). In remote<br />
areas with limited employment opportunities and declining<br />
economy, the population is on the one side heavily depending<br />
on good infrastructure; on the other an improvement of<br />
transport infrastructure can also expose the local economy<br />
to highly competitive market forces. Transport infrastructure<br />
is one of the essential location factors for industry and trade.<br />
It is particularly vital for tourist destinations based in remote<br />
regions, which, due to their morphological setting, are often<br />
difficult to access.<br />
Trans-Alpine transport<br />
Another aspect of the infrastructure of Alpine transport is the<br />
role it plays in the international transport network, e.g. the<br />
Trans-European Network (TEN). The <strong>Alps</strong> are in the middle<br />
and at the crossroads of vital economic centres of the European<br />
Union, most notably between the Mediterranean region<br />
and Central and Northern Europe and between the Iberian<br />
Peninsula and Southeastern Europe. These economic centres<br />
are origins and destinations of significant traffic volumes,<br />
part of which transect or closely circumvent the Alpine arc.<br />
A high volume of transport is concentrated on the transport<br />
infrastructure in a few valleys, creating enormous pressure<br />
on the environment.<br />
Although being aware that the Alpine transport infrastructure<br />
has to be seen within the context of its feeders and the overall<br />
European transport system, this report strongly focuses<br />
on transport infrastructure within the <strong>Alps</strong>.<br />
Indicators<br />
Road and rail length<br />
Location, length, number of railway stations or free flow<br />
speed are typical parameters which give a first impression<br />
of an infrastructure system and its developments.<br />
These parameters are available for the present situation.<br />
General conclusions are drawn by using national data<br />
and the results of the Project 1.2.1 “Transport services<br />
and networks: territorial trends and basic supply of infrastructure<br />
for territorial cohesion” of the European Spatial<br />
Planning Observation Network (ESPON) (EU 2004).<br />
Transport network extension<br />
Furthermore, plans for future widening and extension<br />
schemes provide information about the current importance<br />
and (political) needs of infrastructure.<br />
Road and rail network density<br />
The density of the network is a suitable parameter for<br />
characterising the transport network, especially when<br />
comparing different regions within and beyond the Alpine<br />
Convention perimeter. This parameter is calculated in relation<br />
to both the population and the surface area of a<br />
particular region. The density of the network in relation<br />
to the surface area covered can be used to describe the<br />
accessibility of the Alpine region, whereas the density in<br />
relation to the population can also be seen as an indicator<br />
for the supply of transport services to the inhabitants of<br />
the Alpine region.<br />
10
Chapter A – The Alpine Transport System<br />
A1.2 Road infrastructure<br />
Historic development of road infrastructure<br />
Roads are the oldest form of transport infrastructure. In the<br />
second half of the 20 th century, mass motorisation and the resulting<br />
traffic volumes required an expansion of the existing<br />
road network, allowing higher speeds and traffic volumes,<br />
particularly on motorways.<br />
The motorway network as it exists today originated in the<br />
years after the Second World War. Most of today’s motorways<br />
in the Alpine space were built before 1981. Since 1981<br />
some sections of the motorway network have been added<br />
and conventional roads have been extended or gaps in<br />
the network were closed, for instance the Pyhrn pass and<br />
the motorways in southern Austria or the Fréjus corridor in<br />
Italy / France. <strong>How</strong>ever, especially in the western <strong>Alps</strong>, some<br />
Alpine-crossing connections have not been converted into<br />
motorways.<br />
A1.2.1 Current road network<br />
To a higher degree than the non-Alpine road network, the<br />
Alpine road network had to be adapted to topographic conditions.<br />
Roads are often narrow, steep and winding while<br />
climbing passes to cross mountain ranges. Crossing small<br />
and large valleys requires bridges and preventive measures<br />
are sometimes needed against natural hazards such as avalanches<br />
and mud slides. To overcome the natural barrier of<br />
the <strong>Alps</strong>, small and large tunnels have been built. Examples<br />
are the Tauern tunnel in Austria, the Gotthard tunnel in Switzerland,<br />
and the Fréjus and the Mont Blanc tunnels between<br />
France and Italy.<br />
All these topographic obstacles, together with Alpine weather<br />
conditions, may slow down traffic speed. They lead to long<br />
construction periods and high construction and maintenance<br />
costs of Alpine infrastructure projects. As far as possible,<br />
roads have been built along the main valleys where construction<br />
and maintenance costs are significantly lower, but<br />
where they are close to residential areas.<br />
Respecting these topographic conditions, the motorway system<br />
follows the main valleys of the <strong>Alps</strong> and connects main<br />
Alpine towns and cities (cp. Map A1-1). Additionally, secondary<br />
roads connect side valleys and their towns and villages<br />
with the motorways, forming a dense road network through<br />
the Alpine valleys.<br />
The road infrastructure of the Alpine space includes several<br />
motorways from north to south and – especially in the western<br />
<strong>Alps</strong> – from east to west. Further east-west routes closely<br />
circumvent the area of the Alpine Convention (for instance<br />
the route from Lausanne to Bern and Zürich).<br />
Main roads and motorways as part of the Trans-<br />
European Network<br />
The Alpine motorway infrastructure is part of the Trans-European<br />
Network and its corridors. Most of it connects Northern<br />
Europe (Germany, Netherlands etc.) with Southern Europe<br />
(Italy, Greece etc.), e.g. the Brenner route. In the <strong>Alps</strong> these<br />
north–south corridors (cp. Tab. A1-1) have the function of<br />
transit routes, but at the same time are used for intra-Alpine<br />
traffic. In contrast to this, the west-Alpine axis acts mainly<br />
as a trilateral connection between Italy, France and Spain<br />
(Alpine Convention 2004).<br />
Corridor<br />
Main connection<br />
South corridor (Semmering /<br />
Wechsel)<br />
Brno – Udine<br />
Pyhrn / Schober Pass<br />
Budevice – Maribor<br />
Tauern<br />
Salzburg – Ljubljana<br />
Brenner<br />
München – Verona<br />
Gotthard<br />
Basel – Milano<br />
Ventimiglia<br />
Barcelona – Marseille –<br />
Genova<br />
Fréjus – Mont Blanc<br />
Torino – Lyon<br />
Tab. A1-1: Main Alpine road corridors.<br />
The terminology for road network differs between countries.<br />
Therefore “main roads” stands here for the high-ranking road<br />
network based on selected Tele Atlas and EuroGlobalMap<br />
data . In total, there are approximately 4,239 km of these<br />
main roads in the <strong>Alps</strong>, of which Austria and Switzerland<br />
feature the highest per capita density (cp. Tab. A1-2).<br />
Country<br />
Main roads in<br />
km within AC<br />
area<br />
Main roads in<br />
m per km 2 of<br />
national AC<br />
area<br />
Main roads in<br />
m per capita<br />
of national AC<br />
population<br />
AT 1,547 28.32 0.48<br />
CH 755 30.37 0.41<br />
DE 298 26.91 0.20<br />
FR 742 18.18 0.30<br />
IT 792 15.47 0.19<br />
SI 105 13.35 0.16<br />
Sum 4,239 22.26 0.30<br />
Tab. A1-2: Main roads in relation to area and population of Alpine Convention<br />
perimeter (Source: EU 2004 and calculation based on Tab. B1-1).<br />
Density above European average<br />
The main characteristic of mountain regions is that, due to<br />
topographic conditions, settlement and traffic are concentrated<br />
in the valley bottoms. Thus, even though the population<br />
density is lower than in most non-Alpine parts of Europe, the<br />
remaining land suitable for development is scarce and there<br />
is fierce competition between various demands and uses.<br />
In relation to the population, the highest density of the main<br />
road network can be found in the middle and eastern parts of<br />
the <strong>Alps</strong> (Switzerland and eastern Austria, cp. Map A1-2). In<br />
the western and southern parts, the density of the main road<br />
network is slightly lower.<br />
<br />
<br />
Class 0: Main Road – Motorways<br />
RTE1: European Route<br />
11
Report on the State of the <strong>Alps</strong><br />
Map A1-1: Road network and main Alpine passes and tunnels.<br />
Map A1-2: Density of main road network in relation to population (on NUTS-3 level).<br />
12
Chapter A – The Alpine Transport System<br />
Density of the Alpine motorway network in the<br />
European context<br />
In the ESPON project, amongst other things, the density<br />
of the motorway network was analysed for the whole of<br />
Europe. The results show that, except for some regions<br />
in the western Italian part of the <strong>Alps</strong>, the density of the<br />
motorway network (in relation to the population) is above<br />
European average, which can be explained by the relatively<br />
small population density.<br />
All in all, the ESPON project classifies the Alpine motorway<br />
network as sufficient in relation to the population<br />
density (EU 2004).<br />
Road widening and extension plans<br />
With regard to further construction of road infrastructure,<br />
widening and extension schemes are planned in all Alpine<br />
countries. Some selected examples are illustrated below. In<br />
the eastern part, some projects in Germany are either approaching<br />
completion or ultimately foreseen in the Federal<br />
Transport Network Plan. The completion of the A7 motorway<br />
to Füssen is underway, the final part of the A95 motorway to<br />
Garmisch-Partenkirchen is in the planning process and the<br />
A8 München–Salzburg will be extended to a six-lane motorway<br />
between Rosenheim and Bernau.<br />
In Austria an extension of the Tauern and the Katschberg<br />
tunnel, both part of the A10 Salzburg–Villach, is in progress.<br />
The A1 motorway Wien–Salzburg will subsequently be<br />
expanded to six lanes. The S34 will be upgraded to a<br />
motorway near St. Pölten while the Pfänder tunnel on the<br />
A14 Bregenz–Feldkirch will be extended. The S16 Arlberg<br />
motorway will be extended in a second and third stage.<br />
In Italy, some necessary developments of the road network<br />
have been undertaken for safety reasons: Strengthening operations<br />
(Torino–Milano, Sacile–Conegliano) or creating new<br />
links (Asti–Cuneo, Lombardia–Piemonte road, Venitienne–<br />
Piemonte road, Brescia–Bergamo–Milan link).<br />
In Switzerland, one exemplary road infrastructure project<br />
within the AC area is the extension of the A9 from Sierre to<br />
Brig and the closing of gaps of the A8 between Sarnen and<br />
Interlaken.<br />
Currently, there is no EU-TEN priority road project planned<br />
in the Alpine arc. <strong>How</strong>ever, in the course of implementation<br />
of Corridor 5 of the Pan-European Corridors, major road<br />
constructions are foreseen in the eastern parts of the Italian<br />
<strong>Alps</strong>.<br />
Some of the motorways and international routes are still incomplete,<br />
especially in the western <strong>Alps</strong>. Further investments<br />
will be made in road infrastructure; in the Alpine region, national<br />
programmes include the closing of infrastructure gaps<br />
and, in certain countries, the widening or extension of existing<br />
roads. Some of these measures are mainly targeted<br />
towards improving safety e.g. the Tende road tunnel between<br />
France and Italy.<br />
A1.2.2 Tunnel accidents and safety<br />
The big road tunnels in particular are key infrastructures for<br />
the Alpine road network. In the last few years there have<br />
been serious accidents in various Alpine tunnels, for example<br />
in the Mont Blanc tunnel, the St. Gotthard tunnel in Switzerland<br />
and in the Tauern tunnel in Austria (see Tab. A1-3).<br />
Tunnel Accident Closure until<br />
Reconstruction<br />
costs 1<br />
Mont Blanc 24 March 1999 March 2002 189 Mio EUR 2<br />
St. Gotthard<br />
24 October<br />
2001<br />
22 December<br />
2001<br />
No data<br />
Tauern 29 May 1999 August 1999 8.5 Mio EUR<br />
Tab. A1-3: Accidents in Mont Blanc, St. Gotthard and Tauern tunnel.<br />
1<br />
Source: Munich Re 2003.<br />
2 This sum only represents the building costs; considering also the income deficit<br />
the amount could be estimated between 300 and 500 Mio EUR.<br />
The traffic situation during the reconstruction-related closure<br />
of the tunnels dramatically underlined the need for safe<br />
and effective road tunnels. Consequently, measures have<br />
been taken to improve tunnel safety in the Alpine road transport<br />
network (see also chapter D3.2 for some background<br />
information).<br />
Tunnel safety measures<br />
These serious accidents, which have left their mark on the<br />
<strong>Alps</strong> since 1999, have raised awareness of the urgent need<br />
to equip the major trans-Alpine tunnels with better safety<br />
conditions without decreasing their carrying capacity. Despite<br />
real financial difficulties, the safety of the tunnels has<br />
improved and the major alternative projects have made<br />
progress, whether in terms of increasing the efficiency of<br />
the services offered or promoting new infrastructure. Almost<br />
everywhere, binational management committees have been<br />
set up, with suitable emergency plans and appropriate regulations<br />
already approved or in the process of research.<br />
France and Italy have agreed on objective of dividing heavy<br />
goods traffic in the proportions of at least 35% each from<br />
Mont Blanc and Fréjus tunnel, which led to 35% of Mount<br />
Blanc and 65% of Fréjus tunnel, as part of the negotiation<br />
of the conditions for the reopening of the Mont Blanc tunnel<br />
in 2002. These levels have almost been achieved today, in<br />
particular after the closure of the Fréjus tunnel in June 2005<br />
due to an accident.<br />
At the Tende pass, France and Italy set up a safety committee<br />
in mid-2003, to improve the management and operation<br />
of the road tunnel, one of the oldest and narrowest in Europe,<br />
and have decided to create a new structure without increasing<br />
capacity, on which work should commence at the start<br />
of 2008.<br />
Concerning the Franco-Italian roads, traffic measures (alternating,<br />
prohibitions, escorts for hazardous substances)<br />
to ensure safety were implemented in the Fréjus and Mont<br />
Blanc tunnels when the latter was reopened to heavy goods<br />
13
Report on the State of the <strong>Alps</strong><br />
vehicles on 25 June 2002. Studies are continuing for the<br />
creation of a safety tunnel in the Fréjus tunnel.<br />
For safety reasons, France and Italy have agreed to reduce<br />
the number of heavy goods vehicles weighing more than<br />
26 tonnes that are allowed into the Tende road tunnel, and<br />
ethylene derivatives have also been banned on the south-<br />
Alpine branch of the A8 motorway (the coast road between<br />
Marseille and Genua) since 23 June 2003, in order to<br />
encourage transportation of these items by sea.<br />
In Switzerland, following the accident of 24 October 2001,<br />
the St. Gotthard tunnel was reopened to heavy goods traffic<br />
under very strict safety conditions (alternating one-way<br />
traffic), which remained in force until the completion of the<br />
work of installing additional safety systems and stronger ventilation<br />
systems at the end of September 2002. Since then,<br />
the tunnel has reopened to heavy goods traffic in both directions,<br />
accompanied by a traffic control metering system<br />
which regulates the flow of heavy goods vehicles at the tunnel<br />
entrance in relation to the global volume of traffic. When<br />
the maximum tolerated traffic values are exceeded, the lorries<br />
are parked on waiting areas. In the case of saturation,<br />
the “red phase” is launched and the drivers are invited to<br />
use other road routes, as well as the opportunities offered by<br />
piggyback railway traffic. These traffic control measures have<br />
proved their effectiveness: reduction in risks and free flow of<br />
the traffic, without a massive increase in its volume.<br />
The objective of improving road safety has also led to an<br />
intensification of mobile controls of heavy traffic. These controls<br />
are progressively completed by the creation of control<br />
centres spread over the Swiss territory, so that it is possible<br />
to monitor heavy traffic on national roads systematically.<br />
As far as road provision is concerned, let us recall that the<br />
movement of heavy freight vehicles is forbidden on Swiss<br />
territory from 10 p.m. till 5 a.m., as well as on Sundays and<br />
during national public holidays.<br />
A1.2.3 Traffic related fees and taxes<br />
Road-pricing systems<br />
Each of the countries that form part of the Alpine space has<br />
its own pricing system (cp. Tab. A1-4). For their privately<br />
owned cars, the Austrians and the Swiss have to buy a motorway<br />
tax disc called a “Vignette”, which is valid for a certain<br />
time irrespective of the mileage driven. In Slovenia, France<br />
and Italy, car users have to pay a fee per kilometre. The average<br />
tariff per kilometre for passenger cars ranges from<br />
0.04 EUR (SI) to 0.07 EUR (FR). Germany has implemented<br />
a charging system only for Heavy Duty Vehicles (HDV).<br />
The charging system for HDV is almost the same in all countries.<br />
The basis of computation is the distance travelled. In<br />
general, HDV are charged for the use of motorways; only<br />
in Switzerland are levies charged on HDV on other roads<br />
as well. Additional factors of pricing systems are permissible<br />
maximum weight and the emission class of each vehicle.<br />
Vehicle<br />
Road<br />
category<br />
Country<br />
Calculation<br />
unit<br />
System<br />
Price in<br />
EUR<br />
AT Car Motorway Year Vignette 72.6<br />
CH<br />
HDV km Go-Box<br />
Car<br />
HDV<br />
National<br />
streets<br />
All Streets<br />
IT Car Motorway<br />
HDV<br />
0.156<br />
– 0.328<br />
Year Vignette 29<br />
Year Vignette 26.5<br />
km,<br />
tonnes,<br />
emissions<br />
km,<br />
section<br />
km,<br />
section<br />
0.016/tkm<br />
card 0.05<br />
card<br />
graduated<br />
prices<br />
FR Car Motorway km card 0.07<br />
HDV km card<br />
graduated<br />
prices<br />
DE Car - - - -<br />
HDV >12<br />
tonnes<br />
Motorway<br />
km<br />
Motorcycle<br />
electronical<br />
electronical<br />
0.15<br />
SI Car Motorway km card 0.04<br />
HDV km card<br />
graduated<br />
prices<br />
Tab. A1-4: Road pricing in the Alpine countries (Source: www.oeamtc.at;<br />
www.arboe.at).<br />
In the EU Member States, road pricing systems have to conform<br />
to the regulations specified in the Eurovignette Directive<br />
1999/62/EC (see chapter D). Until recently, only building and<br />
maintenance costs for the road network could be included<br />
in road pricing, while external costs like environmental costs<br />
could not be covered (for a detailed discussion of external<br />
costs see chapter C1). An amendment to the Eurovignette<br />
Directive (2006/38/EC), however, foresees that external cost<br />
factors (e.g. costs for accidents) as calculated according to<br />
a standardised assessment model may be included in roadpricing<br />
systems. On some axes (e.g. Fréjus), an additional<br />
fee is due for dangerous freight.<br />
The effect on route choice depends on the type of toll. Compared<br />
to mileage-related tolls, tolls levied for special infrastructure<br />
such as bridges and tunnels have a different effect<br />
on specific transport costs. Their influence on long-distance<br />
transport is significantly lower than for regional freight transport<br />
(Schmutzhard 2005), which is related to the regressive<br />
character of the toll (see Fig. A1-1). Therefore supra-regional<br />
transport is mostly unaffected by them.<br />
Mileage-related tolls, on the other side, increase travel costs<br />
equally for regional and supra-regional transport.<br />
14
Chapter A – The Alpine Transport System<br />
Fig. A1-1: Regressive effect of special toll on the Brenner route 2004<br />
(49 EUR) on HDV transport costs, calculated for 50, 100, 300, 1000 and<br />
2000 km (Source: Schmutzhard 2005).<br />
In Switzerland, the road pricing system (LSVA) covers the<br />
whole road network. Two objectives are tied to the LSVA,<br />
one being the implementation of the polluter-pays-principle,<br />
the other being the improvement of the Swiss railway system’s<br />
competitiveness. The LSVA covers, in addition, most<br />
external costs for environmental damage. The road transport<br />
costs in Switzerland therefore contribute to a stabilisation in<br />
road transport volumes and to a shift from road to rail transport,<br />
reducing environmental damage.<br />
Fuel prices and taxes<br />
Besides reflecting the economic value of the resource, fuel<br />
prices are also a source of revenue for state budgets and are<br />
perceived by political stakeholders as an instrument to steer<br />
transport volumes. Generally speaking, in the Alpine region,<br />
taxes levied by the state make up more than half of the fuel<br />
price, which is why there are slightly different fuel prices<br />
(cp. Tab. A1-5).<br />
Instrument AT FR DE IT CH SI<br />
Mineral oil tax x X X x x x<br />
Motor vehicle tax x X x x<br />
Vehicle<br />
registration tax<br />
X<br />
X<br />
Tax on vehicle<br />
registration for<br />
high CO 2<br />
emitters<br />
X<br />
CO 2<br />
tax<br />
Incentive tax on<br />
sulphur content<br />
X<br />
of motor fuels<br />
Tab. A1-6: Taxes adopted in the Alpine countries as a response to transport<br />
pressure (Source: OECD/EEA database on instruments used for<br />
environmental policy and natural resources management); since January<br />
2004, motorway user charges in AT are only applied to vehicles up to 3.5<br />
tonnes.<br />
In spite of the charging system for HDV, additional tolls are<br />
levied on some routes (cp. Fig. A1-2). These routes are specifically<br />
cost-intensive in terms of building and operation. For<br />
that reason they have been excluded from the rest of the<br />
road network and are regulated through specific toll laws.<br />
Existing routes with special tolls such as the Europabrücke<br />
on the Brenner route or the Mont Blanc tunnel are mostly<br />
routes with a major share of international traffic which allows<br />
for cost-oriented route optimisation. Changes in the relation<br />
between special tolls and mileage-related road pricing could<br />
cause shifts in international traffic flows.<br />
Country<br />
Petrol<br />
95 octane 98 octane<br />
Diesel<br />
DE 1.305 1.379 1.125<br />
IT 1.241 1.334 1.164<br />
FR 1.239 1.271 1.050<br />
AT 1.033 1.134 0.817<br />
CH 1.002 1.027 1.039<br />
SI 1.015 1.024 0.929<br />
Tab. A1-5: Fuel price differences in the Alpine countries in EUR (Source:<br />
ÖAMTC, April 2007).<br />
Freight carriers take these price differences into consideration<br />
when planning their routes. Therefore, differences<br />
in road pricing and taxes on fuel and vehicles (cp. Tab.<br />
A1-6) help explain differences in modal split among Alpine<br />
countries.<br />
Fig. A1-2: Comparison of road pricing on Alpine crossing routes in EUR<br />
for a 40t HDV, 5 axles, Euro-3 emission standard, approx. 300 km<br />
(Source: bmvit).<br />
A1.3 Rail infrastructure<br />
The importance and functions of the rail network varied in<br />
the past. At the outset (around 100–150 years ago) railways<br />
were constructed mainly to provide access to industrial sites.<br />
The present major railway extension projects are planned for<br />
a significant volume of freight transport crossing the <strong>Alps</strong> and<br />
at the same time serve as a fast connection between major<br />
cities of the European central region. Since 1970 there has<br />
been a trend towards the construction and extension of these<br />
high-speed lines as part of the European railway network.<br />
15
Report on the State of the <strong>Alps</strong><br />
Map A1-3: Rail network in the <strong>Alps</strong>.<br />
Therefore, several of the main conventional lines have been<br />
upgraded in the last few decades and they are now highspeed<br />
lines (e.g. the Pontebbana axis in Italy). At the same<br />
time, the light railway network has not been upgraded and<br />
some lines have been shut down and replaced by a bus<br />
service.<br />
These services appear to be more cost-effective to maintain,<br />
but railway services are considered by the public as being<br />
more reliable. Thus the closure of these services reduces<br />
the use of public transportation in general. <strong>How</strong>ever some<br />
popular bus systems are expanding (see chapter A3.4.2).<br />
Furthermore, the maintenance of railway lines may be advisable<br />
as they could be put to use again under changing future<br />
economic conditions for the transport of goods.<br />
The main rail network in the <strong>Alps</strong> runs more or less parallel<br />
to the road network (see Map A1-3 and A1-4). Similar to the<br />
road network, the main railway lines are part of the Trans-<br />
European rail network. In addition to the main railway lines<br />
designed for national and international transit traffic, lowspeed<br />
light railways – mostly not electrified – lead through<br />
the Alpine valleys on single-track lines and connect side valleys<br />
with the main valleys.<br />
A1.3.1 Density of the rail network<br />
In total there are approximately 8,364 km of railway lines in<br />
the <strong>Alps</strong>, 2,622 km of which are high-speed lines. Switzerland<br />
and Austria feature the highest density of railway lines<br />
per capita, while Italy, France and Slovenia feature values<br />
below the Alpine average.<br />
Country<br />
Population<br />
within<br />
national AC<br />
area<br />
km railway<br />
within<br />
national<br />
AC area<br />
Railway<br />
km/1000<br />
pop<br />
Railway<br />
lines in m<br />
per km 2 of<br />
national AC<br />
area<br />
AT 3,255,201 2783 0.85 50.95<br />
CH 1,827,754 1639 0.90 65.92<br />
DE 1,473,881 947 0.64 85.53<br />
FR 2,453,605 1128 0.46 27.64<br />
IT 4,210,256 1,530 0.36 29.89<br />
SI 661,135 337 0.51 42.85<br />
Sum 13,881,832 8,364 0.60 43.93<br />
Tab. A1-7: Railway lines per country.<br />
Density of the Alpine railway network in the European<br />
context<br />
The results of the EU project ESPON on the density of<br />
the rail network are similar to those for the road network.<br />
Except for some regions in the west of Italy and in the<br />
south of Austria, the density of the railway network (in<br />
relation to the population) is above European average,<br />
which can be explained by the relatively small population<br />
density in the <strong>Alps</strong>.<br />
Consequently, the railway network relative to the density<br />
of population is classified as sufficient for most of the area<br />
covered by the AC, with a certain lack of railway infrastructure<br />
in the regions mentioned above (EU 2004).<br />
16
Chapter A – The Alpine Transport System<br />
Map A1-4: Density of rail network in relation to population (on NUTS-3 level).<br />
A1.3.2 Extension and improvement plans<br />
All Alpine countries aim to improve rail passenger and freight<br />
transport and to increase the share of rail transport.<br />
The existing conventional lines are mainly covered by plans<br />
for optimising them in public-private partnerships between<br />
states and railway operators. The following major extension<br />
and improvement schemes exist for the Alpine railway<br />
system (Alpenkonvention 2006):<br />
Lyon-Turin (LTF)<br />
The Franco-Italian cross-border base tunnel project foresees<br />
a base tunnel of 52 km length establishing a competitive rail<br />
transport link on this important western Alpine corridor. Construction<br />
costs for the whole project of 73 km, including the<br />
cross border tunnel, are calculated at 7 billion EUR and the<br />
tunnel is scheduled to be opened in 2020. The Lyon–Turin<br />
Project constitutes one of the major Alpine transport infrastructure<br />
projects for the next decade both for passenger and<br />
goods transport.<br />
Plan Maurienne Corridor (Aiton – Orbassano rail motorway)<br />
Since November 2003, as an experiment, France and Italy<br />
have operated an Alpine rail motorway between Aiton and<br />
Orbassano, which runs under strict constraints since the historic<br />
Mont Cenis tunnel is not built to the European B1 standard<br />
facilitating the transport of most HDV on piggyback. Use<br />
of this experimental Alpine rail motorway is therefore limited<br />
to tanker traffic only until the tunnel modernising work is completed<br />
(2008), but it made dramatic progress in 2004 and<br />
2005, in particular when the Fréjus tunnel road was closed<br />
on 4 June 2005. For the first time, a rail alternative has been<br />
possible for this corridor, particularly for hazardous materials<br />
(doubling of traffic between June and July, leading to 530<br />
HDV/week).<br />
Brenner 2005<br />
The following essential results were achieved during the first<br />
18 months of project work:<br />
For the core section of the Brenner corridor between<br />
München and Verona, the three rail network operators German<br />
Railway Net (DB Netz), Austrian Railway Net (ÖBB<br />
Netz) and Italian Federal Railway (RFI) have developed socalled<br />
catalogue train paths.<br />
In 2004, the Milano-Segrate terminal which is directly connected<br />
with München-Riem by a train link was established as<br />
a new gateway terminal for the Brenner corridor.<br />
Finally, the BRAVO partners Kombiverkehr, Ferriere Cattaneo<br />
and Combined Transport Management and Transportation<br />
S.p.A. (CEMAT) have developed a new high-capacity<br />
pocket wagon. The Federal Railway Office has approved this<br />
wagon so that in the first half of 2006 the first series of pocket<br />
wagons can be put into service.<br />
The Brenner action plan 2005 and BRAVO have contributed<br />
to the increase in the traffic volume of unaccompanied combined<br />
services between Germany and Italy.<br />
17
Report on the State of the <strong>Alps</strong><br />
Case study: New locomotive for interoperable<br />
services<br />
Since the end of 2004, provisional approval has been<br />
granted to the F4 (interoperable multi-system locomotive)<br />
by the RFI for the Italian network. Since May 2005, it has<br />
been successfully and constantly used in interoperable<br />
services. The objectives thus achieved are:<br />
• higher reliability and punctuality (due to the abolition<br />
of interfaces),<br />
• shorter transit times due to the prevention of shunting<br />
at the Brenner, and<br />
• more efficient use of the limited – and in some cases<br />
already congested – infrastructure, inter alia, at the<br />
Brenner.<br />
Plan IQ-C (International Group for Improving the Quality<br />
of Rail Freight Traffic on the North-South Corridor)/New<br />
Rail Link through the <strong>Alps</strong><br />
The IQ-C plan envisages 14 measures regarding the removal<br />
of bottlenecks and the implementation of the European Train<br />
Control System (ETCS) on the entire Simplon–Gotthard line<br />
(Rotterdam–Genua). Beyond constructions projects related<br />
to the IQ-C such as the Gotthard and Lötschberg base tunnels<br />
(NRLA), measures address rail transport operators (cooperation<br />
as part of competition), managers of infrastructure<br />
and government authorities; many of them have already<br />
been implemented. The infrastructure managers have in<br />
particular taken measures in order to improve quality, i.e. the<br />
creation of a one-stop shop for their clients (the railway undertakings),<br />
the setting up of harmonised procedures for railway<br />
operations and the co-ordination of international timetables.<br />
Progress has also been registered for the admission<br />
of engine drivers and the reciprocal recognition of locomotive<br />
homologations. Furthermore, a procedure for customs<br />
simplification regarding rail freight crossing Switzerland was<br />
recently adopted by the four countries.<br />
The action plan for the Tauern rail line (Subproject of the<br />
Interreg IIIB-Project “AlpFRail”)<br />
The action plan consists of the following measures:<br />
• production of an inventory of the freight transport situation<br />
on this line (substantial increase in road traffic and<br />
stagnation of rail freight, increase in transport capacity<br />
needed between the South of Germany and the South<br />
of Europe, environmental problems, unsatisfactory rail<br />
service provided),<br />
• establishment of an analysis of the weaknesses of the<br />
current rail service (failure to adhere to timetables, poor<br />
use of capacity, problems with interface between operators,<br />
insufficient capacity of terminals, loss of information<br />
in the chain of transport), and<br />
• introduction, in the short term, of three combined transport<br />
products, in order to transfer about 5,000 HDV/<br />
month from road to rail.<br />
After the completion of the work planned on the Tauern rail<br />
line, the number of freight trains could increase by 30%<br />
(or 15 additional trains per day) as from the year 2006 onwards,<br />
in comparison with 2003. In addition, the journey time<br />
could be reduced by 20%.<br />
Additional railway improvement and extension projects include<br />
Marseille–Genua (Ventimiglia), Salzburg–Ljubljana<br />
(Tauern), Budweis–Maribor corridor (Phyrn–Schober axis),<br />
Venezia–Trieste/Koper–Postojna–Ljubljana, Brno–Udine<br />
(Semmering, South corridor) and Passau/München–<br />
Bratislava/Budapest (Danube axis).<br />
Terminals providing access to the rail network<br />
Freight transport in particular requires large terminals to provide<br />
access from road to rail and cargo handling. As with<br />
air traffic, large terminals of great importance for the trans-<br />
Alpine rail network such as in Basel, München or Wien are<br />
located in flat areas outside the Alpine Convention area.<br />
Within the Alpine Convention area there are some terminals<br />
that are important for trans-Alpine traffic such as the terminals<br />
Villach-Süd (AT; Tauern corridor, south corridor), St.<br />
Michael (AT; Pyhrn corridor, south corridor), Domodossola<br />
(IT; Gotthard/Simplon/Lötschberg corridor) or the terminal of<br />
Aiton (FR) for the experimental rolling road between France<br />
and Italy.<br />
A1.4 Bottlenecks<br />
One of the basic principles of the EU is free movement of<br />
goods, services and individuals. This inevitably leads to an<br />
increase in traffic volume and to bottlenecks, particularly in<br />
the Alpine region with its specific morphological situation.<br />
The Alpine transport network suffers from bottlenecks both<br />
in regard to road and to rail infrastructure. While the first is<br />
mostly due to constantly increasing traffic volumes, the latter<br />
seems to result from the political emphasis on individual motorised<br />
transport infrastructure over the last decades and the<br />
lack of interoperability and intermodality of different national<br />
railway networks.<br />
Case study: Swiss national road bottlenecks<br />
In a Swiss study, the potential capacity bottlenecks on<br />
national motorways until 2020 were analysed using two<br />
different scenarios. The minimum scenario anticipates<br />
that, on the basis of investments in rail and public transport,<br />
road traffic will grow by only 24%. Nonetheless, the<br />
infrastructure mainly in agglomerations (in the Alpine area<br />
these are Luzern and Lugano), will not be able to cope<br />
with future traffic volumes.<br />
The maximum scenario foresees an increase of about<br />
40%, which is more or less an extrapolation of the trend<br />
in the past. On the basis of this scenario, congested road<br />
infrastructure is expected both in agglomerations and unpopulated<br />
areas (e.g. Gotthard tunnel) (ARE 2002).<br />
18
Chapter A – The Alpine Transport System<br />
Major road bottlenecks in the <strong>Alps</strong> mainly affect tunnels and<br />
the related issue of tunnel safety. Furthermore, urban areas<br />
with their related access routes and centres, as well as<br />
access routes to tourist destinations with insufficient public<br />
transport, also create bottlenecks.<br />
Railway bottlenecks in the <strong>Alps</strong> are created by an insufficient<br />
extension of the railway network, short access to rail for<br />
freight transport, deficient electrification and signal systems<br />
and single-track railways.<br />
While today it is widely accepted that the <strong>Alps</strong> cannot accommodate<br />
limitless traffic of all modes, specific bottlenecks can<br />
cause an inefficient use of the rest of the infrastructure, environmental<br />
harm nuisance for the users and economic loss.<br />
Especially in cases where transit traffic causes congestion<br />
heavily affecting local transportation, the option of using bottlenecks<br />
as physical limit to transport growth becomes problematic.<br />
Increasingly, financial and regulatory measures are<br />
adopted for ensuring an optimal flow within set quantitative<br />
limits. The Swiss transport policy aiming at a strong reduction<br />
of road freight transport is a case in point.<br />
Hot issues<br />
The recent amendment of the EU Eurovignette Directive<br />
opens the door for the integration of external costs in national<br />
road-pricing systems. The LSVA, the Swiss road<br />
pricing system, has demonstrated that a substantial integration<br />
of external costs has the potential to significantly<br />
shift traffic volumes from road to rail. Together with the<br />
provision of competitive railway infrastructures, the pricing<br />
system is considered to be a key factor for a sustainable<br />
transport system in the Alpine region.<br />
The extension of the infrastructure cannot be regarded<br />
as a solution for transport problems in the Alpine region<br />
alone. There is also a need to deal with temporary peaks<br />
and growing traffic volumes, especially in agglomerations.<br />
As well as infrastructure improvements, measures<br />
of interoperability and traffic-management systems can<br />
significantly contribute to a more efficient and cost-effective<br />
processing of Alpine traffic volumes.<br />
Main findings<br />
Status<br />
The <strong>Alps</strong> are covered by a dense, linear network of transport<br />
infrastructure. This infrastructure is in some places<br />
being significantly improved to serve higher volumes of<br />
traffic and to meet the needs of an increasing division of<br />
labour in the European economy. Main Alpine corridors<br />
are part of the Trans-European Networks. Important<br />
projects aim at higher performance of these corridors in a<br />
European context.<br />
The density of transport infrastructure in the <strong>Alps</strong> is reaching<br />
average or even above-average levels when compared<br />
to EU standards. Tunnel accidents and subsequent<br />
closing of traffic corridors illustrate the sensitivity of the<br />
system as a whole.<br />
Trends<br />
At the same time, the road network especially is reaching<br />
its limits on various corridors, both in capacity and in<br />
effects on the population and environment. Bottlenecks<br />
arise as a consequence of increasing traffic volumes<br />
and insufficient alternatives and regulation of motorised<br />
individual traffic. This has been acknowledged by political<br />
stakeholders within and beyond the Alpine region and<br />
there is increasing international effort to tackle the issue<br />
of transport and to improve the competitiveness of the<br />
railway links to and across the <strong>Alps</strong>.<br />
Bibliography<br />
ALPENCORS (Ed.) (2005): Guidelines for an efficient policy<br />
on CORRIDOR V. Venezia.<br />
Alpine Convention (2004): Report by the “Corridors” and<br />
“Rolling Road” Subgroups of the Transport Working Group of<br />
the Alpine Convention. VIII meeting of the Alpine conference,<br />
September 2004.<br />
Alpenkonvention (2006): Kooperationen auf Schienenkorridoren<br />
der Alpen. Bericht der Arbeitsgruppe Verkehr.<br />
Innsbruck.<br />
ARE – Bundesamt für Raumentwicklung (2002): Verkehrsanalyse<br />
zu den künftigen Kapazitätsengpässen auf den<br />
Nationalstrassen. Bern.<br />
EU – European Union (2004): ESPON (European Spatial<br />
Planning Observation Network) Project 1.2.1 Transport services<br />
and networks: territorial trends and basic supply of infrastructure<br />
for territorial cohesion.<br />
Munich Re (2003): Risk Management Tunnel. München.<br />
Schmutzhard, L. (2005): Brenner/Brennero: Does the expansion<br />
of infrastructures replace transport policy? Proceedings<br />
of the conference “Transport across the <strong>Alps</strong> – MONITRAF”,<br />
Lucerne, 1. December 2005.<br />
New infrastructure projects are mostly targeted towards<br />
improving the Alpine railway system and its connectivity<br />
and intermodality to perialpine railway and road infrastructure.<br />
In this regard, the plans are in line with the objectives<br />
of the Alpine Convention.<br />
19
Report on the State of the <strong>Alps</strong><br />
A2<br />
Freight Transport<br />
In this chapter, the subject of freight transport in the<br />
<strong>Alps</strong> will be presented on the basis of traffic surveys.<br />
The modal split between road and rail transport traffic<br />
as well as the characteristics of each of these traffic<br />
modes, will be discussed. Furthermore, the relationship<br />
between transport traffic within the Alpine region and<br />
with regions beyond the Alpine arc will be presented on<br />
the basis of traffic surveys.<br />
Trade and economic development and the increasing<br />
complexity of production processes in Europe produce<br />
a constant increase in freight transport between European<br />
regions, of which a good share transits through<br />
Alpine passes. Even though freight transport holds only<br />
a minor share of the overall Alpine traffic volume, it nevertheless<br />
has an outstanding role for the Alpine as well<br />
as for the European economy and creates significant<br />
environmental and sociocultural impacts particularly<br />
along the Alpine road transport corridors.<br />
The movement of goods within the EU territory is increasing<br />
because of three main factors:<br />
• the EU monetary union and market liberalisation,<br />
• the evolution of EU internal markets, and<br />
• the EU enlargement towards the East.<br />
total freight traffic has doubled over the last two decades.<br />
Annex A2-3 shows the transit transport volume of the most<br />
important Alpine crossings in 2004.<br />
Fig. A2-2: Alpine arc A,B,C (Source: Alpinfo)<br />
In 2004, the modal split for all Alpine crossings was 2/3 to<br />
1/3 in favour of road traffic (Fig. A2-3). Between 1994, 1999<br />
and 2004, the share of rail transport in the modal split has<br />
decreased from 38% to 34% to 33%, respectively (CAFT<br />
2004 Survey).<br />
A2.1 Freight transport and modal<br />
split development<br />
The Alpine main ridge can be crossed on French, Swiss,<br />
Italian or Austrian territory. Regarding the tonnage by Alpine<br />
crossing country, Switzerland had the biggest percentage<br />
increase between 1999 and 2004, both on rail and on<br />
road (see Annex A2-1). Austria featured the highest absolute<br />
increase, while on French Alpine crossings, road transport<br />
volumes stagnated and rail transport decreased.<br />
Fig. A2-3: Alpine-crossing transport volume 1994, 1999 and 2004.<br />
When looking at national differences in modal split, the data<br />
reveal significant differences within the Alpine region. It is interesting<br />
to note that the modal split between rail and road is<br />
64% to 36% in Switzerland, whereas the railway holds shares<br />
of only 31% in Austria and 14% in France (Fig. A2-4).<br />
Between 1999 and 2004, rail traffic (in tonnes) decreased<br />
by 30% on northern French crossings, whereas rail traffic<br />
through Swiss crossings increased by 21%.<br />
Fig. A2-1: Total transport traffic flows (road and rail) crossing the Alpine<br />
Arc by country in Mio of tonnes.<br />
A total of 191.7 Mio tonnes were transported by road and rail<br />
across the Alpine arc in 2004, of which 110 Mio tonnes were<br />
transported across the inner Alpine bow (Alpine Arc A, see<br />
Fig. A2-2) delimited by Mont Cenis-Fréjus and the Brenner,<br />
accounting for 57% of the total traffic across the <strong>Alps</strong> (see<br />
Fig. A2-1 and Annex A2-2). On these two Alpine crossings,<br />
Fig. A2-4: Modal split by Alpine countries in 2004 (Sources: CAFT 2004<br />
Survey).<br />
20
Chapter A – The Alpine Transport System<br />
Intra-Alpine traffic which originates in and/or is destined for an<br />
Alpine region was estimated to amount to 60 Mio tonnes in<br />
2004 (CAFT 2004).<br />
From 1994 to 2004, total Alpine traffic increased on average<br />
by 3.8% per year, although there was a slight decrease<br />
from 2000 to 2001. Generally, the growth of freight transport<br />
has slowed down over the last five years. Since 1983,<br />
road freight transport has annually grown by an average<br />
5%, while rail freight transport has grown by an average 1%.<br />
A2.2 Freight road transport<br />
A2.2.1 Total traffic<br />
In 2004, trucks transported 129 Mio tonnes of goods across<br />
the <strong>Alps</strong>. This translates into more than 10 Mio heavy duty vehicles<br />
(HDV) above 3.5 tonnes crossing the Alpine Arc in 2004.<br />
With 2 Mio vehicles per year, the heavy vehicle traffic is<br />
concentrated mainly on the Brenner crossing, followed by<br />
Tauern, Ventimiglia, Schoberpass and Fréjus, annually<br />
accounting for around 1.2 Mio vehicles. In percentage terms,<br />
the shift for each pass showed that almost 60% of freight<br />
traffic ran through the Brenner, Tauern, Schoberpass, Semmering<br />
and Fréjus crossings together (see Annex A2-4).<br />
The number of vehicles crossing the <strong>Alps</strong> showed a marked<br />
increase until the year 2000, followed by a period of moderate<br />
growth and finally an increase to a total of 10 Mio vehicles<br />
in 2004.<br />
Data sources<br />
The following databases have been used to describe the<br />
volume of Alpine freight transport:<br />
Cross Alpine Freight Transport (CAFT) Survey:<br />
Carried out every five years and based on interviews with<br />
truck drivers crossing the main Alpine ridge. Since 1994,<br />
Switzerland, France and Austria (assisted in 2004 by<br />
Italy and Germany) carry out a survey on transport traffic<br />
movements on the Alpine road system. In 2004, CAFT<br />
carried out data collection on Alpine crossing as well as<br />
border-crossing traffic movements on all modes (road, rail<br />
and piggyback) on the most important Alpine road and rail<br />
connections of the participating countries.<br />
The methodology has been harmonised between the<br />
project partners to achieve an Alpine-wide consistent<br />
database as the basis for transport policy decisions.<br />
In 2004, the range of roads assessed was enlarged to<br />
include cross-sections with the new EU Member States.<br />
In Austria, a total of 23 cross-sections have been selected<br />
for the road transport survey. On these cross-sections,<br />
truck drivers have been asked to answer a questionnaire on<br />
• type of vehicle/number of axes/place of registration,<br />
• origin and destination or place of unloading,<br />
• border crossing for entry and departure, and<br />
• main type of transported goods.<br />
O/D (origin/destination) data is being related to the NUTS<br />
system. The survey data is finally being checked for plausibility<br />
and extrapolated using data from the electronic toll<br />
monitoring system and automatic count locations.<br />
Data on rail transport are obtained from railway companies<br />
and supplemented by a survey of combined transport<br />
connections.<br />
CAFT 2004 enabled the approximate identification of road<br />
and rail freight volumes as well as O/D matrixes NUTS-2<br />
for the Alpine region.<br />
Fig. A2-5: Number of vehicle movements on Alpine arc C by Alpine<br />
country (Source: Alpinfo).<br />
This development can be ascribed to the increase on Austrian<br />
Alpine crossings, while the trend was less evident in<br />
Switzerland. Its slight decrease after 2000 could be due to<br />
the increase of the maximum tonnage capacity allowed to<br />
cross Switzerland.<br />
Traffic volumes for each Alpine pass indicate that traffic<br />
diverted through the closure of the Mont Blanc tunnel did<br />
not affect traffic on the Gotthard pass, but was registered<br />
crossing the Fréjus pass (see Fig. A2-5).<br />
The status in the year 2004 and the development of road<br />
freight traffic in terms of number of trucks is displayed in Fig.<br />
A2-6. A constant increase of traffic between 1995 and 2004<br />
Alpinfo 2004 data collection:<br />
This data collection is carried out each year by the Swiss<br />
Federal Department of Environment, Transport, Energy<br />
and Communications (UVEK/DATEC), in cooperation with<br />
the French Ministère des Transports, de l‘Équipement, du<br />
Tourisme et de la Mer and the Austrian Bundesministerium<br />
für Verkehr, Innovation und Technologie, and includes<br />
monitoring of the freight traffic flows. It provides data<br />
on the tonnage relating to the flows crossing the main<br />
Alpine passes by extrapolating the results of the five yearly<br />
CAFT survey (Amt für Raumentwicklung 2004).<br />
Traffic Census Data from Automatic Registration:<br />
Periodical and up-to-date survey of traffic flows on the<br />
road network of some Alpine countries, which is carried out<br />
through automatic detection of traffic flows (all vehicles). It<br />
provides annual data on significant road segments of the<br />
Alpine network and covers the period from 1995 to 2005.<br />
21
Report on the State of the <strong>Alps</strong><br />
has been registered on the Tarvisio, Brenner and Ventimiglia<br />
routes.<br />
The traffic through Switzerland experienced a short decline<br />
between 2001 and 2002, only to increase again in the following<br />
years. At the same time, the growth rate of transit traffic<br />
through Austria has been decreasing in recent years.<br />
These trends are influenced not only by general dynamics<br />
of transport and logistics and by functional factors, but also<br />
by traffic deviation triggered by country-specific tollage and<br />
taxation policies. The pass with the highest share of Alpinecrossing<br />
freight traffic is the Brenner Pass with 38.5% in<br />
2003 (see Fig. A2-9). The rates or the other major passes<br />
range between 14% and 17%.<br />
Fig. A2-6: Development of road freight traffic by Alpine crossing (Source:<br />
ALPINFO 2004 – representation of flows based on CSST elaboration for<br />
AlpFRail INTERREG IIIB Project).<br />
Fig. A2-9: Distribution of Alpine-crossing transit freight traffic on main<br />
Alpine crossings in 2003 (Source: Alpinfo).<br />
Data for the Mont Blanc crossing has to be seen in the context<br />
of the tunnel accident and preliminary closure of the tunnel.<br />
Fig. A2-7: Total road transport volumes on Alpine crossings in 1994, 1999<br />
and 2004 (Sources: CAFT 2004 Survey).<br />
A2.2.2 Long distance traffic<br />
The volume of long distance traffic (transit plus import plus<br />
export traffic) expressed in number of vehicles increased<br />
from 6.9 Mio in 1994 to 10.0 Mio in 2004, which results in an<br />
annual average increase of 5%. This represents 47% of the<br />
total traffic on the Alpine road network.<br />
EU road Vehicle per day Freight rate<br />
E43 12,500 22%<br />
E45 6,000 21%<br />
E52 9,000 18%<br />
E55 5,000 12%<br />
E70 5,500 16%<br />
Fig. A2-10: Volumes of road freight traffic on main Alpine passes:<br />
bi-directional flows in 2004 (Source: Traffic Census Data provided by<br />
France and Germany).<br />
Fig. A2-8: Rate of freight transit traffic in relation to Alpine-crossing transit<br />
road traffic – total and per country (Source: Alpinfo).<br />
Although tonnage transported on the Brenner route is three<br />
times higher than on the Gotthard route (31.5 to 9.9 Mio<br />
tonnes), the HDV movements on these two passes are almost<br />
identical (see Fig. A2-11).<br />
22
Chapter A – The Alpine Transport System<br />
A2.2.3 Short distance traffic<br />
Short distance traffic, whose origin and destination lies within<br />
the area considered by the CAFT survey, represents 53%<br />
of the total Alpine-crossing freight movement in tonnes. The<br />
main internal flow of goods takes place in Austria, where in<br />
2004, over 1 Mio freight vehicles moved between the regions<br />
of Steiermark, Niederösterreich, Oberösterreich and Wien<br />
(CAFT 2004).<br />
Short-distance commercial traffic is growing quickly due to<br />
increasing segmentation of detail load distribution and logistical<br />
requirements. In this context, particularly in the surroundings<br />
of Alpine towns and cities, traffic is increasing<br />
significantly. Retail freight traffic, for instance, accounts for<br />
about 20% of all traffic movements during rush hour in major<br />
cities of the Alpine region such as Bolzano, Innsbruck and<br />
Grenoble.<br />
Total annual traffic gravitating around towns featuring sociodemographic<br />
and territorial characteristics of the main Alpine<br />
urban areas amounts to 200,000–300,000 HDV per year,<br />
with an average annual increase of 5–7%.<br />
A2.2.4 Road transport demand<br />
On a general basis, the Alpine road network is heavily<br />
used for freight transport. Based on traffic census data, an<br />
increase of 30% of heavy vehicles occurred in the decade<br />
between 1995 and 2005 on the most congested motorways.<br />
The share of freight traffic on main Alpine motorways ranges<br />
between 15% and 35% on the Brenner and Tauern passes<br />
and reaches 60% on the Fréjus pass.<br />
The high rate of trucks travelling on the most important Alpine<br />
corridors is the main cause of the critical “level of service” of<br />
road infrastructures. Freight traffic flows on the main Alpine<br />
motorways are presented in Annex A2-5.<br />
The analysis of road haulage for main O/D in CAFT 2004<br />
takes into account all the traffic movements on the Alpine<br />
road network, independently whether the place of origin and/<br />
or destination lies within the <strong>Alps</strong>. It reveals a difference concerning<br />
the structure of flows between the western Alpine<br />
crossings from Ventimigila to Brenner and the eastern ones,<br />
especially Schoberpass, Semmering, Wechsel.<br />
Long-distance transport dominates freight traffic on the<br />
western Alpine crossings, while the eastern Alpine crossings<br />
show a significant share of regional transport.<br />
Most freight traffic (over 150,000 vehicles per year in 2004)<br />
on the Alpine road network originates from or is destined<br />
for the NUTS-2 regions presented in Annex A2-6. Some of<br />
these regions such as Lombardia or Oberbayern, however,<br />
are not entirely situated within the perimeter of the Alpine<br />
Convention. Traffic generated by these NUTS-2 entities can<br />
therefore only be partly assigned to the Alpine Convention<br />
area, as significant shares of their population and economic<br />
centres are located beyond its perimeter.<br />
The most important NUTS-2 regions in regard to origin of<br />
transport who share at least part of their territory with the<br />
Alpine Convention perimeter are Steiermark and Lombardia<br />
with over 800,000 vehicles (see Annex A2-6).<br />
The destinations of the traffic flows generated in the five most<br />
relevant NUTS-2 regions are presented in Annex A2-7.<br />
The most important single O/D relations (over 100,000 movements)<br />
are due to the high proportion of regional traffic on<br />
the eastern Austrian Alpine crossings all situated in Austria<br />
(between Steiermark, Niederösterreich and Oberösterreich),<br />
where they connect neighbouring regions.<br />
Other traffic-generating regions feature high volumes of<br />
traffic to non-Alpine regions, most notably Lombardia with<br />
625,000 movements.<br />
Pass<br />
Brenner<br />
Gotthard<br />
Mt. Blanc / Fréjus<br />
Tarvisio<br />
Vehicles per year<br />
2.15 Mio<br />
2.20 Mio<br />
1.10 Mio<br />
2.10 Mio<br />
Fig. A2-11: Volumes of road freight traffic on main Alpine roads: bi-directional<br />
flows in 2004 (Source: “Traffic Census Data from Automatic Registration”<br />
and “Statistiche Autostradali AISCAT”).<br />
From a detailed analysis of the CAFT 2004 O/D matrix it can<br />
be summarised, Alpine road freight traffic shows the following<br />
general characteristics:<br />
• 47% of all trans-Alpine road transport movements detected<br />
by the CAFT Survey connect regions that at least<br />
partly belong to the Alpine Convention perimeter with<br />
other European regions,<br />
• 33% of all trans-Alpine road transport movements are<br />
within regions belonging at least partly to the AC area;<br />
here, traffic flows between Austrian regions are dominant,<br />
• 19% of all trans-Alpine road transport movements have<br />
neither origin nor destination in a region that at least<br />
partly falls within the AC area.<br />
23
Report on the State of the <strong>Alps</strong><br />
A2.3 Freight rail transport<br />
Alpine-crossing rail transport amounts to 63 Mio tonnes,<br />
which is roughly half of the tonnage transported by road<br />
(131.5 Mio t) (see Fig. A2-12). 30 Mio tonnes of this Alpine<br />
crossing rail transport is either import- or export-related. With<br />
24% increase between 1994 and 2004, the Alpine rail freight<br />
transport is losing shares to road freight transport, which has<br />
increased by 56% over the same period.<br />
The share of trans-Alpine rail transport differs significantly<br />
among the Alpine countries; in Switzerland 65%, in Austria<br />
33% and in France only 15% of freight transport is moved<br />
by train.<br />
A2.3.1 Rail and intermodal transport demand<br />
The CAFT Survey 2004 includes an O/D matrix of Alpine<br />
crossing freight transport. It is assessed on NUTS-2 level<br />
for Italy and on NUTS-1 level for the rest of Europe. Most<br />
long distance rail freight traffic involves links between Italian<br />
regions and other Alpine countries.<br />
In terms of tonnage, traffic towards Italy (North-South direction)<br />
is around 150% higher than traffic from Italy (South-<br />
North direction). The main O/D pairs are presented in Annex<br />
A2-8. Traffic movements between Italian NUTS-2 regions<br />
and Alpine countries are displayed in Annex A2-9.<br />
23 Mio tonnes originate in and/or are oriented to intermodal<br />
platforms, where they are transferred from trucks to trains<br />
and vice versa.<br />
According to the draft of the CAFT survey regarding Alpine<br />
Arc C (see Fig. A2-2), unaccompanied combined transport<br />
accounts for 21.6 Mio tonnes, while 4.9 Mio tonnes are transported<br />
on rolling road.<br />
Combined rail transport in the Alpine region accounts for<br />
17% of the total traffic (14% according to CAFT Survey<br />
2004 – Alpine Arc C). If considering only trans-Alpine freight<br />
flows, the rate of combined rail transport is 25%.<br />
Fig. A2-12: Rail transport volume crossing the Alpine arc in Mio tonnes for<br />
1994, 1999 and 2004 (Source: CAFT 2004 Survey).<br />
The Gotthard Pass is the Alpine-crossing with by far the highest<br />
volume of rail freight traffic with 15.5 Mio tonnes (an increase<br />
of 2.5 Mio from 1994) (see Fig. A2-13). The share of the<br />
Brenner Pass is also high with 10 Mio tonnes (an increase of<br />
2 Mio since 1994), followed by Semmering and Tauern.<br />
Rail freight traffic significantly increases on the Semmering<br />
(57%), Simplon (44%) and Tauern (50%) crossings from<br />
1994 to 2004. Besides significant percentage decreases on<br />
smaller Alpine crossings such as Ventimiglia and Wechsel<br />
(-50% each), the Alpine crossing of Mt. Cenis (-17%) is the<br />
only major Alpine crossing with a decrease of rail freight traffic<br />
berween 1994 to 2004.<br />
Fig. A2-13: Rail transport volumes on Alpine crossings for 1994, 1999 and<br />
2004 (Sources: CAFT 2004 Survey).<br />
Case study: The Swiss rail network<br />
Switzerland is the only country in the Alpine region where<br />
rail transport reaches a modal split rate of 64% (2004).<br />
All other countries have a rail traffic rate of between<br />
15 and 30%.<br />
Measures endorsed in Switzerland were meant to<br />
strengthen the rail network and to make it faster and<br />
cheaper to cross Switzerland by train. On the other hand,<br />
some restrictions by Switzerland on HDV exceeding a<br />
certain weight forced trucks to take other routes through<br />
the <strong>Alps</strong>, often through the Brenner crossing.<br />
A2.4 Main problems of road freight<br />
transport<br />
Considerable consequences for transnational road networks<br />
can derive from deficiencies in this sector because<br />
of the central position of the Alpine area. Another<br />
significant issue concerns modal integration and<br />
logistic transport.<br />
The fragmentation of international transport segments is a<br />
critical element from various perspectives. Increasingly complex<br />
production chains are challenging traditional modes<br />
of freight transport. Moreover, just-in-time production processes<br />
require a synchronisation of providers, producers and<br />
dealers with lower transport volumes and faster and more<br />
frequent transport movements. The interface between road<br />
and rail at intermodal platforms as well as logistic platforms,<br />
also creates inefficiencies in the road freight transport system.<br />
Different legal frameworks in the Alpine countries are<br />
additionally influencing freight transport.<br />
24
Chapter A – The Alpine Transport System<br />
A2.5 Main problems of rail freight<br />
transport<br />
Rail freight transport in the Alpine region is impeded by noncompetitive<br />
pricing structures, lack of punctuality and reliability<br />
of Alpine rail services and poor tracking of where goods<br />
are in the transport chain. The punctuality of trains operated<br />
for combined transport through major trans-Alpine corridors<br />
has recently deteriorated. In 1999, only 60% of all the trains<br />
were on time. By the first half of 2002, the amount of on<br />
time trains further diminished to just 49%. Furthermore, the<br />
average speed of international train freight services on<br />
major corridors averages around 20 km/h, which is unattractive<br />
for potential customers. Moreover service prices are<br />
often not competitive and can change widely from one operator<br />
to another.<br />
Due to the infrastructural fragmentation, the rail system is<br />
further disadvantaged in comparison to the road system.<br />
Main bottlenecks in this regard are an incomplete electrification<br />
and outdated signalling on Alpine rail corridors. This<br />
patchwork of different rail systems and the lack of integration<br />
and interoperability reduces the chances of rail companies to<br />
offer fast, reliable and efficient international services. Lack of<br />
planning, national and sub-national divergences, technological<br />
differences in rolling stock and signalling systems, different<br />
staff training as well as different management systems all<br />
represent problems that must be considered in order to forge<br />
a real integrated European railway network.<br />
Nevertheless, there are not only negative aspects and<br />
national rail networks are currently transformed into a system<br />
which will improve the freight transport sector in terms<br />
of competitiveness, flexibility and safety of the services<br />
provided.<br />
Main findings<br />
Status<br />
Combined traffic in the <strong>Alps</strong> is limited. Road transport still<br />
plays a prominent role within the transport infrastructure<br />
of the region and rail transport continues to lose shares<br />
in regard to modal split. The available rail freight services<br />
often show functional inefficiencies, especially on key<br />
corridors between Germany, Austria and Italy.<br />
The consequence is that the special ecosystem of the<br />
<strong>Alps</strong> suffers from increased noise and air pollution.<br />
Trends<br />
Rail freight transport through the <strong>Alps</strong> will be enhanced by<br />
some highly important tunnel projects (see chapters A1<br />
and D5.2), which will also have effect on freight transport<br />
of the feeder lines outside the Alpine area: Switzerland<br />
is improving the infrastructural supply by creating the<br />
new trans-Alpine tunnels of Simplon-Lötschberg (2007)<br />
and Gotthard (2014–2015). Even if the European Union<br />
already supports the development of new rail infrastructures<br />
across the <strong>Alps</strong> through the Brenner and the Lyon-<br />
Turin-tunnel, these projects are under construction or<br />
are in the phase of project definition, and they will not be<br />
accomplished before 2015–2020. Further improvements<br />
are expected from technical improvements such as for<br />
the Aiton-Orbassano rail motorway or the Tauern rail line<br />
(see chapter A1.3).<br />
Hot issues<br />
In order to redress this situation, rail freight must offer<br />
competitive and efficient services. The sector needs to<br />
respond to the customer needs, by ensuring that it provides<br />
adequate rail infrastructure capacity and that levels<br />
of investment in rolling stock are increased.<br />
The overall quality of available rail services in the Alpine<br />
region must be improved in order to shift freight from the<br />
road to rail. This is the real challenge.<br />
25
Report on the State of the <strong>Alps</strong><br />
Literatur<br />
AISCAT – Associazione Italiana Società Concessionarie Autostrade<br />
e Trafori (2005): Informazioni Valori del Traffico<br />
– Riepilogo Annuale. Roma.<br />
AlpFRail, Regione del Veneto (2006): Freight Flow System:<br />
an economical view. Work Package 5.<br />
ARE – Bundesamt für Raumentwicklung (2001): Through the<br />
<strong>Alps</strong>. Transalpine Freight Traffic across the <strong>Alps</strong>, Bern.<br />
ARE – Bundesamt für Raumentwicklung (2004): Alpinfo<br />
2004. Alpenquerender Güterverkehr auf Straße und<br />
Schiene. http://www.bav.admin.ch/themen/verkehrspolitik/<br />
00501/01414/index.html?lang=de.<br />
Italian Ministry for Transport and Infrastructure, Comitato<br />
Centrale per l’Albo degli Autotrasportatori (2005):<br />
Acquisizione ed Elaborazione Dati Specifici di attraversamento<br />
delle Alpi lungo la Direttrice del Brennero da parte del<br />
Traffico Pesante – Sintesi e Conclusioni. Roma.<br />
CNEL – Consiglio Nazionale dell‘Economia e del Lavoro<br />
(2006): La valorizzazione del Sistema-Italia nel processo di<br />
integrazione europea. GdL Informatica, Ambiente, Trasporti:<br />
Piano della Logistica e questioni dei Valichi Alpini. Roma.<br />
CSST, Elasis Fiat Group (2003): MT Model. Mathematical<br />
Models for Mobility and Transport. Turin.<br />
European Commission (2001): A Sustainable Europe for a<br />
better World: A European Union Strategy for Sustainable<br />
Development. Commission’s Proposal to the Gothenburg<br />
European Council (COM 264 Final). Brussels.<br />
European Commission (2001): EU transport policy for 2010:<br />
time to decide. White Paper of the Commission of the European<br />
Communities (COM 370). Brussels.<br />
European Commission DG TREN (2003): Revitalising<br />
Europe’s railways: Towards an integrated European railway<br />
area. Luxembourg.<br />
Federal Ministry of Agriculture, Forestry, Environment and<br />
Water Management (BMLFUW), Federal Ministry for Transport,<br />
Innovation and Technology (BMVIT), Federal Ministry of<br />
Economics and Labour (BMWA) (eds.) (2006): Environmentally<br />
Friendly Travelling in Europe. Challenges and Innovations<br />
Facing Environment, Transport and Tourism. Proceedings of<br />
the conference on 30./31. January 2006, Vienna.<br />
Houée, M. (2005): Enquéte sur le transit. Poids lourds que<br />
traversent les Alpes et les Pyrenées. Dix principales conclusiones<br />
à cause de une operativité globale. DAEI/SESP,<br />
Paris.<br />
Italian Ministry for Environment and Territory, Consulta<br />
Stato-Regioni dell’Arco Alpino (2004): Les montagnes italiennes<br />
et la Convention alpine. EURAC Collectio Alpine Convention<br />
403/99. Bolzano.<br />
Italian Ministry for Environment and Territory, INTERREG<br />
IIIB Alpine Space (2005): Scientific Workshop on Mountain<br />
Mobility and Transport (SWOMM). Coordinated by Alpine<br />
Convention International Mountain Agreement Coordination<br />
Unit. Bolzano.<br />
Italian Ministry for Transport and Infrastructure (2001):<br />
SIMPT – Information System for Transport Monitoring and<br />
Planning. The General Directorate for Planning and EU<br />
Programmes – 2001 updated to 2004. Rome.<br />
Italian Ministry for Transport and Infrastructure, Region of<br />
Veneto, INTERREG IIIb Alpine Space (2005): Transport in the<br />
Alpine Space Area. Transnational Workshop on 16./17. June<br />
2005, Venice.<br />
26
Chapter A – The Alpine Transport System<br />
A3<br />
Passenger Transport<br />
Passenger transport is the movement of people from one<br />
place to another and is presently regarded as a basic<br />
part of everyday life in modern civilisation. Living conditions<br />
in Europe have improved considerably thanks to<br />
fast transportation.<br />
Passenger transport can be distinguished by several<br />
characteristics, like the purpose (leisure, work, education,<br />
shopping etc.), the access (public or individual<br />
transport), the means of transportation (train, car, bus,<br />
aircraft) or the distance (local or long-distance traffic).<br />
In the last decades major improvements have been made<br />
in the road infrastructure. Therefore the share of individual<br />
motorised transport has increased above average.<br />
The demand for public passenger transport differs from<br />
rural areas with low population density to agglomerations<br />
and urban areas with higher population densities<br />
and therefore more potential customers.<br />
Different transport modes have different effects on<br />
population, economy and the environment. The increase<br />
in intra-Alpine traffic and individual motorised traffic<br />
along the transit routes causes more and more pressure<br />
and leads to protests by the local inhabitants. Multiple<br />
efforts and measures undertaken by local and national<br />
authorities to reduce the traffic have not been able to<br />
prevent these negative developments.<br />
Passenger transport problems within the <strong>Alps</strong> occur in<br />
particular at holiday seasons and weekends near the<br />
attractive tourist sights and also at bottlenecks in the<br />
Alpine agglomerations due to commuter traffic.<br />
The following chapter provides an overview of passenger<br />
transport by road and rail in the <strong>Alps</strong>. The modal<br />
split, individual motorised traffic and public transport,<br />
is described – mainly using examples from case studies<br />
due to the lack of data for the perimeter of the Alpine<br />
Convention.<br />
A3.1 Importance and role of passenger<br />
transport in the <strong>Alps</strong><br />
Alpine passenger transit plays an important role in the European<br />
economy, the Alpine countries and in Alpine tourism.<br />
There are several reasons for the growing importance of passenger<br />
transport, such as commuting for work and education<br />
(schools, higher education), shopping trips and leisure traffic<br />
after work and at weekends. Structural changes like the<br />
shift of labour opportunities from the countryside to small and<br />
medium-sized towns in rural areas contribute to the increase<br />
in passenger transport.<br />
Passenger transport occurs on short distances, such as<br />
between small towns, district capitals and rural areas for<br />
reasons of general livelihood and services as well as on<br />
long distances for business reasons and holidays (see<br />
chapter B4).<br />
The increase in passenger transport is distributed unevenly<br />
among the different transport modes. In the future, a further<br />
increase in passenger transport is expected, both on roads<br />
and railways.<br />
With the growing importance of tourism in the <strong>Alps</strong>, tourist<br />
traffic has risen remarkably within the last few decades. In<br />
the holidays and at weekends especially, individual motorised<br />
traffic causes congestion in tourist regions and on access<br />
routes to tourist destinations. Furthermore, it leads to<br />
overcrowded roads in and around centres and agglomerations.<br />
Case study: Passenger transport – trend in Switzerland<br />
One of the latest Swiss studies shows that passenger<br />
transport will continue to grow in the next 25 years. The<br />
car will remain the most popular means of transport, although<br />
transport by rail will become more common and<br />
provide faster services than transport by car in the next<br />
few years due to the transport policy in Switzerland.<br />
Depending on the scenario, the forecast for the increase<br />
in passenger transport performance (pkm) is about 15<br />
to 29% up to the year 2030, and public transport could<br />
grow by up to 95% – a result of the Swiss transport policy.<br />
Dynamic developments are expected for transit traffic<br />
(up to plus 45%) and leisure traffic (up to plus 31%)<br />
(ARE 2006).<br />
A3.2 Some views on the modes of<br />
passenger transport<br />
It is of special interest which means of transport people<br />
chose, as the different modes have different impacts on<br />
people and on the environment. Here the “modal split” (see<br />
Introduction A) shows the shares of each carrier for a<br />
particular spatial unit.<br />
Modal split<br />
Passenger transport systems include different modes of<br />
transport: walking, going by bicycle, public transport, or<br />
car and motorcycle. The “modal split” depends inter alia on<br />
the accessibility to public transport (or on the availability of<br />
vehicles) and on the type of area (urban, suburban, rural). In<br />
rural areas especially, there are usually no attractive types<br />
of public transport on offer, and people prefer to go by car<br />
(ARE 2003). In comparison to the non-Alpine regions, the<br />
bicycle is of minor importance in the <strong>Alps</strong>, usually due to the<br />
topographic conditions.<br />
Despite the difficult data situation general developments of<br />
modal split may be highlighted by using examples from individual<br />
countries.<br />
27
Report on the State of the <strong>Alps</strong> 2006<br />
Data issues:<br />
Comparisons of the modal split are difficult. The<br />
measurement of the modal split is mostly included in regional<br />
transportation studies. Such studies do not exist at<br />
the same level for all regions, nor do they exist for each<br />
year. Therefore a description is provided by some case<br />
studies.<br />
Generally, sufficient data on the transportation by car<br />
are obtained from yearly measurements of the number<br />
of vehicles on the roads. Different types of vehicles like<br />
passenger car, heavy goods vehicle, trailer truck etc. are<br />
documented. There is, however, no information about<br />
the transport performance (passenger-km) for the area<br />
covered by the AC.<br />
Different data (ARE 2003) on the Alpine regions show that<br />
• about 50 – 80% of the journeys in rural areas are made<br />
by car and that<br />
• in urban areas, the proportion of journeys made by car is<br />
lower than in rural areas (40 – 50%).<br />
The modal split in Innsbruck and its hinterland<br />
One example of the differences in the modal split between<br />
different types of area is the modal split currently observed in<br />
the Alpine town of Innsbruck and its surroundings as shown<br />
in Figure A3‐2. While in Innsbruck itself about 40% of the<br />
journeys are made by car, the proportion of car journeys is<br />
about 70% in the surrounding areas.<br />
A description of the use of the public transportation network<br />
is more difficult. For the rail systems, there are – in<br />
general – statistics about the number of passengers for<br />
a country as a whole. There is a lack of such information<br />
on the AC area in particular and it proved to be difficult to<br />
extract it from general statistics.<br />
Also, there are no consistent data about bus services<br />
and passengers in the Alpine Convention area. The bus<br />
services are run by different companies with different statistics,<br />
and some of these statistics are not available due<br />
to confidentiality obligations, which is another factor that<br />
complicates data comparison.<br />
The problems with on-demand systems are roughly the<br />
same: there are no area-wide data about these systems;<br />
furthermore there is no system for collecting these data<br />
nationwide.<br />
Switzerland: modal split in Alpine and non-Alpine<br />
regions<br />
Fig. A3‐1 shows the modal split in Switzerland for the year<br />
2000 in Alpine and non-Alpine regions. Cars have the highest<br />
share of transport means in Alpine and in non-Alpine<br />
regions, but their share in Alpine regions is clearly higher.<br />
Fig. A3‐2: Modal split in different types of area as shown by the example<br />
of Innsbruck (Austria) and its surroundings in 2002 (Source: Mobil in Tirol,<br />
www.tirol.gv.at, 2006).<br />
Modal split – development and trend<br />
Regarding the modal split, there has been a general shift<br />
towards the use of the car in the last two decades.<br />
For example despite major investments in Switzerland in railway<br />
infrastructure and improvements on the public transport<br />
sector the trend towards the car could not be reversed.<br />
The extension of road infrastructure in combination with high<br />
motorisation rates and pricing structures in the transport sector<br />
favoured the shift to road transport in the past few decades<br />
(see Fig. A3-3).<br />
Fig. A3‐1: Different modal split (by routes travelled) in Switzerland in<br />
Alpine and non-Alpine regions in 2000 (Source: ARE 2003).<br />
Fig. A3‐3: Modal split development as shown by the example of Ticino,<br />
Switzerland (Source: ARE 2003).<br />
28
Chapter A – The Alpine Transport System<br />
A3.3 Individual motorised transport<br />
Passenger transport which is carried out by cars and motorcycles<br />
is called individual motorised transport.<br />
Generally there are sufficient data on the transportation by<br />
car obtained from yearly automatic measurements of the<br />
number of vehicles on the roads to outline the main traffic<br />
flows. In some countries there are also two different types<br />
of automatic measurements, one counting only the volume<br />
of traffic and the other counting and classifying different<br />
types of vehicles, like passenger car, heavy goods vehicle,<br />
trailer truck, etc. There is, however, no coherent information<br />
about the transport performance (passenger-km) for the area<br />
covered by the Alpine Convention.<br />
To receive more detailed information on the origin and destination<br />
of passenger transport, traffic censuses at regional or<br />
local level and surveys of drivers are carried out. <strong>How</strong>ever in<br />
most cases these studies are carried out at project level.<br />
Indicator B7-3: Network load due to cars and trucks<br />
at automatic traffic meters in the Alpine region<br />
This indicator monitors the traffic on the main road network,<br />
using the results from automatic recording devices.<br />
Data were collected for the whole network for the years<br />
1985, 1990, 1995, 2000 and 2005 (Italian data are missing).<br />
Although a large data set is available, there are a<br />
some inconsistencies:<br />
• the recording system is not the same in all countries,<br />
• the data until 2005 are not available in all countries,<br />
• the structures of the different networks are not comparable.<br />
Fig. A3‐4: Car traffic in the <strong>Alps</strong> (Source: Austria http://www.asfinag.at/index.php?idtopic=20,<br />
Automatische Dauerzählstellen (AVZ); Switzerland:<br />
www.verkehrsdaten.ch; France: Sétra (service d’Études techniques des<br />
routes et autoroutes), Cete de l’Est: Données de l’année 2003; Slovenia:<br />
Direkcija Republike Slovenije Za Ceste, Podatki za leta: 2005; Germany:<br />
Zentrale Datenverarbeitung im Straßenbau, Dauerzählstellen, Jahresauswertung<br />
2003).<br />
The increase in car traffic continues<br />
The last 10 years have seen a continued increase in car traffic.<br />
In some places, a rate of increase of up to around 45%<br />
has been observed – a rate which varies depending on road<br />
function and capacity. Fig. A3‐5 shows the increase in car traffic<br />
on selected road segments in the <strong>Alps</strong> between 1995 and<br />
2005.<br />
Due to some of these inconsistencies it has not been possible<br />
to carry out an Alpine-wide analysis of passenger<br />
traffic. Data for some selected road sections in the Alpine<br />
area are given in Fig. A3‐4.<br />
Traffic loads on selected Alpine motorways<br />
Fig. A3‐4 shows the average numbers of vehicles per day at<br />
several measure points on Alpine motorways. On average,<br />
the motorways in the <strong>Alps</strong> have to cope with 10,000 – 30,000<br />
cars per day. The most frequented traffic routes with more<br />
than 50,000 cars per day can be found on the edges of the<br />
Alpine Convention area near the larger cities (A8 at Rosenheim<br />
in Germany, A2 at Luzern in Switzerland). The motorway<br />
with the highest traffic loads in Austria is the A12 in the<br />
Inn valley with more than 40,000 vehicles per day. In France<br />
the A41 at Chambery shows the highest number of vehicles,<br />
in Slovenia the A1 at Maribor.<br />
Additionally, routes with a variety of functions (access to tourist<br />
destinations, transit routes, access to towns and cities)<br />
are affected especially by heavy traffic.<br />
Fig. A3‐5: Development of car traffic 1995 – 2005 (Source: Data from<br />
automatic recording devices in different AC signatory states).<br />
It is assumed that the traffic volumes will continue to grow in<br />
the next few years, although not quite as fast as in the last<br />
few years. From 2000 until 2030 traffic volumes will grow on<br />
road and rail combined at the rate of 15 to 29% (depending<br />
on the scenario), but more slowly than in the past 30<br />
years. The car will still be the favoured means of transport,<br />
regardless of the disproportionately high increase in public<br />
transport (ARE 2006).<br />
Transport across the <strong>Alps</strong> is concentrated in the east<br />
When looking at traffic volumes, it is noticeable that passenger<br />
transport across the <strong>Alps</strong> is concentrated in the eastern<br />
part of the <strong>Alps</strong> (see Fig. A3‐6). In the western part, the<br />
main traffic volumes are observed along the coast in France,<br />
and in Switzerland through the Gotthard tunnel as the main<br />
29
Report on the State of the <strong>Alps</strong> 2006<br />
route. This distribution depends directly on the level of road<br />
improvement and extension.<br />
Fig. A3‐6: Passenger transport across the <strong>Alps</strong> for 2004/2005 (Source:<br />
Automatic recording devices of the different signatory states;<br />
FR: Observatoire des trafics à travers les Alpes Edition 2006).<br />
Purpose of trans-Alpine traffic<br />
Data about the purposes of trans-Alpine passenger transport<br />
do not exist Alpine-wide. But some information can be drawn<br />
from a national study in Switzerland.<br />
Case study: Trans-Alpine passenger transport in<br />
Switzerland<br />
In Switzerland, a study of passenger transport crossing<br />
the <strong>Alps</strong> was completed in 2001. The results show that<br />
about half (55%) of the road journeys and 44% of the rail<br />
journeys were made for holiday purposes. To this already<br />
high percentage the share of road transport for leisure<br />
purposes of 29% and of 33% for rail traffic has to be<br />
added (ARE 2001).<br />
• Motorised passenger traffic around urban areas is often<br />
influenced by commuting for work or educational purposes.<br />
Main problems are congestion on the access roads<br />
and in smaller settlements which are not suited to the<br />
increased traffic volume.<br />
• Inner-urban transport problems are characterised by<br />
congestion in main access streets, parking problems and<br />
traffic safety problems between different mixed transport<br />
modes such as car, bicycle or pedestrians.<br />
Due to these problems, several solutions in the major<br />
agglomerations were conducted or are in the planning phase.<br />
These solutions comprise for instance the development of<br />
transport plans (see box), access rights for private cars to<br />
inner cities, extension of public transport, cycle lanes or car<br />
park management.<br />
One central factor for urban traffic as well as for traffic on<br />
main roads is the cost of road traffic. Therefore road pricing<br />
will influence the chosen transport mode and may financially<br />
support the development of public transport options.<br />
A3.4 Public transport<br />
A3.4.1 Rail transport<br />
Transport by rail is one of the most important alternatives to<br />
motorised passenger traffic. Rail transport is important public<br />
transport at two levels: local and regional trains provide connections<br />
between core towns and their surroundings, long<br />
distance trains offer national and international connections.<br />
There are two sides of the rail transport development: on<br />
the one hand, light railways have been closed down and replaced<br />
by bus services in some of the peripheral regions;<br />
on the other hand, passenger transport performance has increased<br />
in some areas, namely near towns and cities (commuter<br />
traffic) and on long-distance railway lines.<br />
Case study: Traffic calming measures in the Alpine<br />
towns and cities<br />
Due to ongoing noise and air emissions in towns and<br />
cities (see chapters C3.1 and C3.2) some municipalities<br />
have started to formulate urban transport plans.<br />
Fig. A3‐7: Purpopse of passenger transport across the <strong>Alps</strong> in Switzerland<br />
(Source: ARE 2001).<br />
Urban traffic<br />
The statistics show that the main traffic volumes can be<br />
found around towns and cities. As social and economic centres,<br />
towns and cities are the main attractions of a region<br />
and, consequently, face more traffic.<br />
For urban passenger traffic a distinction can be made<br />
between inner-urban passenger transport and the traffic<br />
flows around the core cities, which are the subject of different<br />
management methods:<br />
Transport plans exist in Austria, for example in Salzburg,<br />
Innsbruck, Bregenz, Villach and Klagenfurt. But transport<br />
plans are (in Austria) not legally binding and so they act<br />
more or less as a mere memorandum of understanding.<br />
In Italy, communities with more than 30,000 inhabitants<br />
are obliged to implement an urban transportation plan.<br />
In the last few years, several Italian towns and cities in<br />
the <strong>Alps</strong> have implemented a number of measures like<br />
parking space management, traffic restrictions in the<br />
town and city centres, pedestrian zones, bicycle lanes or<br />
programmes for the development of innovative vehicles<br />
(Alpenkonvention 2004). For details see chapter D4.1.<br />
30
Chapter A – The Alpine Transport System<br />
As data about passengers are not available for the whole Alpine<br />
Convention perimeter, only the examples for the French<br />
<strong>Alps</strong> (see box) and Switzerland as a whole can be given.<br />
Case study: Passenger transport by rail in French<br />
provinces<br />
For the Alpine space, there are only a few data about<br />
the usage of the railway system. Most data refer to the<br />
relevant countries as a whole. National data show a general<br />
increase in passenger transport by train in the last<br />
few years, with the exception of Slovenia.<br />
There is one example which shows an increase in passenger<br />
transport by rail: in the French Provence-Alpes-<br />
Côte-d’Azur and the Rhône-Alpes regions, rail passenger<br />
transport volumes have risen by about 38 – 54%.<br />
The five least and the five most frequented rail connections<br />
from these selected tracks are shown in table A3-1. They<br />
point up the range of use, from only three train journeys on<br />
the Chambéry-Torino section, up to 93 journeys per day on<br />
the section between Genève and Lausanne – most of them<br />
long-distance connections. In total on the 65 railway sections,<br />
1,725 trains are available per day, of which 811 local<br />
trains and 914 long-distance trains.<br />
A3.4.2 Bus transport and local transport<br />
systems<br />
In Alpine regions, bus transport is an important – sometimes<br />
even the only – public transport system, connecting peripheral<br />
regions with the central facilities. Because of the morphology<br />
(relief) in mountainous regions, bus services are often<br />
easier and more flexible to provide than railways for local<br />
passenger transport outside the agglomerations.<br />
Due to the trend towards transport by privately owned cars,<br />
bus transport systems run the risk of being reduced to a<br />
minimum service, e.g. for school transport, as there are not<br />
enough passengers and some bus services are then no<br />
longer cost-effective. The consequence is an increasingly<br />
unattractive public transport system in peripheral areas and<br />
therefore fewer passengers – a vicious circle.<br />
<strong>How</strong>ever, in most countries in the <strong>Alps</strong>, efforts have been<br />
made to stop this negative development. There are at least<br />
some national examples of effective regional bus systems<br />
offering attractive public transport.<br />
Fig. A3‐8: Development of passenger transport by rail in France<br />
(Source: DAEI/SESP).<br />
The Swiss railroad company SBB reports raising passenger<br />
numbers and also passenger kilometres over the last years.<br />
The number of passengers transported rose from 275.9 Mio<br />
passengers in 2005 to 285.1 Mio in 2006; at the same time<br />
the passenger kilometres rose from 13,830 Mio to 14,267 Mio.<br />
To compensate for the lack of passenger data, the numbers<br />
of local trains and long-distance-trains per day of selected 65<br />
track sections were examined by the UBA Wien.<br />
From<br />
To<br />
Local<br />
trains<br />
Long distance<br />
trains<br />
Sum<br />
Chambéry Torino 0 3 3<br />
Villach Trieste 1 5 6<br />
Graz Maribor 1 7 8<br />
Grenoble Gap 8 0 8<br />
Villach Ljubljana 7 2 9<br />
. . . . .<br />
München Rosenheim 34 18 52<br />
Luzern Bern 32 21 53<br />
Bregenz Feldkirch 45 9 54<br />
Zürich Bern 5 54 59<br />
Genève Lausanne 22 71 93<br />
Tab. A3‐1: The least and most frequented rail connections presented as<br />
trains per day for 2006 (Source: UBA Wien 2006).<br />
Alpine passenger transport (Source: Postbus Austria).<br />
Some regional and national bus companies developed historically<br />
from post buses, e.g. the Austrian “Postbus” company<br />
founded in 1907 originally for post- and telegraph matters,<br />
or the Swiss PostBus Ltd. founded in 1906.<br />
Indicator B7-5: Passengers conveyed by regional bus<br />
Indicator B7-6: Number of municipalities with regular<br />
or on-demand services<br />
For the Alpine space there are no coherent data on the<br />
development and status of passenger transport by bus or<br />
on-demand systems. But the situation can be highlighted<br />
by some case studies for Austria, Switzerland and Italy,<br />
which are presented below.<br />
31
Report on the State of the <strong>Alps</strong> 2006<br />
Postbus in Austria<br />
The Postbus company in Austria is organised in seven regional<br />
managements. In total Austria the Postbus company<br />
has a market share of approx. 70% of regional bus transportation,<br />
approx. 50% of the entire bus transportation and approx.<br />
20% of the entire local public passenger transportation<br />
(ÖPNV). The buses serve almost all municipalities in Austria<br />
with about 20,000 bus stops, travel in total 120 million km/<br />
year and have 235 Mio passengers/year. Fig. A3-9 shows<br />
the km/year driven by Postbus for each region, data only for<br />
the area of the Alpine Convention were not available.<br />
Fig A3-9: Total distance driven yearly by Postbus in Mio km per year<br />
(Source: ÖBB-Postbus GmbH 2006).<br />
PostAuto in Switzerland<br />
The Swiss PostAuto Ltd. delivers roughly 50% of overall carrying<br />
capacity in regional public transport. Its network consists<br />
of over 10,450 km (three times as large as the Swiss Federal<br />
Railway’s system with 3,034 km). Over 100 Mio passengers<br />
travelled 94 Mio km in 2006. As well as the regional and local<br />
lines it also serves several so-called “Route Express Lines”<br />
in the Swiss <strong>Alps</strong>, leading over passes and connecting as far<br />
as Meran in Italy (Swiss PostBus Ltd.n.d.).<br />
A new policy concerns the expansion in the neighbouring<br />
countries, especially in the niche markets with fewer than<br />
150,000 inhabitants. Some regions in France are already<br />
served, like the Bourg-en-Bresse area in the French Alpes,<br />
where since 2006, 75,000 inhabitants have travelled<br />
1,450,000 km/year in 30 buses. This can be interpreted as<br />
an encouraging sign for a development towards a more sustainable<br />
mobility, particularly as this service has to be costeffective<br />
in economic terms (Source: http://www.post.ch/fr/<br />
pag_nat_carpostal_france_sarl?jsdimA=13863&jsdimB=1,<br />
accessed 11 April 2007).<br />
On-demand systems<br />
A new form of public transportation is the on-demand system.<br />
This is a transport system which runs only when required.<br />
It is especially suitable for peripheral areas where<br />
the operation of a regular bus service is not economic. Ondemand<br />
systems include shared taxis or buses with a fixed<br />
timetable, but which run only if a customer calls and books<br />
this service.<br />
Case study: Shared taxis in Austria<br />
In some parts of the federal provinces of Niederösterreich,<br />
Salzburg, Tirol, Kärnten and Vorarlberg, shared taxis<br />
are part of the public transport system. They are in use<br />
especially on the outskirts of the regional capitals. The<br />
on-demand system substitutes for the common public<br />
transport systems. The main target groups are women<br />
and young people.<br />
There are four types, fulfilling slightly different functions.<br />
The first type is a shared taxi on demand (“Anrufsammeltaxi”),<br />
practised as a mixture of line operation and<br />
non-scheduled traffic. There is a timetable and fixed stations,<br />
but the station is only serviced if a passenger is<br />
announced. The second type is a city taxi, which differs<br />
from normal taxis only in the fixed price; it also offers subsidised<br />
prices for kids and teenagers. An example of this<br />
system is the night-taxi in Villach, which serves the whole<br />
urban area between 9.00 p.m. and 5.00 a.m. There are<br />
three different price-zones (3, 6 or 9 km), the passengers<br />
pay with vouchers bought from the municipality. Each<br />
voucher is subsidised by the municipality. In 2003 more<br />
than 45,000 vouchers were sold.<br />
Another variant of normal taxis are those which connect<br />
to the terminal stations of public transport services (bus<br />
or rail) which can be shared by several passengers. The<br />
last type are line taxis which fill the gaps of conventional<br />
public transport. An example of this type is the bus taxi in<br />
Salzburg, which was conceived as a substitute for public<br />
buses and runs at night-time between 11.30 p.m. and<br />
1.30 a.m. There are defined departure stations in Salzburg<br />
and 12 routes are served. They run every half hour<br />
and take from one to four people. There are fixed prices<br />
of 3 € per person and ride. About 4.000 people per month<br />
are using it (WKO n.d.).<br />
The advantages of this kind of on-demand system are<br />
flexibility and customer orientation.<br />
Dolomiti Bus in Italy<br />
A case study describing a good regional bus system is the<br />
“Dolomiti Bus” in the province of Belluno (Italy). The Dolomiti<br />
Bus network connects 67 communities and covers 3,612<br />
square kilometres. More than 7.1 Mio kilometres are travelled<br />
by the Dolomiti Bus in one year and about 8 million<br />
passengers are transported (www.dolomitibus.it).<br />
32
Chapter A – The Alpine Transport System<br />
A3.4.3 Soft measures<br />
Soft measures aim to increase more sustainable transport<br />
modes and to reduce energy consumption by motivating<br />
people to use their cars less. This aim can be achieved by<br />
several types of measures, sometimes called soft measures,<br />
sometimes called smart measures. Some of these options<br />
are (Cairns et al. 2004):<br />
• increased awareness from better information on the<br />
impacts of motorised traffic,<br />
• travel awareness campaigns,<br />
• information and marketing of public transport possibilities,<br />
• new patterns of car use like car sharing,<br />
• implementation of travel plans for workplace and school,<br />
and<br />
• new ways of organising activities like home-shopping,<br />
video-conferencing and teleworking.<br />
Bibliography<br />
Alpenkonvention, Bundesministerium für Umwelt, Naturschutz<br />
und Reaktorsicherheit (2004): VIII. Tagung der Alpenkonferenz,<br />
Top 7 Verkehr, 16. November 2004, Garmisch-<br />
Partenkirchen.<br />
ARE – Bundesamt für Raumentwicklung (2001): Alpen- und<br />
grenzquerender Personenverkehr 2001 (A+GQPV), Schlussbericht.<br />
Bern.<br />
ARE – Bundesamt für Raumentwicklung (2003): Dossier 2.03<br />
– Fakten und Hintergrundinformationen zur Raumentwicklung.<br />
Bern .<br />
ARE – Bundesamt für Raumentwicklung (2006): Perspektiven<br />
des schweizerischen Personenverkehrs bis 2030.<br />
Cairns, S., Sloman, L., Newson, C., Anable, J., Kirkbride, A.,<br />
Goodwin, P. (2004): Smarter choices – Changing the Way we<br />
travel. Final report of the research project: “The influence of<br />
soft factor interventions on travel demand”. London.<br />
ÖBB-Postbus GmbH (2006): Leistungsbericht 2005. Wien.<br />
Swiss PostBus Ltd. (no date): Swiss <strong>Alps</strong> 2007. Interlaken.<br />
WKO – Wirtschaftskammer Österreich (no date): Das Taxi im<br />
ÖPNV. Richtig eingesetzt. Rund gelöst. Bedarfsgesteuerte<br />
Systeme im ÖPNV. Wien.<br />
Main findings<br />
Status<br />
The private car still is the most commonly used mode<br />
of passenger transport, and it is expected to remain as<br />
such. Alpine transit routes, as well as peripheral routes<br />
providing access to tourist destinations and urban access<br />
roads, face high individual motorised traffic loads.<br />
Frequent public transport services offering a dense network<br />
are mainly available in agglomerations. Peripheral<br />
areas face the risk that bus services and light rail links<br />
cannot be operated economically and may decline.<br />
But the examples of the Austrian Postbus and the Swiss<br />
PostAuto show that bus services are still in demand and<br />
available. The successful expansion of the Swiss PostAuto<br />
in France could serve as a model for public passenger<br />
transport and mobility for other regions.<br />
Most regions have developed transport plans focusing on<br />
sustainability and the use of public means of transport.<br />
Trends<br />
There will be an increase of passenger transport in general,<br />
both on rail and road. Traffic to leisure and tourist<br />
destinations will play an increasing role in the traffic<br />
volumes.<br />
Depending on the attractiveness of the service, a shift of<br />
modal split towards rail may also be achievable, as the<br />
Swiss example proves.<br />
Amendments to and substitutions for traditional public<br />
transport will further develop, such as on-demand<br />
systems. Soft measures may additionally provide further<br />
options for developing sustainable passenger transport.<br />
Hot issues<br />
Individual motorised traffic will continue to increase in<br />
the future, and it is likely that transport infrastructures<br />
will be overburdened by this growth. Therefore intelligent<br />
traffic management as well as appropriate infrastructure<br />
will become crucial. The successful implementation of<br />
other transport modes such as attractive public transport,<br />
on-demand systems, etc. will be also a question of timeliness.<br />
33
Chapter B – Driving Forces of Mobility and Transport<br />
B<br />
Driving Forces of Mobility<br />
and Transport<br />
which was adopted on 17 May 2006. Among other things,<br />
this mountain region is characterised by the high risk potential<br />
of its natural space and its steep landscape. Only a small<br />
part of the region is suitable for year-round settlement.<br />
The human being: in the focus of the system<br />
One of the main objectives of a modern transport policy is to<br />
ensure sustainable mobility on a national as well as on a regional<br />
level. In this context, it is necessary to satisfy the need<br />
for mobility of all population groups and of different regional<br />
segments in a manner that is economically sustainable and<br />
efficient as well as environmentally sensible. Therefore, human<br />
beings are the main focus of the transport issue, because<br />
they are the originators and the beneficiaries, as well<br />
as those who suffer because of the transport system; in the<br />
end they are the standard of assessment. The differences<br />
between these roles may disappear from time to time. Depending<br />
on the region and the point in time, human beings<br />
may play one role or quite often even several roles simultaneously.<br />
A population group living close to a motorway, for<br />
instance, will have a different opinion on the traffic passing in<br />
front of its windows than will tourists travelling to their holiday<br />
resort. If the above-mentioned residents drive to their holiday<br />
resort or to work themselves, the roles are reversed.<br />
Chapter B1 addresses the most important factor within this<br />
system: the geographical distribution of the population and its<br />
demographic development within the region. These factors<br />
give information on the potential demand for mobility and<br />
traffic and their respective distribution. It can be safely assumed<br />
that in highly-populated regions and their catchment<br />
areas a great deal of traffic is going back and forth from and<br />
to workplaces, schools and businesses. The population density<br />
similarly plays an important role with regard to the equipment<br />
of infrastructures (leisure time, professional education,<br />
employment) and the supply of public services (medical<br />
care, public transport). The distribution of these infrastructures<br />
has an influence on both the amount of traffic and the<br />
supply of the traffic infrastructure, as well as the means of<br />
transportation.<br />
Within the Alpine arc, regions exist with both a high, concentrated<br />
population and a low, dispersed population. Offering<br />
reasonably-priced transport services in regions with a low,<br />
dispersed demand poses quite a challenge with regard to the<br />
development of an infrastructure that is socially compatible<br />
and as environmentally friendly as possible. For this reason,<br />
regional development authorities are confronted with the crucial<br />
task of setting up the framework conditions to ensure<br />
an adequate basic supply as well as sufficient employment<br />
opportunities.<br />
The location: a sensitive area<br />
The region in which traffic movements occur is equally of<br />
special importance. Due to its special characteristics, the<br />
Alpine region in particular can be considered as one of the<br />
most sensitive regions in Europe. Therefore, the EU had<br />
good reasons for including this region in the “sensitive areas”<br />
and listing it in its Road Charging Directive 2006/38/EC,<br />
In the valleys or the accessible terraces, where most of the<br />
region’s population lives, different intentions for using the<br />
scarce commodity of “space” are competing with each other.<br />
In this context, traffic becomes even more important, especially<br />
since its effects (spread of noise, pollutants etc.) extend<br />
beyond the area concerned. Chapter B3 deals with the<br />
actual land-use changes of the regions.<br />
The economy: a motor<br />
Sometimes, economic development and traffic are closely<br />
linked. Thus, the economic development of a region also<br />
depends on its accessibility and, consequently, on the opportunities<br />
for exchanging goods and services. Accessibility<br />
defines the quality of a geographic location with regard to<br />
potential opportunities for establishing contacts, making visits<br />
or exchanging goods and services. It is also a standard<br />
for the benefits that resident citizens or companies theoretically<br />
derive from the quality of a location’s accessibility. Good<br />
accessibility may be an essential criterion for the survival of<br />
certain economic sectors depending on additional income<br />
from other sectors. It may create economic benefits both<br />
within and outside the Alpine region.<br />
At the same time it needs to be emphasised that a vital mountain<br />
region cannot depend on accessibility alone. In fact,<br />
several surveys found that an improvement of the accessibility<br />
led neither to a relocation of jobs to the periphery nor<br />
to a stop of the population decline (Institut für Länderkunde<br />
2001).<br />
Where accessibility affects economic development, the economy<br />
will become the primary source of influence for goods<br />
traffic. Furthermore, logistic development and traffic policy<br />
also have a great impact on the development of goods traffic<br />
(ARE 2004). In this context, the development surrounding<br />
the Alpine arc is just as crucial as the development within it:<br />
division of labour, economic growth, consumption patterns<br />
and the single market are just a few key factors that play<br />
a role with regard to the extent of traffic movement caused<br />
by the economy. Chapter B2 addresses the economy as a<br />
motor for traffic development.<br />
In this context, tourism plays a special role. Due to the trend<br />
of more frequent but shorter stays prevailing in this sector,<br />
individuals travelling by car attach even greater importance<br />
to a comfortable and fast access to their destination. At the<br />
same time, this sector in particular depends on a peaceful<br />
and scenic landscape which is free of traffic-related nuisance<br />
(see chapter B4).<br />
Bibliography<br />
ARE – Bundesamt für Raumentwicklung (2004): Perspektiven<br />
des schweizerischen Güterverkehrs bis 2030. Hypothesen<br />
und Szenarien. Bern.<br />
Institut für Länderkunde (ed.) (2001): Bundesrepublik<br />
Deutschland. Verkehr und Kommunikation. CD.<br />
35
Report on the State of the <strong>Alps</strong><br />
B1<br />
Population in the <strong>Alps</strong><br />
The demand for transport is derived from people’s<br />
requirements to earn a living, enjoy leisure activities,<br />
consume goods and utilise services. Thus, demographic,<br />
economic and social factors create demand for mobility<br />
and also for traffic. On the other hand, transport influences<br />
these three factors, making some places more<br />
desirable than others for living in, or for starting up and<br />
carrying on an economic activity and bringing development.<br />
Public accessibility to places, services, goods and<br />
places of work is one of the main factors that influence<br />
the vitality of the Alpine arc. In the most peripheral areas<br />
the average accessibility of services in general is more<br />
difficult and the demand for it is harder to satisfy. Thus,<br />
these areas are less attractive for living in, and dependency<br />
on individual car transport is high.<br />
In contrast to peripheral areas, the densely populated<br />
areas are the sources and causes of pollution and traffic.<br />
These are also areas that offer more opportunities to<br />
develop the public transport system.<br />
Representing a crucial driver for transport and mobility,<br />
demographic development, population distribution and<br />
migration as well as the special issue of population density<br />
in the Alpine area are presented in this chapter.<br />
B1.1 Demographic development<br />
The present provisional delineation of the Alpine Convention<br />
area comprises 190,558 km² (Ruffini et al. 2004). In 2004<br />
about 14 Mio people were living in this area.<br />
Today the population in the Alpine Convention area is twice<br />
as many as it was at the end of 19 th century (BMU 2004).<br />
Austria and Italy together with 55.5% represent the largest<br />
share in the Alpine Convention area. More than half of the<br />
Alpine population (53.5%) is concentrated in these two parts<br />
of the <strong>Alps</strong>.<br />
B1.1.1 Population change since the end of<br />
the 20 th century<br />
During the 1990s the population increased in the Alpine<br />
Convention area by 7.8% (see Tab. B1‐1). The demographic<br />
process is not homogeneously spread across the Alpine<br />
regions. Areas with growth and decline are located closely<br />
together. The highest population growth was registered in<br />
Germany and in Liechtenstein. In contrast, the lowest was<br />
recorded in the Slovenian <strong>Alps</strong>.<br />
It has to be noted that a cluster of municipalities along the<br />
Italian Alpine sector which includes the area from Liguria to<br />
Lago di Garda is facing a steady decrease in population (Map<br />
B1‐1). Also several municipalities in the provinces of Belluno<br />
and Udine have recorded a decline in population. The same<br />
tendency is observed in the Slovenian Alpine region and in<br />
Austria throughout eastern Steiermark and in the southern<br />
parts of Niederösterreich too. Even in the Swiss Cantons of<br />
Uri, Bern and in the northern part of Ticino the population<br />
has decreased.<br />
In contrast, population growth is observed in the Central<br />
Alpine regions. The provinces of Oberbayern, Salzburg,<br />
Tirol, Vorarlberg, Alto Adige, Trentino, the majority of Cantons<br />
in the western parts of Switzerland and Liechtenstein<br />
have all recorded an increase in population.<br />
In these prospering regions of the <strong>Alps</strong> an increase in urbanisation<br />
of the valleys’ centres has been registered. Due<br />
to the influence of booming tourism the population has even<br />
increased in remote municipalities that are not easily accessible,<br />
e.g. touristic centres in the Swiss <strong>Alps</strong>, French <strong>Alps</strong> etc.<br />
(StMWIVT 2004, Hornung & Röthlisberger 2005).<br />
In fact the French <strong>Alps</strong> show a heterogeneous demographical<br />
pattern, where depopulated regions and dynamic regions<br />
alternate within a narrow space. A large number of municipalities<br />
have achieved a high relative population growth of<br />
more than 25%. In contrast, the south Alpine areas and the<br />
regions close to the main Alpine ridge are characterised by a<br />
distinctive population decrease.<br />
Change in inhabitants<br />
Country Area [km²] Municipalities Inhabitants 2 Population density<br />
1<br />
[%]<br />
[inhabitants/km²]<br />
1 2 3 4 5 6<br />
Austria 54,620 1,148 3,255,201 +4.8 60<br />
France 40,804 1,749 2,453,605 +9.2 60<br />
Germany 11,072 3 285 3 1,473,881 +15.7 133<br />
Italy 51,184 1,756 4,210,256 +5.7 82<br />
Liechtenstein 160 11 34,600 +13.2 229<br />
Monaco 2 1 32,020 +6.8 16,010<br />
Slovenia 7,864 60 661,135 +1.2 84<br />
Switzerland 24,862 944 1,827,754 +13.1 74<br />
<strong>Alps</strong> 190,568 5,954 13,948,452 +7.8 73<br />
Tab. B1‐1: Population change and density in the Alpine Convention area during the 1990s (Sources: AT (UBA), FR (IFEN), DE (LfStaD), IT (ISTAT), LI (AVW),<br />
SI (Statistical Office of the Republic of Slovenia), CH (FSO).<br />
1) Date of survey: AT: 2005, DE, IT, LI, SI and CH: 2004, MC: 2000, FR: 1999.<br />
2) Due to data availability the reference year varies between 1987 and 2001: MC: 1990/2000, AT: 1991/2001, FR: 1990/1999, DE: 1987/2000, IT: 1990/2000, LI: 1990/2000,<br />
SI: 1991/2000, CH: 1990/2000.<br />
3) Not included 10 municipality-free areas.<br />
36
Map B1‐1: Population trend in Alpine municipalities between 1990 and 2001.
Report on the State of the <strong>Alps</strong><br />
Development of the Alpine Convention municipalities<br />
The trends of the Alpine-wide population change at municipality<br />
level between 1990 and 2000 can be summed up as<br />
follows:<br />
• 25.7% (1,535) of municipalities suffer a population decrease<br />
of more than 1%,<br />
• 6.6% (395) are stagnating as their population change<br />
ranged between ±1%,<br />
• 57.8% (3,448) had a population growth between 1 and<br />
25%, whereas for 9.6% (574) an even higher increase<br />
was recorded.<br />
In 2000 4,547 (76.4%) of all municipalities counted fewer<br />
than 2,500 inhabitants. These municipalities cover only<br />
27.1% of the Alpine population. One third of all Alpine<br />
municipalities were inhabited by fewer than 500 people<br />
(Tab. B1‐2). In less than 0.2% of all municipalities more than<br />
5,000 inhabitants were registered.<br />
A high percentage of the Alpine population (20.1%) is concentrated<br />
in municipalities with 2,500 to 5,000 people. About<br />
35.7% of the people live in urban centres of between 5,000<br />
and 25,000 inhabitants. And another 17.1% live in cities with<br />
more than 25,000 inhabitants.<br />
<strong>How</strong>ever the analysis of the population decrease in the<br />
1990s shows that the smallest and the largest municipalities<br />
in terms of population are more often affected by a reduction<br />
in the number of inhabitants. In other words, those municipalities<br />
with between 2,500 and 25,000 inhabitants are less<br />
affected by a population decrease.<br />
The smallest municipality in the <strong>Alps</strong> is Rochefourchat<br />
(Drôme) with only one inhabitant. In 1870, 150 people lived<br />
in this municipality. The small municipalities are those which<br />
register the highest relative population change. For example,<br />
in Monestier-d’Ambel/Isère a decrease from 65 inhabitants in<br />
1990 to just 20 (–69.2%) has been recorded.<br />
On the other hand, strongly rising rates are also possible. For<br />
example, Aucelon/Drôme recorded a growth from 18 to 41<br />
inhabitants, an increase of 128%. Consequently the smaller<br />
the municipalities are, the higher the relative rate of change<br />
could be. These large relative changes in small municipalities<br />
are obviously also a statistical phenomenon.<br />
B1.1.2 The large centres of the Alpine arc<br />
The development of the centres and agglomerations is very<br />
important both for trans- and intra-Alpine transport. The centres<br />
and the agglomerations (see box on Periurbanisation)<br />
constitute a living space for a large number of people with<br />
specific mobility requirements. Moreover they are connected<br />
with the economies outside the Alpine arc, host tourist attractions<br />
and offer a wide range of services and jobs. Last but not<br />
least they create a high number of commuters.<br />
In the Alpine arc a large share of the population is concentrated<br />
in cities and larger municipalities (Perlik & Debarbieux<br />
2001). Those municipalities that, in the European context,<br />
are nothing but “small municipalities”, are considered as<br />
“centres” in the Alpine arc. About 55% of the Alpine population<br />
lives in municipalities with more than 5,000 inhabitants<br />
(Tab. B1‐2), whereas 35% of the people are concentrated in<br />
cities with more than 10,000 residents. These small urban<br />
centres play a major role in the surrounding communities.<br />
Hence the establishment of urban centres within the <strong>Alps</strong><br />
and the ongoing process of periurbanisation has led to a<br />
change in living standards. The <strong>Alps</strong> no longer constitute<br />
a rural area with a rural population. They have become the<br />
preferred residence for people who want to combine the<br />
advantages of urban infrastructure with the attractiveness of<br />
unspoilt countryside.<br />
Population<br />
classes 1<br />
Number of<br />
municipalities<br />
Share on total<br />
number of municipalities<br />
[%]<br />
Number of<br />
inhabitants 1<br />
Share on<br />
total population<br />
[%]<br />
Number of municipalities<br />
with decreasing<br />
inhabitants<br />
during the 1990s 2<br />
Share of municipalities<br />
with decreasing inhabitants<br />
during the 1990s 2 on<br />
relative municipalities of<br />
population class [%]<br />
1 2 3 4 5 6 7<br />
< 500 1,876 31.5 445,588 3.2 684 36.5<br />
500 – < 1,000 1,099 18.5 797,585 5.7 309 28.2<br />
1,000 – < 2,500 1,572 26.4 2,551,301 18.2 419 26.5<br />
2,500 – < 5,000 816 13.7 2,810,900 20.1 168 20.5<br />
5,000 – < 10,000 367 6.2 2,476,149 17.7 67 18.6<br />
10,000 – < 25,000 175 2.9 2,522,397 18.0 42 23.6<br />
25,000 – < 50,000 35 0.6 1,166,367 8.3 13 38.2<br />
≥ 50,000 14 0.2 1,228,738 8.8 5 35.7<br />
Total <strong>Alps</strong> 5,954 100.0 13,989,025 100.0 1,707 28.7<br />
Tab. B1‐2: Overview of municipality types and the population structure [Source: AT (UBA), FR (IFEN), DE (LfStaD), IT (ISTAT), LI (AVW), SI (Statistical Office<br />
of the Republic of Slovenia), CH (FSO)].<br />
1) Date of survey: AT: 2005, DE, IT, LI, SI and CH: 2004, MC: 2000, FR: 1999. Does not include the ten German municipality-free areas.<br />
2) Due to data availability the reference year varies between 1987 and 2001: MC: 1990/2000, AT: 1991/2001, FR: 1990/1999, DE: 1987/2000, IT: 1990/2000, LI: 1990/2000,<br />
SI: 1991/2000, CH: 1990/2000.<br />
38
Chapter B – Driving Forces of Mobility and Transport<br />
Periurbanisation..<br />
..is a spatial process of expansion of a town towards more<br />
and more distant areas to form an urban continuum.<br />
According to Perlik (1999), periurbanisation in the <strong>Alps</strong><br />
shows the same tendency as observed in non-Alpine<br />
towns: the urban centres stagnate whereas the peripheral<br />
municipalities grow. The growth of the urban area is thus<br />
basically due to the growth of the municipalities surrounding<br />
the centre.<br />
In the work of Perlik, on the basis of the available data,<br />
agglomerations have been determined for all the major<br />
Alpine cities with 50,000 inhabitants or more. Based on<br />
the centroids of the municipalities, all the municipalities<br />
within a radius of 10 km of the major cities have been<br />
assigned to the respective agglomeration. For every agglomeration<br />
the total population has been determined.<br />
Case study: Switzerland<br />
The structural change of the Alpine areas in Switzerland<br />
can be illustrated as a practical example of rural development.<br />
The Swiss urban centres and those municipalities<br />
situated closely to these cities have a meaningful population<br />
increase, whereas the rural areas are suffering from<br />
a significant population decrease. While in 1930 only<br />
one third of the population (36%) lived in urban areas,<br />
this proportion had more than doubled by 2003 (73%).<br />
Since the mid 1960s the urbanisation process has been<br />
concentrated on small centres and on the agglomeration<br />
belts. Consequently even for larger centres a population<br />
decrease was partly detected. Due to the improved infrastructure<br />
services the number of regions with declining<br />
population has diminished in recent years. Hence since<br />
the 1990s the population in rural areas has been growing<br />
a little more strongly compared to the urban centres<br />
(Swiss Federal Statistical Office 2004).<br />
According to the delineation of agglomerations in Switzerland,<br />
the number of urban agglomerations rose from 24 to 50<br />
between 1950 and 2000 (ARE 2003).<br />
Furthermore, it was pointed out that about 71% of the jobs<br />
in the whole Alpine area are already concentrated in these<br />
centres (Favry et al. 2004). Therefore these centres are<br />
important places for the economic and demographic development<br />
of Alpine regions. Many of these municipalities are<br />
located on the Alpine fringe, where they are affected by the<br />
large metropolises bordering the <strong>Alps</strong> like Milano, Torino,<br />
Lyon, München or Wien (Perlik & Debarbieux 2001). These<br />
metropolises located close to the Alpine arc have a strong<br />
impact on the settlement activities at the Alpine fringe. As the<br />
concentration in the periurbanisation area is still continuing<br />
traditional intra-Alpine centres will lose their former importance<br />
(Pfefferkorn et al. 2005).<br />
The larger centres within the Alpine arc are located mainly in<br />
the river basins and large intra-Alpine valleys (Etsch, Rhône,<br />
Inn, Aosta, Isère). Thus external and internal accessibility<br />
play a significant role. Moreover, all big intra-Alpine cities<br />
with more than 50,000 inhabitants are very easily accessible<br />
from the outer-alpine area by highways, railways etc.<br />
(see Map B1‐2) (Torricelli 1996).<br />
The comparison of the population development between the<br />
metropolises and their bordering agglomeration belts shows<br />
a higher growth rate in the belts than in the metropolises<br />
themselves. The tendency towards periurbanisation seems<br />
to be increasing in the Alpine regions.<br />
Thus a remarkable population growth in the agglomeration<br />
belts becomes apparent, whereas the growth rate of<br />
the urban centres is decreasing (cp. Tab. B1‐3). This extraordinary<br />
dynamic development in the agglomeration belts is<br />
the reason for the less significant growth and stagnation in<br />
the Alpine metropolises.<br />
The urbanisation process has had an important impact on the<br />
spatial structure of land use in the Alpine arc. Centres with<br />
favourable local conditions have achieved a higher population<br />
growth and the establishment of new enterprises, as well<br />
as the strengthening of existing enterprises. And, as commuting<br />
plays a fundamental role in these areas, the transport<br />
infrastructure is of great importance.<br />
Concerning the development of large “Alpine metropolises“,<br />
a decrease in population can be observed in six of these<br />
municipalities (cp. Tab. B1‐3). As these centres are closely<br />
interlinked with their surrounding hinterland it is not sufficient<br />
to analyse them exclusively. Because of their socioeconomic<br />
and cultural importance and their influence on the surrounding<br />
hinterland, the Alpine metropolises and their periurbanisation<br />
areas are destined to be a dynamic development<br />
area.<br />
Urbanisation in Pfronten / Germany (Photo: S. Marzelli).<br />
39
Report on the State of the <strong>Alps</strong><br />
Municipalities<br />
State<br />
Inhabitants<br />
2000<br />
Inhabitants<br />
1990<br />
Change<br />
[%]<br />
Agglomeration<br />
2000<br />
Agglomeration<br />
1990<br />
Annecy France 52,100 51,143 1.9 156,727 142,252 10.2<br />
Chambéry France 57,592 55,603 3.6 131,547 119,208 10.4<br />
Grenoble France 156,203 153,973 1.4 394,787 384,086 2.8<br />
Bolzano/Bozen Italy 97,236 98,158 -0.9 139,152 133,744 4.0<br />
Trento Italy 110,142 101,545 8.5 136,591 123,750 10.4<br />
Klagenfurt Austria 91,723 89,415 2.6 117,003 111,949 4.5<br />
Innsbruck Austria 115,498 118,112 -2.2 171,554 170,020 0.9<br />
Salzburg (city) Austria 142,662 143,978 -0.9 211,229 199,317 6.0<br />
Villach Austria 57,829 54,640 5.8 78,544 74,034 6.1<br />
Maribor 1 Slovenia 114,436 132,860 -13.9 127,931 134,742 -5.1<br />
Kranj 1 Slovenia 52,689 52,043 1.2 78,834 76,251 3.4<br />
Luzern Switzerland 59,904 61,034 -1.9 176,821 166,436 6.2<br />
Kempten Germany 61,576 61,906 -0.5 93,583 83,411 12.2<br />
Rosenheim Germany 60,108 56,340 6.7 145,345 120,508 20.6<br />
Change<br />
[%]<br />
Tab. B1‐3: Overview of the growth of the Alpine metropolises (municipalities > 50,000 inhabitants) and their agglomerations in the Alpine Convention area.<br />
[Source: AT (Statistik Austria: Volkszählung 1991, 2001), DE (LfStaD: Bayerische Gemeinde- und Kreisstatistik Strukturdaten aus der Volkszählung 1987,<br />
Bevölkerungsstatistik 2000), IT (ISTAT: Censimento generale della popolazione 1991, 2001), SI (Statistical Office of the Republic of Slovenia: Population<br />
Census 1991, 2002), FR (INSEE: Recensement de la population 1990, 1999), MC (Gouvernement de Monaco: Recensement général de la population 2000<br />
(incl. data of 1990)), LI (AVW: Volkszählung 1990, 2000), CH (FSO: Volkszählung 1990, 2000).]<br />
1<br />
After achieving independence from the former Yugoslavia in 1991 a major reform of municipalities/municipality structure took place in Slovenia. For this reason the year 1996<br />
has been selected as the reference year for this study.<br />
Map B1‐2: Metropolises and their agglomerations in the Alpine arc.<br />
40
Chapter B – Driving Forces of Mobility and Transport<br />
B1.2 Population density and area of<br />
permanent settlement<br />
Population density<br />
Population density is a basic indicator in evaluating the human<br />
pressure on space and in distinguishing between rural<br />
and urban areas (OECD 1994). Using this indicator it is possible<br />
to depict processes of agglomeration and urbanisation.<br />
Throughout the whole Alpine Convention area the average<br />
density is 73 people per km 2 (see Tab. B1‐1). Compared<br />
to the national values (e.g. Germany: 231.1 Inh./km 2 , Italy:<br />
197.1 Inh./km 2 ; EUROSTAT 2004), the <strong>Alps</strong> are one of the<br />
less populated regions in Europe. In this analysis the Principality<br />
of Monaco was not considered as this city state<br />
has the highest population density worldwide, which is not<br />
representative of the situation in the <strong>Alps</strong>.<br />
Map B1‐3 shows the distribution of the population density in<br />
the Alpine Convention area which significantly reflects the<br />
topographical situation. Higher population densities occur<br />
along the Alpine fringe and the foothills of the <strong>Alps</strong>. Numerous<br />
small centres have developed there. Due to the favourable<br />
site conditions the settlement comes into conflict with<br />
agricultural land use.<br />
Many commuters, who work outside the Alpine arc at a nearby<br />
agglomeration centre, live in these bordering municipalities<br />
(Bätzing 1998) or in the broad and easily accessible<br />
Alpine valleys. In these valleys, municipalities with high<br />
population densities are found along the main Alpine ridge<br />
(valleys of Rhine, Etsch, Inn and Aosta). There is also a high<br />
population density in the nearer vicinity of the large centres<br />
of the Alpine arc.<br />
In contrast to the large intra-Alpine valleys the peripheral<br />
Alpine areas with poor accessibility are characterised by<br />
municipalities with low population density. These were found<br />
in areas close to the central mountain chain. This population<br />
pattern was observed in particular in the western parts of the<br />
<strong>Alps</strong>: Maritime <strong>Alps</strong>, Provencal <strong>Alps</strong>, Cottian <strong>Alps</strong>, Southern<br />
Dauphiné and Ticino <strong>Alps</strong>.<br />
As already mentioned, topography plays a key role in analysing<br />
the reasons for the observed population density pattern<br />
in mountainous regions. Many parts of the <strong>Alps</strong> must be<br />
considered as unsuitable for human settlements. In Austria,<br />
for example, only 40% of the cadastral area can be considered<br />
as an area of permanent settlement (BMVIT 2002). To<br />
give a more realistic and comparable picture of the population<br />
density, the area of permanent settlement, as the most<br />
appropriate indicator, should be taken into account. If the<br />
area of permanent settlement is the basis of the calculation,<br />
this results in higher values for the population density of the<br />
Alpine regions. Some valleys even reach values similar to<br />
those in densely populated urban centres.<br />
Population density..<br />
..is the average number of persons per unit of area for<br />
a certain territory. Normally it is specified as inhabitants<br />
per square kilometre. But the significance of the value<br />
is limited and may lead to false conclusions, particularly<br />
in mountain areas because normally this value does not<br />
take into account the geographical and ecological particularities<br />
(area for permanent settlements, glaciers, steep<br />
slopes, hazard zones etc.).<br />
Area of permanent settlement..<br />
..is the area which is inhabited or used continuously<br />
throughout the whole year (ASTAT 2004); in other words,<br />
where the majority of human activities is concentrated.<br />
This area includes intensively used agricultural areas,<br />
settlements and transport infrastructures, but does not<br />
include forests, pastures, bare rocks, wasteland and<br />
water surfaces.<br />
Due to the requirements of the respective spatial planning,<br />
the relevant administrative and political definition of<br />
the area of permanent settlements differs in the individual<br />
countries.<br />
differences between the two ways of calculating the population<br />
density are shown in Tab. B1‐4. Of particular interest<br />
in this respect are the figures from German and Swiss<br />
Alpine regions, because they were available for the entire<br />
Alpine Convention area. Considering the area of permanent<br />
settlement and not the whole area in Germany, the population<br />
density in the Alpine Convention area has almost doubled.<br />
In Switzerland the density value raised seven times, assuming<br />
the area of permanent settlement. In general the intra-<br />
Alpine regions, Tirol, Vorarlberg and the Autonomous Province<br />
of Bolzano/Bozen, experience a multiple increase when<br />
relating the population to the permanently settled area.<br />
Fig. B1‐1: Relative area distribution in the <strong>Alps</strong> at different altitudes<br />
(AMSL).<br />
A closer look at the distribution of Alpine area according to<br />
different altitude levels reveals the interdependency of population<br />
density and permanently settled area. Large areas of<br />
the <strong>Alps</strong> are located in altitudes where no permanent settlement<br />
is possible any more (Fig. B1‐1). The considerable<br />
41
Map B1‐3: Population density in Alpine municipalities (inhabitants per km²).
Chapter B – Driving Forces of Mobility and Transport<br />
Region Inhabitants (2005) Area [km 2 ]<br />
Population density<br />
[inhabitants/km²]<br />
Area of permanent<br />
settlement [km 2 ]<br />
Population density<br />
[inhabitants/km²]<br />
1 2 3 2/3 4 2/4<br />
Tirol 692,281 12,648 54.7 1,542 449.0<br />
Vorarlberg 363,237 2,601 139.7 621 583.0<br />
Salzburg* 524,400 7,154 73.3 1,540 340.5<br />
Styria* 1,183,303 16,392 72.2 4,948 239.1<br />
Germany – Area of the<br />
Alpine Convention<br />
1,473,881 11,072 133.1 5,650 260.9<br />
Autonomous Province<br />
of Bolzano/Bozen<br />
477,067 7,400 64.5 612 779.5<br />
Switzerland – Area of<br />
the Alpine Convention<br />
1,827,754 24,862 73.5 3,475 525.8<br />
Tab. B1‐4: Population density in some Alpine regions [Source: Salzburg (Amt der Salzburger Landesregierung 2004), Vorarlberg (BMVIT 2005), Styria (Amt<br />
der Steirischen Landesregierung 2001), Tirol (Amt der Tiroler Landesregierung 2004), Bolzano/Bozen (Autonome Provinz Bozen-Südtirol 2004), DE (LfStaD<br />
2004 ), CH (FSO 1985)].<br />
* belongs partially to the AC area.<br />
B1.3 Migration<br />
For about 30 years the whole Alpine region registered a positive<br />
migration balance (Bätzing 1996 and 2003, Birkenhauer<br />
2002). Since the 1980s the migration process has mainly<br />
been concentrated on the larger cities and their surroundings<br />
(Bähr 2004, Herfert 2001). This process concerns the<br />
cities within the Alpine arc as well as the large urban areas at<br />
the fringe of the <strong>Alps</strong> (Milano, München, Wien, Lyon) (Perlik<br />
1998, Perlik & Debarbieux 2001).<br />
As a consequence of the economic disparities between urban<br />
and rural areas and of the improved infrastructure services in<br />
the last decades, a rising internal migration within the <strong>Alps</strong>,<br />
comparable to non-mountainous regions, was recorded.<br />
Periurbanisation and the development of commuter cities are<br />
restricted to favourable locations situated close to rural or<br />
urban centres. Accordingly the striking shift between peripheral<br />
areas and dynamic, booming centres has led to structural<br />
challenges concerning demographic, social and economical<br />
development as well as the regional volume of traffic<br />
(Perlik & Debarbieux 2001, Birkenhauer 2002).<br />
Generally, the rural areas located close to the large cities<br />
at the Alpine fringe, especially in Switzerland and Bavaria<br />
at the northern border and all southern borders of the Alpine<br />
arc, have the highest positive migration balance. These<br />
locations are very attractive for working people (commuters).<br />
Moreover, these Alpine landscapes (Tirol, Oberbayern and<br />
surroundings of Alpine lakes) attract older people, who have<br />
chosen these locations for their retirement (StMWIVT 2004,<br />
INSEE 2001). In contrast to these attractive areas, certain<br />
peripheral Alpine regions close to the main Alpine chain with<br />
low population density and far from the large valleys suffer<br />
from population decrease (e.g. Italian <strong>Alps</strong>) (Varotto 2004).<br />
The development of migration in the 1990s shows a relatively<br />
heterogeneous structure (Map B1‐4). A more negative<br />
migration balance can be observed in the internal areas,<br />
while the areas near the borders have registered a positive<br />
migration rate.<br />
In the French <strong>Alps</strong> there were only small changes and in<br />
comparison with other Alpine regions the migration rates<br />
turned out to be stable, as municipalities have few inhabitants<br />
and therefore can show low absolute but high relative changes.<br />
While almost all municipalities in the German <strong>Alps</strong> show a<br />
high positive migration balance, many Austrian municipalities<br />
in most of the federal states suffer from population decrease.<br />
Following the significant restructuring of the local<br />
industries in Obersteiermark, the northern Alpine districts<br />
of Mürzzuschlag, Bruck an der Mur and Leoben were hit by<br />
a deep crisis (Regionalmanagement Obersteiermark Ost<br />
2000). The district of Leoben, for example, had to face a<br />
population decrease of 15% between 1981 and 2001. Only<br />
those municipalities situated close to the larger cities of Innsbruck,<br />
Klagenfurt, Salzburg and Wien were not affected by<br />
the population decrease.<br />
43
Map B1‐4: The migration balance in Alpine municipalities between 1990 and 1999.
Chapter B – Driving Forces of Mobility and Transport<br />
Main findings<br />
Status<br />
55.8% of the population is concentrated in small centres<br />
with 2,500 to 25,000 inhabitants. In 57.8% of the municipalities<br />
the population has increased between 1990 and<br />
2000.<br />
In the big urban centres the demographic development<br />
and periurbanisation are similar to those of the centres<br />
outside the Alpine arc.<br />
The population density calculated considering the permanent<br />
settlement areas can be compared to that of the<br />
metropolises located outside the Alpine arc.<br />
The migration balance is positive especially in the municipalities<br />
located at the northern German and Swiss border<br />
of the Alpine arc and in the southern border in the Adige<br />
Valley.<br />
Trends<br />
The Alpine arc is characterized by a dynamic but rather<br />
heterogeneous population growth.<br />
The population growth in the Alpine Convention area is<br />
clearly higher than the EU-15 average.<br />
Hot issues<br />
Demographic development is not equally distributed over<br />
the Alpine arc (contrary to objectives of the Alpine Convention)<br />
and the heterogeneous distribution of factors<br />
such as economic growth, public service availability or life<br />
style makes a further polarisation of this effect likely.<br />
Bibliography<br />
ARE – Bundesamt für Raumentwicklung (2003): Themenkreis A1:<br />
Entwicklung der Schweizer Städte und Agglomerationen –<br />
Monitoring urbaner Raum Schweiz. Bern.<br />
ASTAT – Istituto di Statistica della Provincia di Bolzano<br />
(2004): Territorio insediativo in provincia di Bolzano.<br />
Bähr, J. (2004): Bevölkerungsgeographie – Verteilung und<br />
Dynamik der Bevölkerung in globaler, nationaler und regionaler<br />
Sicht. Verlag Eugen Ulmer, Stuttgart.<br />
Bätzing, W. (1996): Der sozioökonomische Strukturwandel<br />
der Alpen im 20. Jahrhundert. In: HGG-Journal (Heidelberger<br />
Geographische Gesellschaft) 10/1996: 1–12.<br />
Bätzing, W. (1998): Zwischen Verstädterung und Entsiedlung.<br />
In: 1. Alpenreport: Daten – Fakten – Probleme – Lösungsansätze.<br />
<strong>Cipra</strong> International (ed.), Schaan: 94–101.<br />
Bätzing, W. (2003): Bevölkerungs- und Siedlungsentwicklung<br />
im Alpenraum zwischen 1870 und 2000. In: Akademie für<br />
Raumforschung und Landesplanung (ed.): Raumordnung im<br />
Alpenraum – Tagung der LAG Bayern zum Jahr der Berge.<br />
ARL-Arbeitsmaterial Nr. 294, Hannover: 1- 15.<br />
Birkenhauer, J. (2002): Alpen 2002 – Eine Bestandsaufnahme.<br />
In: Geographische Rundschau 54, Heft 5: 51-55.<br />
BMU – Bundesministerium für Umwelt, Naturschutz und Reaktorsicherheit<br />
(2004): La Convenzione delle Alpi si concreta.<br />
Obiettivi e attuazione. Ständiges Sekretariat der Alpenkonvention,<br />
Innsbruck.<br />
BMVIT – Bundesministerium für Verkehr, Innovation und Technologie<br />
(2002): Verkehr in Zahlen – Österreich. Wien.<br />
EUROSTAT (2004): Table on Population Density.<br />
h t t p : / / e p p . e u r o s t a t . e c . e u r o p a . e u / p o r t a l / p a g e ? _<br />
pageid=1996,45323734&_dad=portal&_schema=PORT<br />
AL&screen=welcomeref&open=/C/C1/C11&language=en<br />
&product=Yearlies_new_population&root=Yearlies_new_<br />
population&scrollto=0<br />
Favry, E., Arlot, M.-P., Atmanagara, J., Castiglioni, B., Cernic-Mali,<br />
B., Egli, H.-R., Golobic, M., Massarutto, A., Pfefferkorn,<br />
W. & T. Probst (2004): Regalp – Projektbeschreibung,<br />
Hauptergebnisse und Schlussfolgerungen.<br />
Herfert, G. (2001): Stadt-Umland-Wanderungen nach 1990.<br />
In: Nationalatlas Deutschland. Band 4: Bevölkerung, Institut<br />
für Länderkunde, Leipzig.<br />
Hornung, D., Röthlisberger, T. (2005): Die Bergregionen in<br />
der Schweiz. Bundesamt für Statistik (ed.), Neuchâtel.<br />
INSEE – Institut National de la Statistique (2001): Les<br />
migrations en France entre 1990 et 1999. INSEE Premiere<br />
N° 758.<br />
OECD (1994): Creating Rural Indicators for Shaping Territorial<br />
Policy, Paris.<br />
Perlik, M. (1998): Städte und Agglomerationen im Alpenraum.<br />
In: Praxis Geographie 28/1998, 2: 26–29.<br />
Perlik, M. (1999): Processus de périurbanisation dans les<br />
villes des Alpes. In: Revue de Géographie Alpine, 1: 144-151.<br />
Perlik, M., Debarbieux, B. (2001): Die Städte der Alpen<br />
zwischen Metropolisation und Identität. In: 2. Alpenreport,<br />
CIPRA (ed.), Schaan: 86-95.<br />
Pfefferkorn, W., Egli, H.-R., Massarutto, A. (2005): Regional<br />
Development and Cultural Landscape Change in the<br />
<strong>Alps</strong> – The Challange of Polarisation. Geographica Bernensia.<br />
G74 Bern.<br />
Regionalmanagement Obersteiermark Ost (2000): Regionaler<br />
Bechäftigungspakt Obersteiermark Ost – Grundkonzeption.<br />
Bruck an der Mur.<br />
Ruffini, F. V., Streifeneder, T., Eiselt, B. (2004): Definition<br />
des Perimeters der Alpenkonvention. Teilprodukt zum Forschungsvorhaben<br />
203 13 225. Umweltbundesamtes (ed.),<br />
Berlin.<br />
StMWIVT – Bayerisches Staatsministerium für Wirtschaft,<br />
Infrastruktur, Verkehr und Technologie (ed.) (2004):<br />
15. Raumordnungsbericht. München.<br />
Swiss Federal Statistical Office (2004): Communiqué de<br />
Presse n. 0350-0410-00. Neuchatel, 26th October, 2004.<br />
Torricelli, G. P. (1996): Reti di trasporto e reti di città – il caso<br />
dell´Arco Alpino. In: G. dematteis, E. Dansero (eds.): Regioni<br />
e reti nello spazio unificato europeo. Memorie geografiche<br />
delle Rivista Geografica Italiana 1996, No. 2: 275–294.<br />
Varotto, M. (2004): Montagna senza abitanti, abitanti senza<br />
montagna: le recenti tendenze demografiche e insediative<br />
nell´Arco Alpino italiano (1991-2000). In: E. C. Angelini, S.<br />
Giulietti, F. V. Ruffini (eds.): Il privilegio delle Alpi: moltitudine<br />
di popoli, culture e paesaggi, Accademia Europea Bolzano/<br />
Bozen: 17–33.<br />
45
Report on the State of the <strong>Alps</strong><br />
B2<br />
The Alpine and European<br />
Economy<br />
Transport and economic development are closely related in<br />
our modern and globalised world. The transport of people,<br />
goods, services and information in itself are some of the driving<br />
forces of globalisation. While accessibility contributes to<br />
economic development, economic aspects like economic<br />
growth, internal European market, consumer attitudes, comparative<br />
cost advantages, division of labour, sector structure<br />
in as well as outside the <strong>Alps</strong> also have a remarkable influence<br />
on the quantity and quality of traffic.<br />
The direct economic advantages of a region based on transport<br />
are easy to define. There are direct economic effects<br />
where goods are being loaded and unloaded, sold or bought<br />
and where people get the opportunity to spend their money<br />
(Knoflacher 1998). Several Alpine regions, particularly those<br />
located along the most important passes and traffic-junctions,<br />
have profited from this strategic advantage. Thus they<br />
registered a significant economic upturn. As time becomes<br />
a minimum factor, passengers and the transport velocity are<br />
rising, while often traditional economic benefits for regions<br />
along transit corridors are diminishing. Consequently those<br />
transit regions which are situated along the international and<br />
national road networks can suffer from a rising traffic volume.<br />
B2.1 Accessibility and economic<br />
development: a complex<br />
relationship<br />
Rising traffic volume is not only the result of the development<br />
of enterprises and labour markets. The prosperity<br />
and welfare development of a region and of society as a<br />
whole also contribute to increasing traffic loads in the <strong>Alps</strong><br />
(ASTRA 2004).<br />
The transport system is able to directly affect the accessibility<br />
of a location and the spatial structure meaningfully. It influences<br />
the progressive separation of working and living environments<br />
as well as the site-selection of certain services.<br />
Furthermore, the access to mobility gives individuals the<br />
opportunity to fulfil their needs concerning shopping, working,<br />
lifestyle, leisure or entrepreneurial behaviour (distribution,<br />
production, storage).<br />
In the framework of the European research project REGALP<br />
(5 th EU Framework Research Program), the accessibility of<br />
NUTS-3 regions was analysed (cp. Fig. B2-1). This analysis<br />
is based on the accessibility of inhabitants as an indicator<br />
of different action opportunities or socioeconomic potential.<br />
The calculations were carried out considering the number of<br />
people who are accessible within the defined time-frame of<br />
one hour. The one-hour time limit is typical for daily commuting<br />
and shopping traffic. The one-hour-accessibility is thus<br />
Fig. B2-1: The number of inhabitants accessible within the time-frame of one hour in the <strong>Alps</strong> (Favry & Pfefferkorn 2005).<br />
46
Chapter B – Driving Forces of Mobility and Transport<br />
calculated from the town which is the central node of a certain<br />
administration unit (NUTS-3) by considering all other<br />
central nodes that can be reached within one hour (Favry &<br />
Pfefferkorn 2005).<br />
As expected the results confirm that the one-hour-accessibility<br />
is generally higher in Alpine border regions than in<br />
the inner areas of the <strong>Alps</strong>. In the eastern part of the <strong>Alps</strong>,<br />
accessibility is lower and much more homogenous than in<br />
the western part. The regions with the highest accessibility<br />
are in the southern Italian <strong>Alps</strong>, between Torino and Verona<br />
(Favry & Pfefferkorn 2005).<br />
Without doubt, accessibility is an important location factor for<br />
achieving a dynamic economic development (ESPON 2006).<br />
It is a key indicator for the relationship between transport<br />
system, mobility and spatial structure. The spatial structure<br />
determines the distribution of activities in a specific area.<br />
Locations with a high accessibility are more attractive for<br />
economic investments (Ackermann et al. 2006). Regions<br />
located close to the main traffic axes make it easier for<br />
commuter traffic and short journeys. Because of their good<br />
accessibility it is obvious that these locations receive more<br />
economic investments than peripheral regions, which are<br />
not connected with a national or international transport net<br />
(Dieters et al. 2001).<br />
Also for the Alpine arc, direct correlations between the<br />
regional level of accessibility and selected economic indicators<br />
have been observed (Pfefferkorn et al. 2005). Two main<br />
results were derivable from these correlations (see chap. B1):<br />
• Mainly those areas with a reduced accessibility tend to<br />
be structurally weak regions. Consequently they are less<br />
competitive and are thus in danger of facing economic<br />
degradation and depopulation.<br />
• In contrast, those areas with excellent accessibility –<br />
usually located along a national road network in longitudinal<br />
or transversal extended valleys – are places which<br />
feature a stable demographic development and economic<br />
growth. Additionally their bordering regions are<br />
predestined to attain prosperity, too.<br />
<strong>How</strong>ever, good accessibility through the connection to the<br />
national traffic network alone does not guarantee economic<br />
success in a mountainous region (Favry et al. 2004). An<br />
improvement of the traffic network between weak regions<br />
and centres is thus not sufficient to mobilise the potential of<br />
structurally weak regions. In fact, in some cases an improved<br />
accessibility between prospering and weak areas may even<br />
lead to spatial polarisation and strong dependencies between<br />
centres and peripheries. Thus new infrastructures can<br />
give rise to new disparities among the regions and increase<br />
energy consumption. Furthermore remoteness can even become<br />
a success factor: tourist resorts profit from the reduced<br />
traffic-related noise and pollution.<br />
B2.2 The economic progress in the<br />
Alpine arc<br />
The Alpine arc is intensively integrated in the development<br />
and policies of the European Union. Its regions benefit from<br />
this in various ways. Currently the European development is<br />
characterised by an increasing functional and spatial division<br />
of labour. This facilitates higher productivity, efficient production<br />
and the necessity to access new markets. Consequently<br />
an increase of mobility is also taking place (Perlik 2005).<br />
Increasing mobility is certainly one of the main reasons<br />
for the increased prosperity and for the social and cultural<br />
changes in Europe and in the <strong>Alps</strong>. Therefore a further<br />
increase of traffic will be expected, which will not only affect<br />
freight traffic (Prognos 2002, ARE 2004 and 2006).<br />
Recent historic development<br />
The industrial development of the Alpine arc was initiated<br />
rather late in comparison with other parts of Europe. Until<br />
the end of the 1970s, industrial production was the dominant<br />
sector in the <strong>Alps</strong>, with the highest share of employees.<br />
All urban and semi-urban areas experienced a high demographic<br />
and economic dynamic (Birkenhauer 2002). It was in<br />
the early 1980s all industrial regions were confronted with an<br />
economic crisis (Bätzing 2005).<br />
In the course of globalisation, the industrial sector slightly<br />
lost its relevance for the Alpine economy. The share of employed<br />
people in the industrial sector is decreasing while in<br />
the service sector it has been rising since the 1980s. <strong>How</strong>ever,<br />
industrial production is still important in the <strong>Alps</strong>. In the<br />
early 2000s it accounted for about 36% of the working places<br />
(Perlik & Debarbieux 2001) with some regional variations,<br />
e.g. in the Autonomous Province of Bolzano, Tirol and in<br />
the Swiss Canton of Fribourg the employed in the industrial<br />
sector amounted to 26% (Office de Statistique 2004) while it<br />
accounted for 29% in Trentino (ASTAT 2005).<br />
Considering the amount of GDP generated, some of the<br />
main drivers of economic growth (BAK 2005) are:<br />
• the urban sector, which consists of services that fulfil<br />
everyday requirements such as commerce, hotels and<br />
restaurants, real estate, transport, financial services,<br />
etc. It generates the biggest part of the GDP in all Alpine<br />
regions and it is of minor importance only in the region of<br />
Bern, in Nordwestschweiz and in Ostschweiz,<br />
• the political sector, which covers basically public administration,<br />
health care and education. It is very important<br />
in all Alpine Space regions, especially in the Bern area<br />
and in the French regions,<br />
• the ‘new’ economy sector, based on IT and telecommunications.<br />
It is rather marginal in the Alpine Space<br />
regions and concentrated in a few specialised regions<br />
such as Oberbayern, Rhône-Alpes and Provence-Alpes-<br />
Côte d´Azur,<br />
• the high value added ‘old’ economy sector that includes<br />
the chemical-pharmaceutical industry, the automotive<br />
industry, medical engineering and the production of pre-<br />
47
Report on the State of the <strong>Alps</strong><br />
cision instruments, is developed above all in Nordwestschweiz<br />
while it is shrinking in the Italian Alpine regions,<br />
and<br />
• the traditional economic sector, composed of food, textiles,<br />
refined petroleum products, metal products and<br />
construction, shows negative growth rates in many<br />
regions, except Slovenia.<br />
A traditionally strong sector is the dairy industry (see subchap.<br />
B 2.6). Within the service sector, tourism plays a key<br />
role. Bätzing (2000) proved that the intensity of tourism is<br />
not distributed equally in the <strong>Alps</strong>. On an Alpine-wide scale,<br />
larger tourist areas are concentrated especially in the central<br />
part of the <strong>Alps</strong> (e.g. Province of Bolzano/Bozen, Salzburg,<br />
Tirol, Vorarlberg and Bayern). In many other Alpine regions,<br />
tourism is just appearing at selected locations (see chap. B4).<br />
Table B2-1 shows the employees per sector within the NUTS-3<br />
(aggregated on NUTS-2 level) units which are part of the<br />
Alpine Convention area. In many parts of the <strong>Alps</strong>, the<br />
share of employees in the primary sector is higher than the<br />
national average. The Austrian regions in particular are<br />
strongly characterised by agriculture. In some Alpine regions<br />
the industrial sector still plays a relevant role. Industry is comparatively<br />
more important in the Italian regions of Lombardia<br />
and Veneto as well as in the Austrian regions of Vorarlberg<br />
and Oberösterreich.<br />
Service sector<br />
Generally the service sector is the dominating one (non-market<br />
and market services). Its importance, however, varies<br />
from one region to another. While 80% of the active population<br />
in the French region of Provence-Alpes-Côte d’Azur and<br />
76% in the Italian region of Liguria are employed in services,<br />
almost half of the active population in the Austrian regions of<br />
Oberösterreich and Burgenland and in the Italian regions of<br />
Veneto and Lombardia work in this sector.<br />
Transport sector<br />
Considering the number of employees, the transport sector<br />
is another important branch in the <strong>Alps</strong>. Fig. B2-2 points out<br />
the employees in the transport sector in relation to all employees.<br />
The highest percentages were recorded along the<br />
European North-South axis in Tirol, Salzburg and Verona.<br />
This also applies to the western Alpine provinces of Torino,<br />
Aosta, Verbania-Cusio-Ossola.<br />
Nowadays there are several modern poly-structured economic<br />
centres in which about 70% of the Alpine population<br />
are concentrated. The symbiosis of tourism, electric power<br />
generation, traffic, industry and agriculture is the basis of<br />
sound economic development. These regions, like Alto<br />
Adige/Südtirol, benefit from their diversified economic structure<br />
and thus they are able to attain high regional GDPs (see<br />
Map B2-1) (Birkenhauer 2002).<br />
<br />
It means that only NUTS-3 units that are at least partly included in the Alpine Convention<br />
perimeter have been aggregated. For instance, as for the NUTS-2 region<br />
Lombardia, only its NUTS-3 provinces of Bergamo, Brescia, Como, Lecco, Sondrio<br />
and Varese were included in the computation, while Milano, Pavia, Lodi, Mantova<br />
and Cremona were excluded because they are located entirely outside the Alpine<br />
Convention area.<br />
Area (NUTS-2 unit) Agriculture Industry<br />
Market and<br />
non-market*<br />
services<br />
Austria 5.5 27.5 66.9<br />
Burgenland 25.0 21.6 53.4<br />
Steiermark 20.0 24.2 55.7<br />
Oberösterreich 16.8 35.7 47.5<br />
Niederösterreich 14.1 24.6 61.3<br />
Kärnten 14.0 19.8 66.2<br />
Tirol 13.3 22.4 64.2<br />
Salzburg 11.0 20.9 68.1<br />
Vorarlberg 6.6 30.9 62.5<br />
France 3.8 24.3 71.9<br />
Provence-Alpes-Côte<br />
d‘Azur<br />
3.3 16.6 80.1<br />
Rhône-Alpes 2.6 27.7 69.8<br />
Germany 2.4 29.8 67.8<br />
Schwaben 4.4 30.5 65.1<br />
Oberbayern 4.4 28.3 67.3<br />
Italy 4.2 30.8 65.0<br />
Provincia Autonoma di<br />
Bolzano/Bozen<br />
Provincia Autonoma di<br />
Trento<br />
8.2 25.1 74.8<br />
6.4 28.4 65.2<br />
Liguria 6.3 17.9 75.8<br />
Valle d‘Aosta 5.1 23.8 71.1<br />
Friuli Venezia Giulia 3.9 33.4 62.7<br />
Veneto 3.9 43.3 52.8<br />
Piemonte 3.0 33.8 63.2<br />
Lombardia 1.6 44.1 54.3<br />
Slovenia 9.1 37.1 53.9<br />
Slovenian AC area 9.5 35.6 54.9<br />
Switzerland 4.0 23.0 73.0<br />
Tab. B2-1: Share of employed persons aged 15 and over by economic<br />
activity 2005: comparison between national values and the respective<br />
aggregations at NUTS-2 level of NUTS-3 units partly included in the Alpine<br />
Convention area (EUROSTAT 2006).<br />
* Market services: wholesale and retail trade, repair of motor vehicles, motorcycles<br />
and personal and household goods; hotels and restaurants; transport, storage and<br />
communication, financial intermediation; real estate, renting and business activities;<br />
Non-market services: public administration and defence, compulsory social security;<br />
education; health and social work; other community, social and personal service<br />
activities; private households with employed persons; extra-territorial organisations<br />
and bodies.<br />
Two thirds of the goods that are transported on the roads of<br />
the Alpine arc are not bulk products but products with a high<br />
added value such as manufactured and half-manufactured<br />
goods, chemical products (mainly pharmaceuticals) and<br />
food (Ickert 2006). This high added value makes transport<br />
time expensive (the longer goods are in transit, the more<br />
revenue is lost due to foregone interest) and a crucial factor<br />
that has to be minimised. Therefore it is not surprising that<br />
in many Alpine regions production is mainly concentrated in<br />
the large and easily accessible centres or valleys, which are<br />
mostly located at the fringes of the <strong>Alps</strong>. Only individual industrial<br />
plants are situated in remote locations (Pfefferkorn<br />
48
Chapter B – Driving Forces of Mobility and Transport<br />
et al. 2005). Areas with better access to locations of source<br />
materials and markets are generally more productive, more<br />
competitive and more successful than remote areas.<br />
Agricultural sector<br />
The analysis shows that for several reasons (e.g. economic<br />
factors, cultural and social importance, conservation of the<br />
landscape) the agricultural sector is still important (see subchap.<br />
B.2.6). <strong>How</strong>ever, also in mountain areas more and<br />
more people work in non-primary sectors (Buchli & Kopainsky<br />
2005). Furthermore, the Alpine arc shows a trend towards<br />
higher rates of employment in the tertiary sector. This<br />
development, which is comparable with the trend in the rest<br />
of Europe, inevitable influences the quality and the quantity<br />
of traffic.<br />
With increasing values and decreasing weight of transported<br />
goods, the quality of traffic in terms of reliability and flexibility<br />
becomes more important than the costs. Furthermore in<br />
certain cases telecommunications replace transport thus can<br />
help to limit transport volume. On the other side they can also<br />
be the source of new traffic.<br />
Also, “soft” factors (e.g. quality of life, leisure, culture and<br />
environment, services) tend to become more important than<br />
the traditional “hard” factors (payment, infrastructures) when<br />
considering the site conditions for setting up new enterprises<br />
with a high-quality labour force.<br />
B2.3 Disparities in economic<br />
development<br />
Economic performance is normally measured by Gross<br />
Domestic Product (GDP, see box) . As with many other<br />
national-economic indicators, this aggregated value is<br />
restricted to a given administrative unit. In this analysis<br />
the considered GDP data was only available for the entire<br />
NUTS-3 regions (provinces). It has to be kept in mind that<br />
for some regions these data only partly reflect the situation<br />
within the Alpine Convention area. Hence it was not possible<br />
to restrict the analysis just to the Alpine Convention area. In<br />
fact, the economic disparities limited to the Alpine arc could<br />
not be detected as the economically vital areas are bordering<br />
the perimeter of the Alpine Convention and are part of the<br />
Alpine NUTS-3 level (e.g. cities of Torino, Verona, Bergamo,<br />
Brescia).<br />
<strong>How</strong>ever, the distribution of the per-capita GDP in the Alpine<br />
arc on NUTS-3 level (Map B2-1) depicts significant disparities<br />
between the central parts and the eastern and western<br />
foothills of the Alpine arc and also within the same country.<br />
Interestingly, the southern foothills in Italy are generally<br />
characterised by a quite high per-capita GDP. Considering<br />
the aforementioned, these NUTS-3 regions that only partly<br />
cover the perimeter of the Alpine Convention territory attain<br />
one of the highest values (Tab. B2-2). A similar phenomenon<br />
<br />
For Switzerland the GDP is not available at cantonal level. Therefore national income<br />
has been used as proxy of GDP.<br />
Fig. B2-2: The relation of employees in the transport sector to all employees (Source: Wirtschaftsforschungsinstitut Bolzano 2004).<br />
49
Report on the State of the <strong>Alps</strong><br />
can be observed at the northern Alpine fringes (Germany,<br />
Switzerland). The respective regions of Oberbayern and the<br />
cantons of Glarus, Nidwalden as well as Salzburg and Liechtenstein<br />
are attaining minimum average per-capita GDPs<br />
above 30,000 EUR.<br />
Besides the absolute values, Tab. B2-2 also highlights those<br />
regions with the highest per-capita GDP in the Alpine arc.<br />
With a per-capita GDP of over 80,000 EUR, Liechtenstein<br />
represents one of the richest regions worldwide. The Nuts-3<br />
regions Kempten, Rosenheim (both Germany), Glarus, Nidwalden,<br />
Waadt (all Switzerland) and Salzburg (Austria), are<br />
attaining higher GDPs than the national averages. As Map<br />
B2-1 and Fig. B2-3 shows, there are also significant disparities<br />
in the per-capita GDP within the same country: the percapita<br />
GDP of the Autonomous Province of Bolzano-Bozen <br />
(34,395 EUR) is significantly higher than that of Verbano-<br />
Cusio-Ossola (22,000 EUR). The same phenomena can be<br />
observed in the case of Salzburg and surroundings (33,972<br />
EUR) in comparison with the per-capita GDP of Südburgenland<br />
(16,271 EUR) and the one of Kempten (38,580 EUR)<br />
in comparison with the one of Oberallgäu (20,854 EUR).<br />
Despite the wide disparities between and within the regions<br />
of the Alpine countries, the average per-capita GDP of the<br />
Alpine Convention is slightly higher than the European average.<br />
<strong>How</strong>ever, the national average per-capita GDP is higher<br />
in every (except Italy and Slovenia) than the average percapita<br />
GDP country of the Alpine region.<br />
Gross Domestic Product (GDP) and per-capita GDP<br />
The GDP is equivalent to the market value of all final<br />
products and services (without double counting products<br />
used in other outputs) produced within a certain country<br />
or region over a specific time period, usually one year. It<br />
is a very important indicator measuring economic performance.<br />
Within the EU’s Lisbon Growth and Jobs Strategy<br />
this indicator plays a key role. This is also the case when<br />
evaluating the effective economic convergence within<br />
Europe’s Member States in the context of a policy<br />
with the objective of balancing economic differences<br />
(EUROSTAT 2006b).<br />
Per-capita GDP is calculated by dividing GDP for a given<br />
year by the total registered population in that year. It is a<br />
proxy for the prosperity of the resident population.<br />
<br />
A recently published news release of Eurostat (2006) places the Autonomous Province<br />
of Bolzano/Bozen in the 8 th position in the European ranking of the NUTS-2<br />
regions with the highest per-capita income.<br />
Map B2-1: Gross domestic product (GDP) per capita in the Alpine Convention area (on NUTS-3 level).<br />
50
Chapter B – Driving Forces of Mobility and Transport<br />
Fig. B2-3: Per capita Gross Domestic Product (GDP) of selected regions in the Alpine Convention area (Source: See Map B2 -1; Liechtenstein was not<br />
included in the graph as with its per-capita GDP of 83,610 EUR it constitutes an outlier).<br />
NUTS-3<br />
Share of region<br />
within<br />
AC area (%)<br />
GDP for the whole<br />
NUTS-3 level area<br />
(Mio EUR)<br />
NUTS-3<br />
Share of region<br />
within<br />
AC area (%)<br />
GDP/capita for<br />
the whole NUTS-3<br />
level area (EUR)<br />
Torino (IT) 61 59,811 Liechtenstein 100 83,610<br />
Brescia (IT) 59 31,474 Glarus (CH) 100 43,556<br />
Bern (CH) 53 27,957 Nidwalden (CH) 100 41,941<br />
Isère (FR) 67 27,812<br />
Kempten (Allgäu), Kreisfreie<br />
Stadt (DE)<br />
100 38,580<br />
Alpes-Maritimes (FR) 90 26,859<br />
Rosenheim, Kreisfreie Stadt<br />
(DE)<br />
100 35,533<br />
Bergamo (IT) 70 26,380 Waadt (CH) 22 34,762<br />
Waadt (CH) 22 22,543 Salzburg und Umgebung (AT) 78 33,798<br />
Verona (IT) 29 22,202 Graz (AT) 57 33,085<br />
Vicenza (IT) 54 21,895 Schwyz (CH) 100 31,622<br />
Varese (IT) 38 21,097 Wiener Umland/Südteil (AT) 28 31,475<br />
Tab. B2-2: The ten regions with the highest Gross Domestic Product (GDP) in the Alpine Convention area. [Source: France (Eurostat, 2000); Liechtenstein<br />
(Landesverwaltung Liechtenstein 2001, http://www.llv.li/pdf-llv-avw-statistik-fliz-07-2005-national_economy); Slovenia (Eurostat, 2002);<br />
Austria (Eurostat, 2003); Germany (Eurostat, 2003); Italy (Eurostat, 2003); Switzerland (BFS, Volkswirtschaftliche Gesamtrechnung und die Volkswirtschaft,<br />
2003), Monaco (Central Intelligence Agency, 2006, https://www.cia.gov/cia/publications/factbook/index.html). For Switzerland national income has been<br />
used as proxy of GDP.]<br />
51
Report on the State of the <strong>Alps</strong><br />
NUTS-3<br />
Share of region<br />
within<br />
AC area (%)<br />
GDP for the whole<br />
NUTS-3 area<br />
(Mio EUR)<br />
NUTS-3<br />
Share of region<br />
within<br />
AC area (%)<br />
GDP/<br />
capita for the whole<br />
NUTS-3 area (EUR)<br />
Appenzell I.Rh. (CH) 100 423.9 Notranjsko-kraska (SI) 10 9,515<br />
Lungau (AT) 100 452.3 Koroska (SI) 100 9,708<br />
Notranjsko-kraska (SI) 10 483.9 Podravska (SI) 26 10,366<br />
Mittelburgenland (AT) 23 702.4 Gorenjska (SI) 88 10,826<br />
Koroska (SI) 100 717.4 Savinjska (SI) 30 11,072<br />
Obwalden (CH) 100 790.3 Goriska (SI) 89 11,870<br />
Außerfern (AT) 100 920.2 Südburgenland (AT) 14 16,150<br />
Osttirol (AT) 100 978.0 Oststeiermark (AT) 41 17,809<br />
Uri (CH) 100 1,073.3 Osrednjeslovenska (SI) 17 17,928<br />
Kaufbeuren, Kreisfreie<br />
Stadt (DE)<br />
100 1,194.4 Mittelburgenland 23 18,049<br />
Tab. B2-3: The ten regions with the lowest Gross Domestic Product (GDP) in the Alpine Convention area. [Source: France (Eurostat 2000); Liechtenstein<br />
(Landesverwaltung Liechtenstein 2001, http://www.llv.li/pdf-llv-avw-statistik-fliz-07-2005-national_economy); Slovenia (Eurostat 2002); Austria (Eurostat<br />
2003); Germany (Eurostat 2003); Italy (Eurostat 2003); Switzerland (Swiss Federal Statistical Office 2003), Monaco (Central Intelligence Agency 2006,<br />
https://www.cia.gov/cia/publications/factbook/index.html). For Switzerland national income has been used as proxy of GDP.]<br />
Tab. B2-3 lists those regions with relatively low GDPs and<br />
per-capita GDPs on NUTS-3 level (e.g. in Slovenia). The<br />
lowest Alpine-wide GDP is marked by the sparsely populated<br />
cantons of Appenzell/CH. Lungau, another sparsely populated<br />
Austrian region, is next. Seven of the ten regions of<br />
the Alpine arc with the lowest per-capita GDP are located in<br />
Slovenia.<br />
The average annual growth rate of the real GDP within the<br />
total Alpine area attained an increase of 1.5% during 1990<br />
and 2003 (BAK 2005). This economic growth is not equally<br />
distributed among the regions of the Alpine arc (Fig. B2-4). It<br />
has been particularly strong in Austria, while the Swiss cantons<br />
have been affected by the generally low national growth<br />
rate of Switzerland. The Alpine regions of Slovenia always<br />
achieved average growth rates, even if the reference period<br />
was extended. Slovenia’s annual growth rate, however, has<br />
always ranked among Europe’s leading regions since 1996<br />
(BAK 2005) and will make up for what it lags behind the EU<br />
average economic condition in due time.<br />
The detected economic trend was also reflected significantly<br />
in the labour market. The analysis proved the expected relationship<br />
between economically weak regions with a low GDP<br />
and regions facing high unemployment. The distribution of<br />
the unemployment rates confirms a concentration of economic<br />
welfare close to the well-developed and easily accessible<br />
intra-Alpine areas.<br />
A clear demarcation between the Alpine fringe and the Alpine<br />
centres is observable (Map B2-2): the regions with the highest<br />
unemployment rates are situated on the peripheral western<br />
and eastern fringes of the <strong>Alps</strong>, while those with moderate<br />
rates are located in the central parts of the <strong>Alps</strong>.<br />
Recent developments show that Alpine cities maintain close<br />
economic interrelationships with adjacent perialpine metropolises<br />
(e.g. München, Milano, Torino) (Perlik & Debarbieux<br />
2001; BFS 1997). In this context the aspect of “commuters”<br />
becomes relevant. Particularly, the regions along Italy’s<br />
Alpine foothills such as Verona, Bergamo, Brescia, Torino,<br />
and Udine as well as the areas close to Wien, Graz, Linz,<br />
Bern, Maribor, Ljubljana, and München are facing this<br />
changed demand (Perlik & Debarbieux 2001). The dynamic<br />
development outside the Alpine fringe (where cities become<br />
increasingly important for labour and commercial opportunities)<br />
accentuates the gap with the peripheral regions within<br />
the alpine fringe, where conditions for economic development<br />
are less favourable.<br />
The unemployment rate in the Alpine arc amounted to<br />
almost 6% in 2003 (BAK 2005) and is lower than the average<br />
value of the EU-15 which amounted to 8% in the same<br />
year (EUROSTAT 2004). It varies regional between 14.2%<br />
in Podravska/Slovenia and 1.2% in the Swiss Canton of Uri.<br />
13 NUTS-3 regions out of 99 are attaining an unemployment<br />
rate below the 3% threshold. Besides eight Swiss cantons<br />
and Liechtenstein also four Italian provinces (Cuneo, Bolzano,<br />
Lecco, Belluno) are below that threshold.<br />
52
Chapter B – Driving Forces of Mobility and Transport<br />
Austrian region<br />
French region<br />
German region<br />
Italian region<br />
Slovene region<br />
Swiss region<br />
Fig. B2-4: Growth of real GDP in the regions of the Alpine arc (Source: BAK 2005). 1990-2003, annual average growth rate based on EUR 1995 prices<br />
and 1997 Purchasing Power Parity.<br />
Map B2-2: Unemployment rate in the Alpine Convention area in 2004/2005 (on NUTS-3 level)*.<br />
* The relatively high rate of unemployment of Austrian Tirol is probably due to seasonal variations caused by tourism and the reason is probably the same for the Berchtesgaden<br />
area. The Rosenheim area has one of the highest unemployment rates in Oberbayern.<br />
53
Report on the State of the <strong>Alps</strong><br />
B2.4 The situation of agriculture<br />
Role of accessibility for agriculture<br />
A good transport network for goods as well as easy accessibility<br />
to wholesale and processing enterprises is elemental<br />
for agriculture to function. The need to supply markets with<br />
fresh products as well as the broad range of production factors<br />
(e.g. machines, fertilisers etc.) necessary in modern agriculture<br />
makes this obvious. Although products from Alpine<br />
agriculture can hardly compete with those of the lowlands<br />
in terms of quantity, improvements in transport can help to<br />
reduce the gap, making the former cheaper and thus more<br />
competitive.<br />
Another important aspect concerns the relationship between<br />
accessibility and the time-management of farms. Even if<br />
several studies of the <strong>Alps</strong> show that there is no general<br />
relationship between accessibility, agricultural intensity (e.g.<br />
livestock density) and type of operation (regular or sideline<br />
basis), other experts are convinced that there is a concentration<br />
of part-time farming in regions where there is good<br />
access to the local road network as they have better access<br />
to non-agricultural employment opportunities (UBA 2005).<br />
This may contribute to sustaining agricultural activity. Without<br />
doubt a good accessibility leads to operational advantages.<br />
<strong>How</strong>ever, the development of agricultural structures<br />
is driven by a complex system of different regional economic<br />
conditions (Schweizer Berghilfe 2000).<br />
Structural changes in agriculture<br />
Due to the high share of land under agricultural and forest<br />
use and their multifunctional services (e.g. preservation of<br />
the cultural landscape) within the Alpine bow, the primary<br />
sector is of particular importance. <strong>How</strong>ever, the structure<br />
of agriculture has largely changed in the Alpine Convention<br />
area over the last decades. Larger structural changes have<br />
seen an increasing number of farms throughout the Alpine<br />
area, with part-time farming and an increasing farm size<br />
(EURAC 2006).<br />
These changes, however, are in line with the developments<br />
outside the <strong>Alps</strong>: because of the income gap between farming<br />
and non-farming activities, more and more farms are<br />
being reorganised to become farms with part-time farming.<br />
In general, only very large farms are still managed full-time.<br />
The reasons for this development are various and depend<br />
on local, regional, national and international economic and<br />
policy processes (Krausmann et al. 2003; Mann 2003; Weiss<br />
2006).<br />
The change in farms between 1990 and 2000 (see Map B2-3)<br />
shows regions with a relatively stable or moderate agricultural<br />
change such as Alto Adige/Südtirol, Central Switzerland<br />
and the German <strong>Alps</strong>, which stand out distinctly from<br />
the regions with a strong decrease in agriculture of more<br />
than 40%, particularly in the Italian <strong>Alps</strong> (Eurac 2006). In<br />
most cases this is due to the lack of possible successors and<br />
heirs who left to look for alternative employment opportuni-<br />
Map B2-3: Relative change in the number of farms in Alpine Convention area between 1990 and 2000 (on NUTS-3 level).<br />
54
Chapter B – Driving Forces of Mobility and Transport<br />
ties in other sectors (Baur 2000; Buchli et al. 2002; Schmitt<br />
& Burose 1995). Land use changed with a clear tendency<br />
towards intensification in favourable areas and extensification<br />
or even abandonment in disadvantaged areas (Tappeiner<br />
et al. 2003; Taillefumier & Piégay 2003). These changes may<br />
endanger the balance of the mountainous environment and<br />
the vitality of life in rural areas (Piorr 2003; Hietala-Koivu<br />
2002; Perner & Malt 2003; Varotto 2004; Varotto & Psenner<br />
2003).<br />
Main findings<br />
Status<br />
The Alpine Space is one of the most competitive areas<br />
in Europe. Interestingly, this is particularly the case<br />
for regions located in the central part of the Alpine arc,<br />
while the eastern and western fringes display rather low<br />
per capita GDP. Even without the outlier Liechtenstein,<br />
data on per capita GDP reveal the polarisation within the<br />
Alpine bow. Regions with the highest and regions with<br />
the lowest per capita income differ by a factor of five. Not<br />
surprisingly, regions with lower GDP also show an aboveaverage<br />
level of unemployment.<br />
Development within the Alpine arc is influenced to a high<br />
degree by the division of labour, the establishment of the<br />
European common market and other processes that take<br />
place across the whole of Europe, which is why the transport<br />
sector cannot be assessed without considering the<br />
development taking place beyond the Alpine region.<br />
Trends<br />
In terms of economic sectors, the Alpine primary and secondary<br />
sector are losing shares, while the tertiary sector<br />
with market and non-market services is increasing in<br />
importance. The volume of transported high-value goods<br />
is increasing and consequently, the quality of transport in<br />
terms of punctuality and reliability become more important<br />
than transport costs themselves.<br />
The structural change of agriculture is continuously progressing.<br />
In the Italian <strong>Alps</strong> an outstandingly high level of<br />
change was registered. Data reveal that in regions with<br />
a high share of part-time farming, good accessibility can<br />
help to sustain farming.<br />
Hot issues<br />
Good accessibility is an expression of a favourable site<br />
condition, which is of great importance for regional development.<br />
At the same time it becomes obvious that the<br />
vitality of a region does not depend only on accessibility.<br />
Bibliography<br />
Ackermann, N., Hiess, H., Simon, C., Schreyer, C., Weninger,<br />
A., Zambrini, M. (2006): Leisure, Tourism and Commuter<br />
Mobility. In: Future in the <strong>Alps</strong>. CIPRA-International (ed.).<br />
Schaan, 76.<br />
ARE – Bundesamt für Raumentwicklung (2004): Perspektiven<br />
des schweizerischen Güterverkehrs bis 2030. Hypothesen<br />
und Szenarien. Bern.<br />
ARE – Bundesamt für Raumentwicklung (2006): Perspektiven<br />
des schweizerischen Personenverkehrs. Bern.<br />
ASTAT – Istituto di Statistica della Provincia di Bolzano<br />
(2005): 8. Censimento generale dell’industria e dei servizi 22<br />
ottobre 2001 con confronto tra Tirolo, Alto Adige e Trentino.<br />
ASTRA (ed.) (2004): Wirkungskette Verkehr – Wirtschaft.<br />
Analyse der Wechselwirkungen und Vorschlag für ein Indikatorensystem<br />
der wirtschaftlichen Aspekte eines nachhaltigen<br />
Verkehrs. Autor: Ecoplan / Büro Widmer, Altdorf-Freienfeld.<br />
BAK (ed.) (2005): MARS: Monitoring the Alpine Regions<br />
Sustainability. Basel-Economics, Basel.<br />
Bätzing, W. (2000): Die Alpen als Vorreiter und Prüfstein<br />
einer nachhaltigen Entwicklung im Zeitalter der Globalisierung.<br />
In: Mitteilung des Vereins zum Schutz der Bergwelt,<br />
München: 199-205.<br />
Bätzing, W. (2005): Le Alpi – una regione unica al centro<br />
dell’Europa. Bollati Boringheri, Torino.<br />
Baur, P. (2000): Agrarstrukturwandel – das Ergebnis von<br />
Druck oder Sog? In: Agrarforschung, 7 (02): 76-81.<br />
BFS – Bundesamt für Statistik (ed.) (1997): Strukturatlas der<br />
Schweiz. Verlag Neue Zürcher Zeitung, Zürich.<br />
Birkenhauer, J. (2002): Alpen 2002 – Eine Bestandsaufnahme.<br />
In: Geographische Rundschau, 54 (5): 51-55.<br />
Buchli, S., Buser, B., Rieder, P. (2002): Moving <strong>Alps</strong> – ein<br />
neuer Weg in der Regionalentwicklung? In: Agrarwirtschaft<br />
und Agrarsoziologie, 2: 3-20.<br />
Buchli, S., Kopainsky, B. (2005): Landwirtschaft und dezentrale<br />
Besiedlung. In: Agrarforschung, 12 (7): 288-293.<br />
Dieters, J., Gräf, P., Löffler, G. (2001): Verkehr und Kommunikation<br />
– Eine Einführung. In: Nationalatlas Deutschland.<br />
ESPON (ed.) (2006): Mapping regional competiveness and<br />
cohesion – European and global outlook on territorial diversities.<br />
ESPON Briefing 2, March 2003. Copenhagen.<br />
EUROSTAT (2004): Unemployment rate - total. http://epp.eurostat.ec.europa.eu/portal/page?_pageid=1996,39140985&_<br />
dad=portal&_schema=PORTAL&screen=detailref&languag<br />
e=en&product=STRIND_EMPLOI&root=STRIND_EMPLOI/<br />
emploi/em071 (accessed: 10. October 2006).<br />
EUROSTAT (2006a): Statistics in Focus. EU Labour Force<br />
Survey – Principal results 2005. Population and social conditions.<br />
13/2006. Brussels.<br />
EUROSTAT (2006b): Regional GDP per inhabitant in the EU<br />
25. news release 63/2006, 18 May 2006.<br />
EURAC – European Academy, Institute for Regional Development<br />
and Location Management (2006): Agralp-Development<br />
of agricultural structures in the area of the Alpine<br />
Convention, first results. http://www.eurac.edu/Org/<br />
AlpineEnviroment/RegionalDevelopment/Projects/Agralp_<br />
en_1.htm (accessed 4. July 2006).<br />
55
Report on the State of the <strong>Alps</strong><br />
Favry, E., Arlot, M.-P., Atmanagara, J., Castiglioni, B., Cernic-Mali,<br />
B., Egli, H.-R., Golobic, M., Massarutto, A., Pfefferkorn,<br />
W., Probst, T. (2004): Regalp: Projektbeschreibung,<br />
Hauptergebnisse und Schlussfolgerungen.<br />
Favry, E., Pfefferkorn, W. (2005): The <strong>Alps</strong> over the Past<br />
Years: Changes in Spatial Structures and Cultural Landscapes.<br />
In: Pfefferkorn W., Egli, H.-R., Massarutto, A. (eds):<br />
Regional Development and Cultural Landscape Change in<br />
the <strong>Alps</strong> – The challenge of Polarisation. Geographica Bernensia.<br />
Bern: 21–58.<br />
Hiess, H., Musovic, Ž., Pfefferkorn. W. (2003): Accessibility<br />
Analysis of the <strong>Alps</strong>. In: ANNEX 3 to Work package 2 report<br />
of the Regalp Project, 55.<br />
Hietala-Koivu, R. (2002): Landscape and modernizing agriculture:<br />
a case study of three areas in Finland in 1954–1998.<br />
Agriculture, Ecosystems and Environment, 91, 273–281.<br />
Ickert, L. (2006): Prospettive del trasporto merci su strada<br />
transalpine. In: Il Trasporto nello Spazio Alpino: una Sfida<br />
Transfrontaliera, MONITRAF: 125-136.<br />
Knoflacher, H. (1998): Die Alpen mehr als ein Verkehrshindernis.<br />
In: 1. Alpenreport – Daten, Fakten, Probleme,<br />
Lösungsansätze. CIPRA-International (ed.), Schaan: 333-<br />
338.<br />
Krausmann, F., Haberl, H., Schulz, N. B., Erb, K-H., Darge,<br />
E., Gaube, V. (2003): Land-use change and socio-economic<br />
metabolism in Austria Part I: Socio-economic driving forces<br />
of land-use change 1959-1995. In: Land Use Policy, 20: 1-20.<br />
Linneker, B. (1997): Transport infrastructures and regional<br />
economic development in Europe – A review of theoretical<br />
and methodological approaches, TRP 133, Sheffield, Department<br />
of Town and Regional Planning.<br />
Mann, S. (2003): Bestimmungsgründe des landwirtschaftlichen<br />
Strukturwandels. In: Agrarforschung, 10 (1): 32–36.<br />
Office de Statistique (2004): Annuaire Statistique du canton<br />
de Freiburg (2004): Vie active et rémunération du travail.<br />
Perlik, M. (2005): Synthese und Ausblick: Was kommt nach<br />
der Verkehrslawine? Zwischen Palliativemaßnahmen und<br />
neuen institutionellen Regeln. INTERREG Alpine Space<br />
MONITRAF, Bozen-Innsbruck.<br />
Perlik, M., Debarbieux, B. (2001): Die Städte der Alpen<br />
zwischen Metropolisation und Identität. In: Alpenrport 2,<br />
CIPRA (ed.), Haupt Verlag, Bern: 86–95.<br />
Perner, J., Malt, S. (2003): Assessment of changing agricultural<br />
land use: response of vegetation, ground-dwelling<br />
spiders and beetles to the conversion of arable land into<br />
grassland. In: Agriculture, Ecosystems and Environment, 98:<br />
169-181.<br />
Pfefferkorn, W., Egli. H.-R., Massarutto, A. (2005): Regional<br />
Development and Cultural Landscape Change in the<br />
<strong>Alps</strong> – The Challenge of Polarisation. Geographica Bernensia,<br />
G74, Bern.<br />
Piorr, H.-P. (2003): Environmental policy, agri-environmental<br />
indicators and landscape indicators. In: Agriculture, Ecosystems<br />
and Environment, 98: 17–33.<br />
PROGNOS (2002): Verkehrsprognosen: Personen- und<br />
Güterverkehrsprognosen für den Brenner. Brenner-Basistunnel-EWIV.,<br />
Innsbruck-Bolzano.<br />
Schmitt, G., Burose, C. (1995): Zu den Triebkräften des agrarstrukturellen<br />
Anpassungsprozesses in der Bundesrepublik<br />
Deutschland – Abwanderungsdruck oder Abwanderungssog?<br />
In: Berichte über Landwirtschaft: 73: 177–203.<br />
Schweizer Berghilfe (2000): Ohne Fahrwege bis Ende<br />
des 20. Jahrhunderts – zwischen Flums und Flumserberg.<br />
Berghilf-Ziitig Nr. 29, Brugg.<br />
Spiekermann, K. (2006): Territorial impact of transport policy<br />
– chances and risks for mountain regions based on ESPON<br />
results MONTESPON. Proceedings of Montespon Conference,<br />
Lucerne, 5. September 2006.<br />
Spiekermann, K., Neubauer, J. (2002): European accessibility<br />
and Peripherality: concepts, models and indicators. Nordregio<br />
Working Paper 9.<br />
Taillefumier, F., Piégay, H. (2003): Contemporary land use<br />
changes in prealpine Mediterranean mountains: a multivariate<br />
GIS-based approach applied to two municipalities in<br />
the Southern French Prealps. In: Catena, 51: 267–296.<br />
Tappeiner, U., Tappeiner, G., Hilbert, A., Mattanovich, E.<br />
(2003): The EU Agricultural Policy and the Environment.<br />
Blackwell, Berlin.<br />
UBA – Umweltbundesamt (ed.) (2005): Die Veränderungen<br />
im deutschen Alpenraum dokumentieren. Beiträge zu einem<br />
Zustandsbericht für das deutsche Alpenkonventionsgebiet.<br />
Berlin.<br />
Varotto, M. (2004): Montagna senza abitanti, abitanti senza<br />
montagna: le recenti tendenze demografiche e insediative<br />
nell´Arco Alpino italiano (1991-2000). In: Angelini-Cason, E.,<br />
Giulietti, S., Ruffini, F. V. (a cura di): Il privilegio delle Alpi:<br />
moltitudine di popoli, culture e paesaggi. Accademia Europea<br />
Bolzano: 101–106.<br />
Varotto, M., Psenner, R. (ed.) (2003): Spopolamento montano:<br />
cause ed effetti / Entvölkerung im Berggebiet: Ursachen<br />
und Auswirkungen. Belluno/Innsbruck.<br />
Wegener, M. (2003): Beschleunigung, Erreichbarkeit und<br />
Raumgerechtigkeit. In: Raum – Zeit – Planung. Konferenzband<br />
der 9. Konferenz für Planerinnen und Planer NRW, 5.<br />
November 2003, Zeche Zollverein Essen: 26–35.<br />
Weiss, F. (2006): Bestimmungsgründe für die Aufgabe / Weiterführung<br />
von landwirtschaftlichen Betrieben in Österreich.<br />
Diskussionspapier DP-14-2006, Institut für nachhaltige Wirtschaftsentwicklung,<br />
Universität für Bodenkultur, Wien.<br />
Wirtschaftsforschungsinstitut Bozen (2004): Produktivität<br />
– Südtirol auf dem Weg in die Zukunft. Szenarien bis 2030<br />
und vergleichende Anlalyse mit dem Alpenraum.<br />
56
Chapter B – Driving Forces of Mobility and Transport<br />
B3<br />
The Change in Land Use<br />
Land use and its change are indicators of spatial<br />
development trends. Spatial structures and development<br />
have an influence on land use and vice versa. Therefore<br />
land-use change is closely connected to the development<br />
of transport needs and infrastructure.<br />
This chapter describes the present situation of land use<br />
and how it has changed from the mid-1990s to around<br />
2003 in the Alpine arc. The focus is on the three landuse<br />
classes of forest area, agricultural area, and settlement<br />
including traffic infrastructure. The area shares of<br />
these classes are depicted on different levels: following<br />
an overview at national level the regional differences are<br />
displayed at NUTS-2 and NUTS-3 level.<br />
B3.1 Spatial development processes<br />
in the <strong>Alps</strong><br />
The change in land use in the Alpine arc is evident in two<br />
main trends: some regions – mainly the large valleys and basins<br />
with urban centres – show a dynamic development, with<br />
a high and fast-growing population density (see chap.B1),<br />
and a large and growing share of built-up area. Agricultural<br />
landscapes are transformed into periurban settlements and<br />
transport facilities are concentrated in these areas. An important<br />
network of roads and railways connects them. In<br />
contrast, other regions show strong trends towards marginalisation,<br />
with decreasing population and abandonment of<br />
agriculture, leading to afforestation, in a continuous cycle. In<br />
some cases strong tourism activity or the influence of conurbations<br />
bordering the Alpine Convention area may change<br />
this pattern, but in general a concentration process of people<br />
and infrastructure is continuing.<br />
Land use and transport infrastructure – a close relation<br />
The change in land use is often initially seen as a secondary<br />
effect of the development of transport infrastructure and settlement<br />
activities. Transport and settlements are necessary<br />
requirements to support the life of the local population. The<br />
development of transport infrastructure uses area resources<br />
directly, but indirectly it also leads to changes in land use<br />
through changes in accessibility and income possibilities. On<br />
the other hand, land-use changes also influence the need<br />
for infrastructure development. Growing settlement areas<br />
and periurbanisation of large areas require good transport<br />
facilities and high degrees of mobility and thus accelerate<br />
the land-take process.<br />
Economic and population growth are important links between<br />
the development processes of transport and land use:<br />
• When the population grows, there will be an increasing<br />
need for transport and for mobility (cp. chap. B1). Where<br />
good accessibility to goods, services, workplaces and<br />
other facilities is provided, population numbers will probably<br />
increase. Thus good transport infrastructure can<br />
lead to a prosperous region.<br />
• Nevertheless there is also the potential for a draining effect<br />
towards central regions, because people can easily<br />
move away from their remote and marginal location. A<br />
spatial separation between housing and business / working<br />
areas can take place, producing commuter traffic,<br />
often combined with environmental and social problems.<br />
The direction of these possible effects is steered by the<br />
amount of different needs, which can be satisfied at local or<br />
intra-regional basis, which defines quality of life and the attractiveness<br />
of a region. Any attempt to influence the processes<br />
of transport and land use has to take into account the different<br />
aspects of economics, welfare, resource management,<br />
and life quality. Successful management will be possible<br />
only with an integrated approach to regional development.<br />
Land use and accessibility<br />
Two accumulating effects form the impact of transport infrastructure<br />
on land use:<br />
• A direct effect is the land take. The actual area of the lineshaped<br />
features may be not the most important indicator.<br />
The effects of noise, pollution and fragmentation influence<br />
a much larger area than the actual space covered.<br />
The special topographic situation in the Alpine valleys,<br />
where the roads and railroad lines are usually concentrated<br />
and situated close to populated areas, increases<br />
the impact on the environment and people.<br />
• A second effect on land use results indirectly from the<br />
development of the transport infrastructure: improved accessibility<br />
(see subchap. B2.2) offers new possibilities for<br />
business activities, better supplies for needs and easier<br />
market access. Depending on different factors this can<br />
lead to periurbanisation (see subchap. B1.2.2) of rural<br />
areas but also to marginalisation and depopulation.<br />
Accessibility (for a definition see Introduction part A) is an<br />
important factor in the development of urban and peripheral<br />
regions. Opposite trends of economic, structural and land<br />
use evolution are indicators for these development types.<br />
The level of accessibility is determined in turn by the type of<br />
transport infrastructure as well as by the distance that has to<br />
be travelled to supply the needs of the population.<br />
Land use is connected to accessibility through the potential<br />
added value of the kind of land use:<br />
• Highly profitable types of land use (i.e. settlement, containing<br />
housing areas, business, industrial production,<br />
but also tourist centres and others) can support the lives<br />
of many people. The population density generated by<br />
this development requires increasing transport facilities<br />
and easy accessibility of goods and services.<br />
• In contrast, extensive land-use forms like forestry require<br />
large areas to make a living and thus support only low<br />
population densities. In consequence the infrastructure<br />
density required by this type of land use and its accessibility<br />
often remains low.<br />
In this sense land-use change is a driver for development in<br />
traffic and transport: employment and productivity migrates<br />
from rural areas towards urban areas, with, in consequence,<br />
an increase in commuting or even abandonment of rural areas.<br />
A decreasing share of subsistence and local/regional<br />
economic relations increases the need for transport.<br />
57
Report on the State of the <strong>Alps</strong><br />
Linked with land-use change are the effects of the loss of<br />
natural habitat, the loss of productive agricultural areas,<br />
fragmentation, the loss of land to roads and buildings, and a<br />
change in the appearance of the landscape.<br />
As the currently available data describe local situations, this<br />
data can only be linked with local traffic phenomena. Transit<br />
traffic hardly influences land-use change and therefore cannot<br />
be analysed.<br />
Indicators used<br />
Indicators used for the change of land use are:<br />
B6-1 Settlement and traffic area,<br />
B3-5 Cultivated land, and<br />
B4-1 Forest area.<br />
Data sources<br />
The data used were provided via the Permanent Secretariat<br />
of the Alpine Convention from national statistical<br />
offices and contain statistics on agriculture (A), forestry<br />
(F), settlement and infrastructure (S):<br />
Austria Cadastral data from UBA (A, F, S)<br />
Switzerland Areal statistics (A, F, S)<br />
Germany Areal statistics (A, F, S)<br />
Liechtenstein Areal statistics (A, F, S)<br />
France Corine landcover (F;S); Agriculture statistics (A)<br />
Italy Forest statistics (F); National statistics (A)<br />
Slovenia Landsat Satellite data (A, F, S)<br />
More details on the data are provided in Annex B3.<br />
It is known, that area statistics derived from Corine Landcover<br />
data are inaccurate in particular for settlement and<br />
infrastructure values, as areas of less than 25 hectares<br />
are not identified as a separate area class. This different<br />
data quality leads to restricted comparability between<br />
countries.<br />
B3.2 Development of areas for settlement<br />
and transport infrastructure<br />
at national level<br />
The countries which to date have provided data on the area<br />
of settlement have collected and aggregated this data in<br />
different spatial resolutions. Summed up according to the<br />
national level, considering the area of the Alpine Convention<br />
only, there is an increase in settlement area of between<br />
0.47% per year in France and 1.29% in Switzerland and<br />
Liechtenstein and 1.32% per year in Germany.<br />
These mean values are based on different lengths of the<br />
period under review. In Fig. B3-1 the change is given relative<br />
to the settlement area in the first year of observation.<br />
Thus the different time period of observations becomes obvious.<br />
The remarkably low increase in France is partly due to<br />
the methodological limitations of data sampling from Corine<br />
Landcover data (see textbox on indicators).<br />
Increase in infrastructure area in %<br />
Fig. B3‐1: Relative change in settlement and traffic infrastructure area<br />
(Source: National Statistics see Annex B3).<br />
Special aspects in the <strong>Alps</strong> – the area of permanent<br />
settlement<br />
The area of permanent settlement (PSA) is a concept to better<br />
consider land suitable for human settlement in order of<br />
altitude, slope aspect and other constraints. This is of great<br />
importance in the Alpine area as here natural constraints<br />
play a major role compared with the lowlands. The definition<br />
of PSA is given in subchap. B1.2.3. In Alpine municipalities<br />
the PSA is often only about 20% of the total area.<br />
In relation to the PSA, values are more impressive: calculated<br />
as national mean, between 12% and more than 30% of the<br />
PSA is “settlements and traffic infrastructure”. The national<br />
mean rates of change fall by between 0.1% (SL) and 0.37%<br />
(LI) per year, calculated over different national periods.<br />
Share of infrastructure area per PSA in %<br />
Fig. B3‐2: Settlement and traffic infrastructure area per PSA<br />
(Source: National statistics, see Annex B3).<br />
Switzerland and Liechtenstein have the highest values for<br />
status as well as in change rates. They seem to perform the<br />
most dynamic construction development on an already high<br />
level within the five compared countries (for France no PSA<br />
data is available).<br />
58
Chapter B – Driving Forces of Mobility and Transport<br />
B3.3 Regional differences in landuse<br />
development<br />
Further analysis in this chapter focuses on different regional<br />
changes, considering different causes for land-use changes<br />
in different types of regions.<br />
B3.3.1 Changes of settlement area in LAU-2 <br />
level<br />
Due to the data available for this report, only France, Switzerland,<br />
Germany and Austria could be analysed. For<br />
those countries data was available for the development of<br />
built-up area on LAU-2 level for at least two points in time.<br />
<strong>How</strong>ever this data does not allow a distinction between<br />
different types of built-up area (settlement, industry, traffic<br />
infrastructure etc.), therefore the interpretation is rather<br />
limited. It must be stressed when displaying the data that<br />
comparison between countries is almost impossible,<br />
because of the various origins of the data (see textbox on<br />
indicators). Thus interpretation has to focus on differences<br />
within the countries.<br />
<br />
The abbreviation LAU means “Local Administrative Unit”; LAU-2, formerly known<br />
as NUTS-5, refers to all municipalities, municipality free areas or respective units in<br />
the EU Member States.<br />
One hot spot of built-up area development seems to be<br />
the central region of Switzerland (parts of Glarus, Uri). This<br />
region shows the highest values in both growth dimensions<br />
(absolute and relative).<br />
In Austria the highest relative increments of built-up area are<br />
mainly connected to tourist areas. It does not mean that all<br />
tourist areas show a significant increase of built-up area, but<br />
if there is a significant relative increase of built-up area, it<br />
is mostly in a tourist area. Regarding the opposite image of<br />
absolute areas of settlement increase, i.e. lower values in<br />
tourist areas, the following interpretation is given: built-up<br />
development in tourist areas is low, but as tourism prefers<br />
regions with a lower degree of existing built-up area, the relative<br />
change may appear higher (few changes in relation to<br />
small existing areas).<br />
On average the German and Austrian communities show<br />
higher relative increases than Switzerland. France appears<br />
to be a quite stable country, but one has to note that the<br />
French data result from Corine Land Cover, with the inherent<br />
underestimation of both urban areas and urban changes.<br />
Map B3‐1: Relative annual change in settlement and traffic infrastructure area on LAU-2 level (Sources: National statistics, see Annex B3).<br />
59
Report on the State of the <strong>Alps</strong><br />
Negative values of change indicating shrinking areas of<br />
settlement (see Graubünden, CH) probably result more from<br />
data inconsistency than from an actual decrease in area.<br />
B3.3.2 Changes in cultivated, forest, and<br />
settlement areas in NUTS-3-regions <br />
Cultivated areas<br />
The “cultivated areas”, which are areas used for agriculture,<br />
including grassland, are characterised by a general negative<br />
trend in the territory of the Alpine Convention: The only<br />
province with an increase in cultivated area is Torino (Italy).<br />
According to the results of the national flow analysis in chapter<br />
B3.4 in the Eastern and Central <strong>Alps</strong> (Austria, Slovenia,<br />
Germany, Switzerland) the regional decrease is only small<br />
or even “0”. In the western and southern <strong>Alps</strong> (France, Italy)<br />
the decrease per year in cultivated area exceeds 2% to 4%<br />
of the reference year. The highest losses are registered in<br />
the French departments Savoie, Haute-Alpes and Alpes-<br />
Maritime. Higher losses in the Eastern <strong>Alps</strong> are reported for<br />
the south of Kärnten and Innsbruck (both Austria) and in Italy<br />
for parts of the provinces of Liguria, Piemonte, Lombardia,<br />
Veneto and Friuli Venetia-Giulia.<br />
The highest relative decrease in cultivated area is reported in<br />
France. This is quite astonishing, considering that changes<br />
<br />
If between the two time stamps of sampling, a province has been split into two or<br />
more provinces, then the old “common” province is displayed. This is the case in two<br />
Italian provinces (Novara, Vercelli). Bergamo, Como and Lecco were summed up as<br />
“Como+Bergamo”.<br />
in France are only recorded in areas larger than 5 ha, as they<br />
rely on the Corine Land Cover data. In general the decrease<br />
is higher in the central areas of the French <strong>Alps</strong>. It seems to<br />
be the case that less cultivated area is lost in those regions<br />
which border the <strong>Alps</strong>.<br />
Switzerland and Austria show relatively constant low decrease<br />
values all over the country, whereas regional differences<br />
in close neighbourhood are highest in France. This<br />
corresponds to the mix of communities with increasing and<br />
decreasing population which is shown for France in chap. B1.<br />
Forests<br />
Forest areas appear to be stable in most regions of Austria,<br />
Germany, Switzerland and France. In relative terms, little<br />
forest increase can be observed in Slovenia and the Italian<br />
Province of Trentino. Italy is the only country where a high<br />
decrease in forest has occurred, in particular in the areas of<br />
Piemonte, Sondrio/Bergamo and Udine. The order of magnitude<br />
of loss of forest is about the same as the changes in<br />
cultivated area.<br />
As forest covers mostly large areas within NUTS-3 regions<br />
the relative changes in area are often expressed only in<br />
small percentages.<br />
The main areas of loss of agricultural area and increase in<br />
forest area (in general parts of the western and the southern<br />
<strong>Alps</strong>) correspond to the areas with less transport infrastructure:<br />
the main road network is less dense in those regions<br />
(see chap. A1.3). This may support an indication of the mu-<br />
Map B3‐2: Relative annual change in cultivated area (on NUTS-3 level) (Sources: National statistics, see annex B3).<br />
60
Chapter B – Driving Forces of Mobility and Transport<br />
Map B3‐3: Relative annual change in forest area (on NUTS-3 level). Time periods considered for each country are shown in the legend: data source<br />
(Sources: National statistics, see Annex B3).<br />
Map B3‐4: Absolute annual change in settlement and traffic infrastructure area change (on NUTS-3 level) (Sources: National statistics, see Annex B3).<br />
61
Report on the State of the <strong>Alps</strong><br />
Settlement and transport infrastructure<br />
The amount of change in settlement and transport area is by<br />
a factor of more than 100 lower than the other land uses. It<br />
ranges from several to a few hundred hectares per year in<br />
NUTS-3-regions.<br />
In Austria, the regions with high increasing settlement and<br />
traffic infrastructure correspond to densely populated municipalities<br />
(Tirol/Inntal, Salzburg with its surroundings, Klagenfurt-Villach,<br />
southern part of Niederösterreich), whereas<br />
Germany has much more densely populated municipalities,<br />
but less increase in settlement area. In Switzerland the highest<br />
activity is seen in the southern cantons (Graubünden,<br />
Ticino, Valais), and in France in the Department Haut-Savoie<br />
around Annecy and in the South (Alpes-Maritimes).<br />
The total increase in settlement area does not always correspond<br />
with high relative changes in relation to a reference<br />
year. In Haute-Savoie (FR), for example, the “hectare increase”<br />
is high but the “percentage of reference year” value<br />
is much lower. In those regions where a high share of settlement<br />
areas is already present in the reference year, the percentage<br />
increase seems fairly low. Nevertheless, absolute<br />
values indicate high activity in land-use change.<br />
Switzerland shows a high increase in settlement area in hectares,<br />
but when displayed as relative to the reference year,<br />
it is less marked (cp. Map B3-1). This accords with the high<br />
increase on an already high level.<br />
B3.4 Land-use transformation to the<br />
detriment of agricultural area<br />
A deeper insight into land-use change processes offers an<br />
analysis of land-use transformation. This investigates which<br />
land-use classes increase on the cost of which class. An<br />
analysis of land-use transformation requires spatially exact<br />
data. Land-use change has to be documented for each spot<br />
within the area under investigation. Because in most cases<br />
only aggregated data is available, a real land use transformation<br />
can often not be compiled. For the land use classification<br />
Corine Land Cover data, as provided by France, are not very<br />
precise. Therefore this calculation has been carried out only<br />
for selected countries (Germany, Austria, Switzerland).<br />
As a workaround method, but nevertheless much more exact<br />
than pure statistical aggregation, for this report simplified<br />
land use transformation tables have been constructed (see<br />
box “land use transformation matrices” in Annex B3).<br />
The analysed classes of land use are<br />
• agricultural area also referenced as cultivated area,<br />
comprises farming area including horticulture, grassland<br />
and pastures (the detailed definition may vary from<br />
country to country),<br />
• forest area, and<br />
• area of settlement and traffic infrastructure (mainly<br />
a self-contained built-up area, including traffic).<br />
The change per year reveals the same trends in the three countries<br />
(see Tab. B3-1). Agricultural areas are being lost to forest<br />
on one side and to settlement on the other (cp. chap. B2.4).<br />
Other land-use changes are not notable. <strong>How</strong>ever when interpreting<br />
the values in the tables one has to take into account<br />
that due to the underlying assumptions, the changes<br />
are systematically underestimated. But they give the verified<br />
minimal change rate. In reality the change rate is larger.<br />
Switzerland (12 years run-time)<br />
ha in start<br />
year<br />
(1982)<br />
A F S Total<br />
loss<br />
change/year in % of start year<br />
in %<br />
A 251,351 0.11 0.18 0.29<br />
F 609,303 0.00<br />
S 75,411 0.01<br />
Total 936,065<br />
Germany (4 years run-time)<br />
ha in start<br />
year<br />
(2000)<br />
A F S Total<br />
loss<br />
change/year in % of start year<br />
in %<br />
A 508,983 0.15 0.14 0.29<br />
F 428,626 0.01<br />
S 75,443 0.01 0.01<br />
Total 1,013,053<br />
Austria (5 years run-time)<br />
ha in start<br />
year<br />
(2001)<br />
A F S Total<br />
loss<br />
change/year in % of start year<br />
in %<br />
A 932,661 0.10 0.17 0.27<br />
F 2,771,929 0.01<br />
S 179,042 0.02 0.03<br />
Total 3,883,632<br />
Tab. B3‐1: Land-use change per year in percent of initial area of the start<br />
year. A= agriculture, F=Forest, S=settlement and traffic infrastructure;<br />
red and green colour indicate loss and increase of agricultural and forest<br />
area respectively (Sources: Alpine Convention, see Annex B3).<br />
Of major interest is the result that in all three countries agricultural<br />
areas are being transformed at the same rate of almost<br />
0.3% per year of the initial area. This may seem low,<br />
but is based on trends over several years and, in these countries,<br />
on cadastral data. As mentioned, the change is systematically<br />
underestimated, so that it seems a valid conclusion<br />
that a trend of loss of agricultural area is present. The main<br />
type of agricultural area that is being lost is presumed to be<br />
grassland, which is very important for conservation issues.<br />
Whereas agricultural area in Switzerland and Austria is lost<br />
at higher rates to settlement areas, in Germany the losses to<br />
forest and to settlement are almost equal.<br />
62
Chapter B – Driving Forces of Mobility and Transport<br />
Fig. B3-3: Land use change in NUTS-2 regions (Sources: National statistics, see Annex B3).<br />
Loss of cultivated area partly corresponds to an increase in<br />
settlement and traffic (Tiroler Unterland, Innsbruck, Haute-<br />
Savoie). But such a loss is also possible in other regions.<br />
Flow analysis shows that the absolute value of hectares<br />
transforming from agriculture to settlement is equivalent in<br />
magnitude to the transformation to forest (on NUTS-2 level).<br />
That means “agricultural land” is the category from which in<br />
some regions the main area is being lost to forest, and in other<br />
regions to settlement. In Austria and Switzerland, the main<br />
flow seems to go towards settlement (partly double that of<br />
forest-targeted, and especially in NUTS-2 regions with high<br />
settlement activity like Tiroler Unterland, Villach-Klagenfurt),<br />
whereas in Germany the flow towards forest is higher.<br />
Main findings<br />
Status<br />
The area of settlement and transport infrastructure is<br />
increasing generally in all Alpine countries. In most cases<br />
these increases occur on agricultural land.<br />
Trends<br />
There is a fast increase in settlement and transport infrastructure<br />
area in Switzerland (and Liechtenstein), based<br />
on an already high level.<br />
Cultivated area serves as area resource for forest or<br />
settlement and transport infrastructure in rural or densely<br />
settled areas, respectively.<br />
Area loss of cultivated land is high in France and Italy and<br />
southern parts of Switzerland, lower in Austria, Germany,<br />
and in central Switzerland.<br />
Hot issues<br />
Development of settlements and traffic infrastructure is<br />
concentrated to existing infrastructure. A concentration<br />
process of population and built-up area is ongoing.<br />
The mutual dependency of infrastructure development<br />
and land-use changes requires an integrated approach<br />
for regional development. In order to increase the accessibility<br />
for peripheral regions it is more important to<br />
develop opportunities to earn a living than to increase the<br />
transport infrastructure.<br />
63
Report on the State of the <strong>Alps</strong><br />
B4<br />
Tourism and Transport<br />
Over 60 Mio holiday guests, another 60 Mio day tourists<br />
and about 370 Mio tourist nights spent make the <strong>Alps</strong><br />
the largest holiday region in Central Europe (Bätzing<br />
2003). Regarding the whole of Europe, only the Mediterranean<br />
region is a more favoured tourist destination<br />
(EEA 2003).<br />
Although the economic importance of tourism in the<br />
<strong>Alps</strong> is sometimes overestimated, it is a key industry<br />
for many Alpine areas. About 10% of the Alpine municipalities<br />
feature a touristic monostructure (Bätzing 2003).<br />
Based on good natural and infrastructural conditions<br />
(i.e. concerning sufficient snow cover), tourism here<br />
dominates the whole local or regional economy.<br />
The majority of tourist nights spent are counted during<br />
the summer. Nevertheless winter tourism is economically<br />
more important in many places due to the higher<br />
financial expenditure of winter tourists (Bartaletti 1998).<br />
The economic role of tourism in the <strong>Alps</strong> is dependent<br />
on and connected to the provision of transport infrastructures<br />
and capacities. These are needed to allow<br />
tourists to reach their destination in a reasonable time.<br />
They are also necessary to deliver goods and services<br />
to the tourist municipalities. Dependence on well-established<br />
transport connections increases with the remoteness<br />
of a municipality.<br />
The chapter outlines the role of tourism as one of the<br />
driving forces for traffic development. The tourism<br />
intensity in the <strong>Alps</strong> and the development of tourism<br />
demand gives an overview of the general development<br />
in the <strong>Alps</strong>. The relation between tourism and traffic is<br />
then investigated for some case studies in Austria.<br />
B4.1 A driving force behind traffic<br />
In general, changing leisure and tourism trends affect passenger<br />
transport. Within the <strong>Alps</strong>, the growth of leisure and<br />
tourism demands is expected to generate an increase in individual<br />
motorised transport, in particular. This is the most<br />
common form of transport used by tourists in many parts of<br />
the <strong>Alps</strong>, where public transport suited for tourists / tourist<br />
requirements is crucially lacking. The European Environment<br />
Agency estimates that up to 80% of all tourist journeys to<br />
the <strong>Alps</strong> are by car (EEA 2003). In Austria the number of<br />
tourist arrivals by car amounts to 85% (Rauh et al. 1998). In<br />
addition, once tourists have arrived at their destination, they<br />
frequently use the car during their holiday stays.<br />
Tourism transport is all transport related to vacations<br />
and holidays. It comprises the distances travelled to and<br />
from holiday destinations as well as the journeys taken<br />
during the holiday stay.<br />
According to the WTO definition “tourism” includes also<br />
business journeys. <strong>How</strong>ever “tourism transport” here<br />
refers only to transport undertaken for vacation reasons.<br />
Only a few figures exist that describe explicitly the share of<br />
tourism transport in comparison to other forms of passenger<br />
transport. European and German studies estimate that<br />
approximately 9% of all passenger-km travelled in the<br />
respective regions are for tourism purposes (EEA 2003,<br />
IFO 2000).<br />
Day tourism<br />
Economic growth and social changes lead to growing personal<br />
incomes, to an increasing amount of leisure time as<br />
well as to a growing demand for leisure activities outside the<br />
home (Meier n.d.). As the <strong>Alps</strong> are also a destination for day<br />
tourism and short trips connected to a multitude of sport and<br />
other leisure activities, these are also an important source of<br />
transport pressures. Detailed figures do not exist. But some<br />
conclusions can be drawn from the development of the whole<br />
segment of leisure transport, which comprises all forms of<br />
transport connected to sport or cultural activities, short trips,<br />
events or the visits of families and friends.<br />
In Germany and Switzerland, about 40% of all journeys (and<br />
45% of all distances covered) are for leisure purposes. In<br />
the near future, leisure transport in Germany is expected to<br />
increase by 30%. As the majority of leisure journeys are<br />
made by cars, this will lead to an increase in individual<br />
motorised transport in particular (IFO 2000, DIW & INFAS<br />
2004, BMVIT 2002, ARE & BFS 2001).<br />
From an environmental point of view, cars – after planes –<br />
cause the highest pressures on the environment (Peeters<br />
2006). So – for the Alpine space – the developments outlined<br />
above imply, for example, a risk of growing emissions of air<br />
pollutants and noise as well as a risk of an increasing land<br />
take for infrastructures.<br />
B4.2 Measuring tourism, traffic and<br />
their interrelations<br />
This chapter intends to analyse the interrelations between<br />
the tourism sector on the one side and the transport infrastructures<br />
and traffic volumes on the other.<br />
The first part focuses on the spatial situation and distribution<br />
of tourism centres in the context of transport infrastructures.<br />
The indicator “tourism intensity” will be used to identify those<br />
tourism centres.<br />
The intensity of tourism is usually defined by the number of<br />
beds in accommodation businesses per resident population.<br />
In France not only the “official” tourist sector is of importance,<br />
as a high share of tourist accommodation is offered by private<br />
second homes. In the whole of France, almost 335,000 new<br />
second homes were built during the past two decades. Second<br />
homes here represent 73% of the total tourist lodging<br />
capacity, and 18% of all nights spent by French residents in<br />
1999 were in their second home (EEA 2003). In Switzerland<br />
and Italy also, beds in second homes are supposed to play<br />
a role in considering tourism intensity (Bätzing 2003). But<br />
respective data to describe the situations were not delivered.<br />
Secondly an overview about the recent development of<br />
the tourism sector based on statistical data will be given.<br />
64
Chapter B – Driving Forces of Mobility and Transport<br />
An analysis of tourist arrivals, tourist nights spent and the<br />
duration of tourist stays (number of tourist nights by number<br />
of tourist arrivals) aims to show changes in tourism demand<br />
within the <strong>Alps</strong>, which may have strong influences on the<br />
traffic development.<br />
Finally the influences of leisure and tourism on transport volumes<br />
will be highlighted. As this cannot be explained only<br />
by using tourism statistics, respective insights will be drawn<br />
from the interpretation of data on traffic volumes. For this<br />
purpose, data from the Brenner Pass as well as from selected<br />
traffic measuring points in the vicinity of tourism centres<br />
in Austria will be used.<br />
Data limitations<br />
Several factors restrict the usage and the comparability of<br />
tourism data. First of all, the object of statistics differs between<br />
the different countries, as the following examples<br />
show: In Switzerland and Liechtenstein, only beds in hotels<br />
are counted. German statistics do not include businesses<br />
of fewer than nine beds. In Austria, only municipalities<br />
with more than 3,000 tourist nights spent report to<br />
the tourism statistics.<br />
In Germany, confidentiality obligations also restrict the<br />
use of statistical data on tourism. The calculation of tourism<br />
intensity is only possible for about 65% of the municipalities.<br />
In the context of this chapter, this is acceptable<br />
as further analysis of the tourism sector will place special<br />
focus on tourism centres. Here the number of accommodation<br />
businesses is usually above the critical values.<br />
Other figures such as the number of tourist arrivals and<br />
nights and the thereby calculated average duration of tourist<br />
stays can only be displayed on a higher level of statistical<br />
spatial units (NUTS-3), i.e. districts etc. This refers to<br />
Fig. B4‐3 in particular. At this spatial level, confidentiality<br />
obligations are only applied in exceptional cases. <strong>How</strong>ever,<br />
the problem with using data on level NUTS-3 is that<br />
these units do not wholly correspond with the boundaries<br />
of the Alpine Convention area.<br />
The interpretation of data is partly limited, as availability<br />
of data differs in terms of time-scale. Coherent time series<br />
describing long-term developments, both for tourism and<br />
transport, were only delivered for a few countries.<br />
What is tourism intensity?<br />
Tourism intensity is defined as the number of tourist beds<br />
per resident population. It is rather commonly used as a<br />
measure of provision of tourist facilities. The tourism intensity<br />
of the whole Alpine region, including beds in second<br />
homes and in the parahotellery sector, is estimated<br />
to be about 0.5 beds/inhabitant for 1991 (Bätzing 2003).<br />
The calculated tourism intensity based on current data<br />
amounts to 0.33 beds per inhabitant, however this does<br />
not include beds in second homes. Due to the relation to<br />
the resident population, the indicator tends to overvalue<br />
small municipalities and in turn to underestimate larger<br />
ones.<br />
Fig. B4‐1: Tourism intensity in Alpine municipalities (FR: 2002, IT: 2003;<br />
DE, SI: 2004; AT, CH: 2005).<br />
Role of second homes<br />
In French municipalities the number of beds in second homes<br />
adds to a large extent to the number of commercial tourist<br />
beds. Although these types of accommodation are not used<br />
as frequently as beds in hotel businesses (cp. EEA 2003),<br />
they have to be considered in the context of tourism intensity.<br />
For this reason, the second home intensity, i.e. the number of<br />
beds in second homes per inhabitant of French municipalities,<br />
was considered in addition to the tourism intensity (see<br />
Fig. B4‐2). Map B4-1 displays the highest class in either tourism<br />
or second home intensity.<br />
B4.3 Tourism centres and transport<br />
infrastructures in the <strong>Alps</strong><br />
Municipalities with a tourism intensity higher than 1 are regarded<br />
as tourism centres. As Fig. B4‐1 shows, about 9% of<br />
Alpine municipalities exceed this value. In other words, these<br />
municipalities offer more tourist beds than they have resident<br />
population. In another 8% of municipalities tourism intensity<br />
amounts to between 0.5 and 1 tourist beds per inhabitant.<br />
These figures reveal great differences between the Alpine<br />
municipalities, as they reveal that tourism is of no or low importance<br />
in about 80% of Alpine municipalities.<br />
Fig. B4-2: Second home intensity (beds/inhabitant) in French Alpine<br />
municipalities in 1999.<br />
65
Map B4-1: Tourism intensity (number of tourist beds per resident population) in Alpine municipalities. For France the number of beds in second homes per inhabitant were<br />
considered in addition to the tourism intensity.
Chapter B – Driving Forces of Mobility and Transport<br />
Tourism centres and transport infrastructure<br />
The spatial distribution of the tourism centres in the <strong>Alps</strong> follows<br />
the topography (see map B4-1). They are often close<br />
to the main Alpine ridge. Municipalities in the lower Alpine<br />
regions are generally of low tourism intensity.<br />
Not surprisingly, regions of very high tourism intensity are<br />
mostly skiing areas. In Austria, this applies to well-known skiing<br />
destinations in the <strong>Alps</strong>, e.g. Ischgl or Saalbach-Hinterglemm,<br />
Kitzbühel, Zillertal, Stubai or Ötztal and to the Hohe<br />
and Niedere Tauern ridge. In France, where some of the skiing<br />
resorts are only sparsely populated, municipalities near<br />
ski resorts such as Tignes, Val d’Isère or Alpe d’Huez are<br />
characterised by a high or very high tourism intensity. The<br />
Dolomite mountain ridge and the Valle d’Aosta are respective<br />
examples for Italy. Here, Lago di Garda is one important<br />
non-skiing tourist destination.<br />
In Switzerland the tourism centres with the highest intensities<br />
are also connected to high Alpine areas, e.g. Adelboden<br />
or Lauterbrunn in the Berner Oberland or St. Moritz. As only<br />
beds in hotel businesses are statistically registered, tourism<br />
intensity is not as distinct here. The few places in German<br />
Alpine regions with high tourism intensity are Bad Hindelang<br />
and Oberstdorf in Oberallgäu as well as Ramsau near Berchtesgaden.<br />
In Slovenia, Kranjska Gora, the Triglav National<br />
Park area and the Cerkljansko area are the most important<br />
tourist destinations within the <strong>Alps</strong>.<br />
The main transport infrastructures are tied to the longitudinal<br />
valleys or – when crossing the main Alpine ridge – to<br />
corridors where geographical obstacles are relatively easy<br />
to overcome. This contrasts with the location of the tourism<br />
centres, the majority of which are not situated close to transport<br />
infrastructures. On the contrary, some tourism centres<br />
are situated in rather remote and not easily accessible areas<br />
(see also: Wrbka et al. 2002, Pfefferkorn & Musović 2003).<br />
B4.4 Development of tourism<br />
demand<br />
The importance of tourism demand in the <strong>Alps</strong>, described by<br />
absolute figures of tourist nights spent in tourist accommodations,<br />
varies rather strongly between the Alpine countries.<br />
<strong>How</strong>ever, in order to draw conclusions on the development<br />
of traffic, the relative description of tourism demand is more<br />
meaningful.<br />
In the following Fig. B4‐3 France does not appear because<br />
data were only delivered for a single year. For Austria, the<br />
presentation of a graph showing the long-term development<br />
was rejected as data were only delivered for the years 1991,<br />
2001 and 2005.<br />
Generally speaking, the statistics show an increase in the<br />
number of tourist nights spent and tourist arrivals between<br />
1996 and 2005. In this period, tourist nights spent were declining<br />
only in Germany and Liechtenstein. The only country<br />
facing a decline in tourist arrivals is Liechtenstein. The recovery<br />
of the tourism sector in the <strong>Alps</strong> at the end of the 1990s<br />
has been slowed down or even halted in most countries by<br />
the economic recession following the years 2000 and 2001.<br />
Regarding the average duration of tourist stays, a tendency<br />
towards shorter holidays is to be observed (cp. Fig. B4‐3c).<br />
This trend is seen very strongly in Germany, where it reflects<br />
the decline in tourist nights spent. But it is also rather distinct<br />
in Italy and Switzerland, where the number of tourist arrivals<br />
is growing faster than the number of tourist nights spent.<br />
So in the <strong>Alps</strong> a weak trend towards shorter but more frequent<br />
holidays is visible between 1996 and 2003. This is in<br />
line with the developments observed by the European Environment<br />
Agency for the whole of Europe. People tend to use<br />
the increased length of their vacations for multiple holiday<br />
stays instead of extending one main holiday (EEA 2003).<br />
In terms of transport, tourists travelling more often to Alpine<br />
destinations and staying for shorter visits imply a growth in<br />
traffic volumes. Since tourists in the <strong>Alps</strong> arrive mostly by<br />
car, this applies in particular to individual motorised transport<br />
(see subchap. B4.1).<br />
Change of duration of days (1996=100%) Change of tourist arrivals (1996=100%) Change of tourist nights spent (1996=100%)<br />
130%<br />
120%<br />
110%<br />
100%<br />
90%<br />
80%<br />
70%<br />
130%<br />
120%<br />
110%<br />
100%<br />
90%<br />
80%<br />
70%<br />
130%<br />
120%<br />
110%<br />
100%<br />
90%<br />
80%<br />
70%<br />
1991<br />
1991<br />
1991<br />
1992<br />
1992<br />
1992<br />
1993<br />
1993<br />
1993<br />
1994<br />
1994<br />
1994<br />
1995<br />
1995<br />
1995<br />
1996<br />
1996<br />
1996<br />
1997<br />
1997<br />
1997<br />
Fig. B4‐3a-c: Development of tourist nights spent, arrivals and duration<br />
of tourist stays.<br />
1998<br />
1998<br />
1998<br />
1999<br />
1999<br />
1999<br />
2000<br />
2000<br />
2000<br />
2001<br />
2001<br />
2001<br />
2002<br />
2002<br />
2002<br />
2003<br />
2003<br />
2003<br />
2004<br />
2004<br />
2004<br />
2005<br />
2005<br />
2005<br />
67
Report on the State of the <strong>Alps</strong><br />
Fig. B4‐4: Average daily traffic volumes (ADTV) in 2003 at the Brenner Pass (Measuring Point Vipiteno, both directions aggregated; HGV – Heavy Goods<br />
Vehicles, PV – Passenger Vehicles).<br />
B4.5 Tourism and traffic volumes<br />
Although less than 10% of all distances covered are for tourism<br />
reasons (see subchap. B4.1), tourism travel can cause<br />
extensive traffic volumes on certain routes. For instance,<br />
about 55% of all journeys at trans-alpine roads in Switzerland<br />
are interrelated to holidays and vacations. An additional<br />
29% of the journeys are for leisure purposes, including<br />
among others day and short tourist trips (ARE 2003).<br />
Respective results of interviews and surveys are not available<br />
for the whole Alpine region. But the importance of tourismand<br />
leisure-related transport can also be interpreted by<br />
figures on traffic volumes from the transport sector, in particular<br />
by their seasonality and the occurrence of peak volumes.<br />
Traffic volumes at the Brenner Pass<br />
As an example, the traffic volumes at the Brenner motorway<br />
at Vipiteno will be examined (see Fig. B4‐4). The rather constant<br />
traffic volumes of Heavy Goods Vehicles on weekdays<br />
form a baseline for the total traffic volumes. The peak traffic<br />
volumes are clearly linked to passenger transport and have<br />
a strong interrelation to weekends, in particular to Saturdays.<br />
One main reason is journeys to and from holiday destinations,<br />
as Saturdays are still the usual day of tourist arrivals<br />
and departures. Another reason is day tourists taking short<br />
trips to the mountains at weekends.<br />
Furthermore, in 2003 the peak traffic volumes on the Brenner<br />
Pass were obviously related to holiday seasons in the<br />
adjacent countries. The first peak at the beginning of March<br />
corresponds with the carnival days, the second to the Easter<br />
holidays, with Easter Sunday the 20 th April. Throughout the<br />
summer season, traffic volumes are frequently high, starting<br />
from the beginning of June (Pentecost) until the end of<br />
the summer holidays in early September in e.g. Alto Adige,<br />
Austria and the German federal states of Bayern, Nordrhein-<br />
Westfalen and Baden-Württemberg. Relatively lower traffic<br />
volumes occur between October and January.<br />
Both observations underline the importance of tourism and<br />
leisure as sources of high traffic volumes. But as the Brenner<br />
Pass is one of the main trans-alpine transport corridors, the<br />
traffic volumes to a large extent reflect the journeys to and<br />
from destinations outside the Alpine area.<br />
Case study: Climate change and tourism demand<br />
Climate, a key location factor of the Alpine tourism sector<br />
is changing. The rising snow line, melting glaciers and a<br />
shortening of the season in particular affect winter tourism.<br />
Current measures such as artificial snow, ground<br />
adjustments or covering glaciers are short-term-strategies<br />
(Elsasser & Bürki 2005).<br />
Cover sheetings to retard the melting of glaciers at vulnerable places<br />
(Elsasser & Bürki 2005).<br />
The IX th Alpine Conference emphasised the need to develop<br />
suitable strategies and activities to adapt to the consequences<br />
of climate change – regarding also single economic<br />
sectors and regional peculiarities. Urgent sustainable<br />
measures are to be developed for branches such<br />
as tourism which are particularly affected by the ongoing<br />
changes (Alpine Conference 2006).<br />
In terms of tourism transport, the changing climate can<br />
subsequently lead to a concentration of traffic towards<br />
tourism centres at higher altitudes and of guaranteed<br />
snow. In the long term, the development of tourismrelated<br />
traffic volumes will depend on the ability of tourism<br />
centres to adapt to the changing conditions.<br />
68
Chapter B – Driving Forces of Mobility and Transport<br />
Map B4-2: Number of tourist arrivals in Austria.<br />
Traffic volumes near tourism centres<br />
In order to describe intra-Alpine leisure and tourism transport,<br />
the traffic situation in the vicinity of tourism centres within the<br />
<strong>Alps</strong> was analysed in a more detailed way. For this purpose,<br />
traffic volumes on access roads towards four Austrian tourism<br />
centres were analysed.<br />
All the centres that were studied have their majority of tourist<br />
nights during the winter season (see Fig. B4-5). The tourism<br />
regions adjacent to the Arlberg, Radstadt and Rauz-Flexen<br />
focus strongly on winter tourism; only in the Gastein municipalities<br />
(Klammtunnel) does summer tourism play a more<br />
important role.<br />
The indicator “tourism intensity” identified tourism centres<br />
marked by a high provision of tourism facilities (see Map B4-1).<br />
<strong>How</strong>ever, in the context of transport, the use of tourism<br />
facilities is of importance. For this reason, absolute numbers<br />
of arrivals were taken into account. These figures picture<br />
municipalities most likely to induce high volumes of tourismrelated<br />
traffic (see Map B4-2).<br />
The following measuring stations are situated on access<br />
roads to tourism centres. As far as numbers of tourist nights<br />
are mentioned in the text below, they refer to all associated<br />
municipalities listed in Tab. B4‐1.<br />
Measuring stations Road Rationale<br />
81 Arlbergtunnel S416 Connection between Vorarlberg<br />
and Tirol, gateway to Ischgl and<br />
St. Anton / Arlberg<br />
49 Radstadt B99 Gateway to the Niedere Tauern<br />
ridge and the skiing areas in<br />
Untertauern<br />
85 Klammtunnel<br />
(Dorfgastein)<br />
B167 Gateway to Obertauern, Bad<br />
Gastein, Bad Hofgastein<br />
998 Rauz-Flexen B198 Gateway to skiing areas in Lech,<br />
Klösterle<br />
Tab. B4‐1: Selected transport measuring stations.<br />
Fig. B4‐5: Seasonality of selected tourism centres in 2005.<br />
As already observed at the example of the Brenner Pass, all<br />
the measuring stations show peaks on Saturdays during the<br />
holiday seasons in winter and summer. The main reasons<br />
are journeys to and from holiday destinations. The specialisation<br />
on winter tourism may explain the very marked peak<br />
on winter Saturdays. Tourist arrivals and departures within<br />
the region coincide with day-tourist traffic visiting the regional<br />
winter sport facilities.<br />
69
Report on the State of the <strong>Alps</strong><br />
The measuring stations at Radstadt, Arlberg and the Klammtunnel<br />
also count (tourism) transport across the <strong>Alps</strong>, though<br />
at alternative routes. For instance, the very distinct peak at the<br />
Radstadt measuring station emanates from traffic by-passing<br />
the Katschberg tunnel. Again, this is augmented by day-tourist<br />
traffic activities such as hiking, climbing or even driving.<br />
Furthermore the summer peaks on weekdays at the selected<br />
measuring stations and in the Tirol average indicate that mobility<br />
during the holiday is of higher importance for tourists in<br />
the summer season. They are more dependent on their car<br />
and use it more frequently to visit attractions, leisure facilities<br />
or for sightseeing.<br />
Main findings<br />
Status<br />
Traffic related to tourism and day tourism has a strong<br />
influence on traffic volumes within the <strong>Alps</strong>, in particular<br />
with respect to peak situations. Alpine roads suffer from<br />
high traffic volumes connected with the journeys to and<br />
from tourism destinations within and outside the <strong>Alps</strong> –<br />
both in winter and in summer.<br />
Trends<br />
The trend towards shorter but more frequent holidays can<br />
also be observed in the <strong>Alps</strong>. This implies a growth of<br />
individual motorised transport.<br />
The main tourism centres in the <strong>Alps</strong> are not solely<br />
dependent on the close vicinity of major transport infrastructures.<br />
On the contrary, some tourism centres are<br />
even situated in rather remote areas.<br />
Hot issue<br />
Measures need to be taken to increase the use of public<br />
transport for journeys to and from tourism destinations as<br />
well as in particular the use of public transport during the<br />
time spent at the holiday destination.<br />
Fig. B4‐6: Average daily traffic volumes (ADTV) of passenger transport in<br />
2004 at selected measuring points in Austria (weekdays and Saturdays).<br />
70
Chapter B – Driving Forces of Mobility and Transport<br />
Bibliography<br />
Alpine Conference (2006): Declaration on climate change.<br />
Document IX/07/1. http://www.bmu.de/files/pdfs/allgemein/<br />
application/pdf/deklaration_alpenkonferenz_klima.pdf<br />
(accessed: 20 March 2007)<br />
ARE – Bundesamt für Raumentwicklung, BFS – Bundesamt für<br />
Statistik (2001): Mobilität in der Schweiz, Ergebnisse des<br />
Mikrozensus 2000 zum Verkehrsverhalten. Bern, Neuenburg.<br />
ARE – Bundesamt für Raumentwicklung (2003): Alpen- und<br />
grenzquerender Personenverkehr 2001. A + GQPV 01,<br />
Schlussbericht, Bern.<br />
Bartaletti, F. (1998): Tourismus im Alpenraum – Eine alpenweite<br />
Bilanz. In: Praxis Geographie 2/1998. Westermann,<br />
Braunschweig.<br />
Bätzing, W. (2003): Die Alpen – Geschichte und Zukunft einer<br />
europäischen Kulturlandschaft. C. H. Beck, München.<br />
BMVIT – Bundesministerium für Verkehr, Innovation und Technologie<br />
(2002): Verkehr in Zahlen. Wien.<br />
DIW – Deutsches Institut für Wirtschaftsforschung &<br />
INFAS – Institut für angewandte Sozialwissenschaft<br />
Gmbh (2004): Mobilität in Deutschland – Ergebnisbericht.<br />
http://daten.clearingstelle-verkehr.de/196/10/mid2002_ergebnisbericht.pdf<br />
(accessed: 6 October 2006)<br />
EEA – European Environment Agency (2003): Europe’s Environment<br />
– The Third Assessment. Copenhagen.<br />
Elsasser, H., Bürki, R. (2005): Klimawandel und (Gletscher-)<br />
Tourismus. In: OEAV (ed.): Bedrohte Alpengletscher. Alpine<br />
Raumordnung H. 27, Innsbruck.<br />
IFO – Institut für Wirtschaftsforschung (2000): Verkehrsprognose<br />
Bayern 2015. Study conducted on behalf of the<br />
Bavarian Ministry of Economy, Transport and Technology<br />
(unpublished).<br />
Meier, R. (no date): Kurzfassung: Freizeitverkehr – Analysen<br />
und Strategien. Berichte des NFP 41 „Verkehr und Umwelt“, Bericht<br />
D5. http://www.nfp41.ch/download/moduld/d5-kf-dt.doc<br />
(accessed: 20 July 2006).<br />
Peeters, P. (2006): Tourismusbedingter Verkehr in Europa<br />
– Trends und Auswirkungen. In: Federal Ministry of Agriculture,<br />
Forestry, Environment and Water Management (BML-<br />
FUW), Federal Ministry of Transport, Innovation and Technology<br />
(BMVIT), Federal Ministry of Economy and Labour<br />
(BMWA) (eds.): Umweltfreundlich Reisen in Europa. Herausforderungen<br />
und Innovationen für Umwelt, Verkehr und Tourismus.<br />
Proceedings of the conference on environment friendly<br />
travelling, Vienna, 30.-31. January 2006. http://eco-travel.<br />
webwork.info/presse-downloads/Broschuere_deutsch.pdf<br />
(accessed: 29 September 2006).<br />
Pfefferkorn, W., Musović, Ž. (2003): REGALP (Regional Development<br />
and Cultural Landscape Change: the Example of<br />
the <strong>Alps</strong>). Work Package Report on Work package 2. Analysing<br />
the interrelation between regional development and cultural<br />
landscape change in the <strong>Alps</strong>, Vienna (unpublished).<br />
Rauh, W., Regener, K., Zellmann, P. (1998): Freizeitmobilität<br />
– Umweltverträgliche Angebote und Initiativen. Cit. in:<br />
Wessely, H., Güthler, A. (2004): Alpenpolitik in Deutschland<br />
– Anspruch und Realität. In: Bund Naturschutz Forschung<br />
Nr. 8, Nürnberg.<br />
Wrbka, T., Peterseil, J., Schmitzberger, I., Kiss, A. (2002): Alpine<br />
farming in Austria, for nature, culture or economic need?<br />
In: Jongman, R. H. G. (ed.) (2004): The New Dimensions<br />
of the European Landscapes. Proceedings of the Frontis<br />
workshop on the future of the European cultural landscape,<br />
Wageningen, 9.-12. June 2002. http://library.wur.nl/frontis/<br />
landscape/index.html (accessed: 20 July 2006).<br />
71
Chapter C – Effects of Transport and Mobility in the <strong>Alps</strong><br />
C<br />
Effects of Transport<br />
and Mobility in the<br />
<strong>Alps</strong><br />
The impacts of transport are manifold, and much has been<br />
written about them. <strong>How</strong>ever, when looking for figures and<br />
hard facts, and especially for data which allow for international<br />
and inter-regional generalisations and comparisons, it<br />
becomes difficult to draw a broad picture covering all dimensions<br />
of sustainable development. Nevertheless this report<br />
tries to stick to this ambition by deliberately selecting some<br />
representative aspects from the broad range of pertinent issues.<br />
Therefore, part C is not a comprehensive overview on<br />
all relevant impacts of transport.<br />
Accordingly, the structure of part C corresponds to the three<br />
main pillars of sustainable development: chapter C1 deals<br />
with the impact on the economy, chapter C2 with the social<br />
impacts and chapter C3 with some selected environmental<br />
and health issues.<br />
While starting from the impacts of transport on the economy<br />
providing evidence on positive and negative effects despite<br />
the difficulties of quantification in this field, part C1 is inevitably<br />
confronted with the feedback of the economy on transport:<br />
the challenging question of how transport growth and<br />
economic growth are linked or can somehow be separated is<br />
a central issue which has also been touched on in previous<br />
parts of the report. The end of the chapter deals with the concept<br />
of external costs and economic instruments in transport<br />
policy based on this approach.<br />
The impacts of transport are manifold, they affect economic, social and<br />
environmental issues (Photo: S. Marzelli).<br />
Overall, this part of the report devoted to the effects of<br />
transport shows again the necessity for a specific Alpine<br />
approach to the issue and makes the case that transport<br />
policy needs to be integrated into a comprehensive development<br />
approach. In this spirit it is also essential to see the<br />
Alpine transport system in a larger European context – an<br />
important aspect which has been dealt with in more detail in<br />
previous chapters.<br />
Chapter C2 deliberately focuses on the issues of accessibility<br />
and social equity and on the ageing of the population. It<br />
shows how strongly transport needs to be considered as an<br />
element of a complex system ensuring the provision of essential<br />
services to the population: transport is essential for<br />
access to services, but more transport is not the solution to<br />
all accessibility problems – other measures need to be considered<br />
too.<br />
Chapter C3, finally, deals with the issues which have raised<br />
the most controversial debates on transport in the <strong>Alps</strong>: the<br />
environmental and health effects. <strong>How</strong>ever, in order to give a<br />
valuable insight into specifically Alpine problems, here it focuses<br />
on the two most sensitive issues: air quality and noise.<br />
In both cases the specific Alpine topography, where important<br />
transport corridors are located at the bottom of densely<br />
populated and rather deep, long valleys, leads to conditions<br />
in which transport causes much more severe impacts than<br />
elsewhere.<br />
73
Report on the State of the <strong>Alps</strong><br />
C1<br />
Economic Effects<br />
All economic activity requires a certain amount of transport.<br />
This is why the demand for transport is seen as<br />
a derived demand both in the case of passenger and<br />
freight. According to economic and behavioural theories<br />
people wish to travel so that some benefit can be<br />
obtained at the final destination. The trip itself is to be as<br />
short as possible (Button 2003).<br />
Transport has always played a strategic role in the economic<br />
development of spatial entities. Easy access<br />
and proximity to main transport infrastructure such as<br />
roads, rivers and seaports has for ages given rise to important<br />
and commercially successful cities (Blauwens<br />
et al. 2002). This is true for the main Alpine centres too,<br />
which can be found in the most accessible valleys and<br />
in the Alpine foothills. <strong>How</strong>ever in some Alpine locations<br />
accessibility per se is not a sufficient condition for good<br />
economic performance.<br />
This chapter introduces the role of transport and mobility<br />
in view of a growing trade volume within and across<br />
the Alpine Space. The positive, supporting effects of<br />
transport and mobility for economy and development<br />
are addressed as well as the adverse effects of transport.<br />
Therefore the main question of the interrelation of<br />
transport and economic growth is considered and consequently<br />
questions on the internalisation of external<br />
transport costs are raised.<br />
C1.1 Trends of inter-regional trade<br />
in the Alpine space<br />
In the Alpine space – as already shown in chapter A2 and<br />
confirmed by EU data – a high level of international and inter-regional<br />
trade has been registered in recent years and is<br />
expected to continue to rise in the future.<br />
It is estimated that the volume of goods transported overland<br />
will increase by 70% between now and 2020 in the EU-15<br />
and by up to 95% in the ten new Member States (European<br />
Commission DG TREN 2004).<br />
For the Alpine area, the trend is confirmed: Between 1994<br />
and 2004 road transport increased by 300% while rail transport<br />
increased by 25%. Provided that no substantial changes<br />
take place in business and technology, the OECD has estimated<br />
a growth in freight transport of 76% between 1990 and<br />
2030, of which the trans-Alpine traffic alone would increase<br />
by almost 3 times. Passenger traffic too would grow by 76%,<br />
of which the trans-Alpine traffic alone would rise by 2.4 times.<br />
Roads would capture more than 90% of the passenger-traffic<br />
increase, and nearly 80% of the freight-traffic increase. One<br />
of the main reasons for such a growth is the central geographical<br />
position of the <strong>Alps</strong> with respect to Mediterranean<br />
and Central European trade (OECD 2001).<br />
For the case of road transport, Tab. C1-1 shows the main<br />
origin and destination centres in the Alpine space and their<br />
GDP, where a higher level of trade and transport can be<br />
found. These regions can be considered to host the main<br />
Alpine interregional markets.<br />
Region<br />
(NUTS-2)<br />
Originated<br />
road<br />
vehicles/<br />
year<br />
Road<br />
Vehicles<br />
per year<br />
attracted<br />
GDP in<br />
EUR per<br />
capita<br />
2002<br />
Development<br />
of<br />
GDP in<br />
EUR per<br />
capita<br />
1998–<br />
2002 [%]<br />
Steiermark 854,000 926,000 22,913 15.2<br />
Lombardia 851,000 925,000 28,691 16.4<br />
Veneto 450,000 396,000 24,945 15.7<br />
Piemonte 433,000 417,000 25,230 14.8<br />
Niederösterreich<br />
379,000 350,000 21,759 11.6<br />
Oberösterreich<br />
269,000 249,000 25,230 14.8<br />
Kärnten 236,000 221,000 22,359 12.9<br />
Provence-<br />
Alpes-Côte 220,000 188,000 22,858 17.7<br />
d‘Azur<br />
Tirol 204,000 190,000 27,735 16.2<br />
Rhône-Alpes 204,000 210,000 25,194 13.6<br />
Oberbayern 190,000 175,000 37,141 12.3<br />
Tab. C1-1: Main Alpine origins and destinations for road transport of<br />
freight and GDP (Source: CAFT 2004, analysis BMVIT; ESPON 2003).<br />
Aggregated data for the whole Alpine space result in an average<br />
per capita GDP of € 22,859 and an economic growth of<br />
15.1% between 1995 and 2003 (MARS 2005); these values<br />
are in line with the reported data.<br />
C1.2 Effects of transport enhancing<br />
development and economy<br />
In modern economies effective transport systems have often<br />
been a catalyst in extending local markets, connecting separate<br />
regions and fostering market openness. They shifted a<br />
variety of goods and services to places where they were neither<br />
produced nor available before. Therefore, transport can<br />
bring economic advantages to consumers, who can reach<br />
more goods and services at lower prices.<br />
Good accessibility, efficient transport infrastructures and<br />
modern mobility concepts can induce employment and<br />
consumer wellbeing (and GDP) convergence (AlpenCorS<br />
2005).<br />
Despite uncertainty about their specific effects, infrastructures<br />
have often been used to foster local employment, enhance<br />
regional development and encourage local industry in<br />
certain areas (Blauwens et al. 2002). The decision to create<br />
an infrastructure results in both direct and indirect effects.<br />
• A direct effect on GDP can be measured in terms of increased<br />
employment rate (see PAN-EUROSTAR 2003<br />
and box on the Torino-Lyon and Gotthard tunnels below)<br />
and convergence in economic growth (AlpenCorS<br />
2005).<br />
• Indirect effects of infrastructures are on the other hand<br />
mainly linked to their use. They can reduce journey times<br />
and bring about a reduction in transport costs, sometimes<br />
resulting in consequences in the fields of consumption,<br />
movement of people and income distribution (Quinet &<br />
Vickermann 2004).<br />
74
Chapter C – Effects of Transport and Mobility in the <strong>Alps</strong><br />
C1.2.1 Transport infrastructure effects<br />
When a new infrastructure is planned some regions are usually<br />
advantaged, whereas others may be disadvantaged.<br />
Within the framework of a redistribution of economic activities<br />
in an inter-regional perspective (where some regions specialise<br />
in certain production), the presence of efficient transport<br />
infrastructures can lead to sector specialisation and relocation<br />
of firms in the long run (Armstrong & Taylor 2000).<br />
As an example of large infrastructure investments the main<br />
ongoing and projected Alpine tunnel projects and their respective<br />
costs are listed below (cp. Tab. C1-2).<br />
Investments in the main<br />
Alpine tunnels<br />
Lyon-St.Jean de Maurienne<br />
(Source: LTF)<br />
Gotthard tunnel<br />
(Source: Alptransit)<br />
Brenner Tunnel<br />
(Source: BBT SE)<br />
Lötschberg tunnel<br />
(Source: BLS Alptransit)<br />
Tunnel length<br />
[km]<br />
EUR<br />
65* 6.7 billion<br />
57 5.1 billion<br />
55 4.5 billion<br />
34.4 2.1 billion<br />
Tab. C1-2: List of main Alpine tunnel projects and costs<br />
(the amounts reported for the Gotthard and Lötschberg tunnels<br />
correspond to 8.035 and 3.22 billions CHF approximately).<br />
*St. Jean de Maurienne – Venaus: 53 km, Bussoleno: 12 km.<br />
Case study: Torino-Lyon and Gotthard tunnel employment<br />
effects<br />
The employment generated during the construction period<br />
of the French-Italian common section has been calculated<br />
by the Committee for the Liaison Européenne<br />
LyonTurin (LTF).<br />
Once construction has started on both the basis tunnel<br />
and the Bussoleno tunnel, the employment of nearly<br />
3,500 workforce is envisaged.<br />
At the peak of the total activity on the construction of the<br />
new Lyon-Turin link, between 6,200 and 6,500 people will<br />
be recruited on the French side (including approximately<br />
4,000 people for the sites depending on the Réseau Ferré<br />
de France).<br />
For the Italian section whose owner is RFI, nearly 1,500<br />
people should be recruited by the trans-Alpine sites at the<br />
peak of the activity.<br />
Until now, during all the phases of the Gotthard tunnel<br />
construction nearly 2,250 people have been recruited.<br />
When evaluating the construction-related employment<br />
effects of these infrastructure projects, one has to bear in<br />
mind that only a small proportion of labour is recruited at<br />
a regional level and thus effects on regional employment<br />
are rather small. Furthermore, the working conditions of<br />
these tunnel projects are difficult and hazardous.<br />
Sources: LTF 2006, ALPTRANSIT (n. d.)<br />
Cost reduction due to better transport infrastructure<br />
The reduction of the cost of transport leads to reduced production<br />
costs and to a modification in the level of output<br />
within a certain region. This cost reduction can also lead to<br />
an improvement in inter-regional trade: on the one hand because<br />
reduced transport costs make it easier to export, on<br />
the other because the rise in output leads to an improvement<br />
in the availability of exportable goods (Anderson & Wincoop<br />
2004, Kopp 2006).<br />
In a free market this would lead to lower prices and to an<br />
advantage for the consumers. The difference in prices in the<br />
two regions should be equal to the price of transport (Quinet<br />
& Vickerman 2004). The existence of several transport subsidies<br />
in the Alpine countries, together with the decreasing<br />
share of transport costs in pricing, however, tends to reduce<br />
the benefits deriving from a reduction of transport costs for<br />
inter-regional trade.<br />
Spatial dimension of economic effects<br />
The distributional effects of a reduction in transport costs –<br />
that is, how a cost reduction influences the allocation of economic<br />
advantages among the parties living within a specific<br />
region – due to improved infrastructure are often not taken<br />
into consideration by policy makers.<br />
Different consequences can derive from such a cost reduction<br />
and relative advantages can affect different parties such<br />
as enterprises, consumers or employees. Enterprises can<br />
profit from increasing revenues if the reduction does not result<br />
in lower prices. Consumers can benefit from lower market<br />
prices and larger supply of goods available on the local<br />
market. Employees can get either higher or lower wages,<br />
because of the increased labour force competition induced<br />
by higher accessibility standards (potentially leading to a<br />
wider supply of labour force and to lower wages) and the<br />
reduced distance-related costs they incur which can result in<br />
lower transport costs for employees living out of the region.<br />
Additionally, it must be kept in mind that transport costs are<br />
continuously becoming less significant in overall price calculations.<br />
All of these aspects and the complexity of assessing the<br />
whole effect of an infrastructure on the Alpine space have<br />
to be carefully considered. There is a common tendency to<br />
underestimate the scope of the economic effects of an infrastructure.<br />
It is essential to keep in mind that inter-regional trade through<br />
the Alpine space induces economic consequences beyond<br />
the Alpine region. Often outer regions can attain even higher<br />
economic advantages from good transport infrastructure and<br />
services than those in close proximity to the Alpine area. This<br />
happens because outer and formerly isolated regions can<br />
gain substantial marginal advantages from reduced transport<br />
and time costs connected to an infrastructure, even though it<br />
is situated relatively far from them.<br />
This consequence can also be drawn from the consideration<br />
of the extra-European array of the TEN corridors, which<br />
– from an economic point of view – is much larger than it<br />
could seem if only the physical networks are considered (see<br />
Chapter B2).<br />
75
Report on the State of the <strong>Alps</strong><br />
Case study: Effects of infrastructure investments on<br />
spatial planning and regional economy (Switzerland)<br />
It is questioned if transport infrastructures induce local<br />
development or merely help to accommodate a situation<br />
that would have occurred anyway. Regions that already<br />
have a relatively good traffic infrastructure seem to gain<br />
limited marginal advantages from the construction of new<br />
infrastructure.<br />
This is why higher effects on GDP are usually found<br />
where the infrastructure system is in an early development<br />
stage (Rietveld & Nijkamp 2001). A large increase<br />
in accessibility in mountain regions sometimes translates<br />
into only small changes in economic activities (MONT-<br />
ESPON 2006).<br />
These findings are confirmed by a study launched by the<br />
Swiss Federal Office for Spatial Development (ARE) in<br />
2003 (ARE 2007). In four case-studies (three of them<br />
dealt with infrastructure-investments in mountainous regions)<br />
the spatial and economic effects of new transport<br />
infrastructure investments have been investigated. The<br />
three case studies focused on the territorial effects of<br />
transport infrastructures on the Alpine territory (Vereina<br />
tunnel; Vue-des-<strong>Alps</strong> tunnel; transport infrastructure in<br />
“Piano di Magadino”).<br />
One of the outcomes of the study was indeed that the<br />
economical effects of these investments cannot be easily<br />
isolated, as locational processes are slow and influenced<br />
by a multitude of constantly changing parameters.<br />
According to the study, infrastructure projects have the<br />
potential to accelerate or slow down ongoing spatial processes,<br />
but they rarely contribute to a turnaround of spatial<br />
development. Furthermore, new Alpine infrastructures<br />
are often embedded in an already existing dense transport<br />
network and therefore often create redundancies in<br />
the system. In a country with a less dense transport network<br />
the outcome might have been different.<br />
C1.2.2 Effects of improved mobility on<br />
Alpine living standards<br />
Good transport services seem to play a substantial role in<br />
determining the endogenous path of growth of a region (Quinet<br />
& Vickermann 2004). In addition to the Keynesian approach<br />
that was already experimented with in the pioneering<br />
railway developments since the 19 th century, with the clear<br />
intention of fostering local employment and shortening the<br />
distance from peripheral regions to locations where trade<br />
took place, some other more substantial effects have also<br />
been recognised.<br />
It has been argued that transport has a “public good” aspect<br />
and is able to produce not only negative (which will be discussed<br />
later), but also positive externalities. In economics<br />
an externality is the effect of a transaction between two parties<br />
on a third party who is not involved in carrying out that<br />
transaction. The production of a public good has beneficial<br />
externalities for all, or almost all, of the public. In this case,<br />
externalities produced by transport are not directly related<br />
to transport structure and can often take the shape of social<br />
and relational advantages. Then easier access to the market<br />
is often ensured by well developed transport networks (such<br />
as railway and road systems).<br />
Improved accessibility standards permit a change in economic<br />
activities, usually improve the land value and open<br />
the Alpine space to new entrepreneurial initiatives that can<br />
create an economic surplus and improve the local employment<br />
(even though sometimes local wages can suffer a<br />
decrease).<br />
Below, some changes in economic and social life are listed.<br />
They are often linked to improvements in transport effectiveness<br />
within a framework that is called “death of distance”<br />
(Rietveld & Vickerman 2004) and can bring new opportunities<br />
for spatial development:<br />
• Development of interregional and international trade, allowing<br />
more materials to be obtained at a lower cost,<br />
• relocation of firms and consumers,<br />
• better matching of needs with means of satisfying them,<br />
• identification of possible new sources of supply for local<br />
enterprises,<br />
• market enlargement and trade globalisation,<br />
• possible growth of employment rate (in the short or in the<br />
long term), and<br />
• increase in tourism, leisure and business trips.<br />
Generally, positive tourism and commercial development<br />
can be related to sufficient levels of accessibility, which thus<br />
becomes a factor of local development.<br />
In this respect, a balanced and functional economic network<br />
with substantial effects on the local economy has been developing.<br />
Evidence of this is given by the diffusion of relatively<br />
recent new businesses in the manufacturing and high-tech<br />
service industries, which add to those already well established<br />
in other more traditional sectors (e.g. timber, food,<br />
hand-made products, hydro-power etc.).<br />
C1.3 Adverse economic effects<br />
Some negative effects can result from transport development<br />
both on the economy and on the sensitive Alpine environment,<br />
which is suffering from the ever-increasing impact<br />
of freight and passenger transport (EEA 2006).<br />
Conversely, adverse effects can result from improved means<br />
of accessibility to peripheral or economically weaker Alpine<br />
regions, which may lose markets due to the increased competition<br />
generated by new infrastructures. Intensified global<br />
trade has led to local losses in businesses that face particular<br />
competition in the globally integrated market. Within<br />
the Alpine territory this could lead to the market exclusion<br />
of traditional firms and less competitive enterprises. Even<br />
though this situation can bring a possible advantage for<br />
other competitors, local shops and small shopping centres<br />
may be forced to close, reducing the supply of local goods<br />
in smaller Alpine centres. Furthermore, the concentration of<br />
76
Chapter C – Effects of Transport and Mobility in the <strong>Alps</strong><br />
suppliers is reducing options for the less mobile sectors of<br />
the population.<br />
Traffic infrastructures tend to increase traffic flows and produce<br />
growing external costs, especially in terms of environmental<br />
degradation (e.g. noise, air pollution) and other aspects<br />
such as urbanisation and spatial planning, safety and<br />
financing.<br />
These costs are often not fully considered when investments<br />
in transport infrastructures are made and most national<br />
accountings do not recognise them. Alternative investment<br />
choices remain possible and can lead to similar or even better<br />
economic effects in the region, since transport policy has<br />
its own specific features and should not be considered as<br />
a substitute for a sound economic policy (Blauwens et al.<br />
2002).<br />
Transport infrastructures can also produce a multitude of<br />
diverse effects on local development within the respective<br />
territories, which in their complexity and inconsistency are<br />
sometimes difficult to assess for the local population. Therefore<br />
the consideration of the local effects of infrastructural<br />
projects is becoming a priority in the <strong>Alps</strong>. Promoting public<br />
consultations and involving local stakeholders when new infrastructures<br />
have to be built can help in finding socially acceptable<br />
options at local level (Dematteis & Governa 2002).<br />
C1.4 Transport and development in<br />
the <strong>Alps</strong>: towards the<br />
identification of a trend for the<br />
Alpine countries?<br />
According to recent studies, there is a link between the availability<br />
of transport services within a region and its social and<br />
economic development (Button 2003). This relation is supposed<br />
to work in two directions: on the one hand, transport<br />
demand grows according to the economic development of a<br />
region; on the other hand transport services and infrastructure<br />
improvements can induce economic development, especially<br />
in the long term (Quinet & Vickermann 2004).<br />
One of the hot issues of discussions on the effects of transport<br />
is that indications exist which display a close relationship<br />
between transport and economic growth, while at the same<br />
time a correlation between transport and economic growth<br />
cannot be established in other regions (Zambrini 2005).<br />
C1.4.1 Close relation between economic<br />
and transport growth<br />
A direct relationship between mobility and economic growth<br />
(usually expressed by GDP) has been identified in the European<br />
countries (Button 2003): a higher development of the<br />
transport system accompanies higher levels of economic<br />
wellbeing. This same relationship can also be found, at national<br />
level, in the countries participating in the Alpine Convention<br />
that are among the richest in the EU (EUROSTAT<br />
2005; OECD 2006). An internal comparison among Alpine<br />
countries shows a stable economic situation in the region.<br />
National GDP levels are quite high (OECD 2006) and infrastructure<br />
development in physical terms has been limited in<br />
the last few years. In most developed European countries<br />
(including the Alpine ones) the strongest infrastructure development<br />
was mainly concentrated in the 1960s and 1970s<br />
(Button 2003).<br />
A further clarification can be added with reference to the relationship<br />
between transport and economic growth. Economic<br />
growth is positively affected by substantial improvements in<br />
transport infrastructures when the general infrastructure provision<br />
is rather poor. In contrast, this relationship is generally<br />
weaker when transport networks are well established.<br />
Sometimes infrastructure endowment and GDP does not<br />
show a strong correlation. Other factors including land prices,<br />
availability of labour and employment opportunities, the<br />
transport intensity of the local economy and the intensity of<br />
competition on the local economy can equally have substantial<br />
effects on regional economic development (Zambrini<br />
2005).<br />
Furthermore, transit traffic usually depends on the economic<br />
growth of neighbouring regions rather than on local development<br />
of the transited area.<br />
In the period from 1995 to 2002, the volume of freight and<br />
passenger transport and the economy have both been growing<br />
(DG TREN 2004). Since 1995, the growth in transport<br />
volumes in Europe as a whole has almost paralleled growth<br />
in GDP (EEA 2006). Specifically, freight traffic has grown at<br />
a faster rate (+34%) between 1995 and 2004, compared with<br />
GDP growth over the same period (+26%). Heavy goods<br />
traffic has grown at a slightly slower rate.<br />
On the other hand passenger transport seems to have<br />
grown less substantially in EU countries (+30%) and in the<br />
Alpine area. In passenger transport, a partial decoupling was<br />
achieved between 1996 and 2002 (EEA 2006). In the following<br />
figure, the development of passenger and road transport<br />
is compared to GDP growth in the EU (see Fig. C1-1).<br />
It is important to focus on the recent substantial growth of<br />
freight and passenger transport as well as of GDP between<br />
2003 and 2004, which can only be partially related to some<br />
methodological changes in data collection.<br />
77
Report on the State of the <strong>Alps</strong><br />
Effects of fuel prices on transport volumes<br />
It can be useful, for example, to consider how transport<br />
demand is affected by changes in fuel price. Examining<br />
this change can be useful for assessing the possible effects<br />
of a higher fuel price on the choice of passenger<br />
transport modes, or evaluating the modifications induced<br />
in road transport when a fuel charge is introduced. One<br />
way of defining elasticity is as the proportional change in<br />
one variable relative to the proportional change in another<br />
variable. Thus it is a measure of relative changes.<br />
GDP at<br />
constant<br />
prices<br />
Passenger<br />
transport-<br />
Pkm<br />
Freight<br />
transport<br />
Tkm<br />
1995- 2005<br />
p.a.<br />
1995- 2004<br />
p.a.<br />
1995- 2005<br />
p.a.<br />
2.3% 2004–2005 1.7%<br />
1.8% 2003–2004 1.8%<br />
2.8% 2004–2005 2.2%<br />
The figure below (Fig. C1-2) shows the results of a study<br />
of elasticity of transport demand in relation to fuel prices.<br />
Fig. C1-1: Transport growth in EU-25 with respect to passengers,<br />
goods and GDP (Source: Statistical pocketbook 2006 (http://ec.europa.<br />
eu/dgs/energy_transport/figures/pocketbook/2006_en.htm)<br />
The situation described above is common to most European<br />
countries and is considered to be a natural consequence of<br />
the establishment of the EU internal market (EEA 2007). In<br />
the EU more goods are transported over longer distances<br />
and more often than ever. As the data reported confirm, no<br />
clear signs of separating freight transport volumes from GDP<br />
have been shown until now and passenger transport volume<br />
has been growing in most EU countries (EEA 2006).<br />
C1.4.2 Decoupling economic and transport<br />
growth<br />
<strong>How</strong>ever, since a lot of different components participate<br />
together in the determination of GDP, it is not possible to<br />
establish a precise causality relation between these two variables.<br />
Separating transport volume from economic growth is considered<br />
to be a primary method of limiting or reducing the<br />
environmental and health impacts and other side-effects of<br />
transport. The goal to achieve is a separation of mobility from<br />
all its side-effects, according to the EU and other international<br />
organisations such as OECD. To this end, special attention<br />
is paid to the issue of the internalisation of external<br />
costs of transport and the reduction of transport subsidies<br />
(EEA 2007).<br />
Pricing is a method of addressing transport volumes. For<br />
instance, price elasticities show that transport volumes<br />
respond to changes in fuel prices.<br />
Fig. C1-2: Elasticity of transport demand with respect to fuel price<br />
(Source: EEA 2006).<br />
For example, a 1% increase in fuel prices is responsible<br />
for a 0.1% short-term decrease in terms of vehicle-km.<br />
The long-term decrease is higher, namely 0.3 % per single<br />
vehicle or 0.29 % in total. With a constant or declining<br />
occupancy rate, the transport volume in terms of passenger-km<br />
decreases at the same rate or faster, respectively.<br />
This means that the transport volume from 1990 to 2002,<br />
as depicted in the figure above (with the development of<br />
fuel prices), would have grown even faster if fuel prices<br />
had stayed at a constant level.<br />
Economic growth and transport in the <strong>Alps</strong><br />
The trends discussed above have changed substantially<br />
over the last 30 to 40 years. Models and studies developed<br />
over a long period of time suggest that in the 1960s – for<br />
example – the relationship appeared to be stronger and that<br />
transport demand would have grown disproportionately with<br />
respect to regional GDP, as happens today in most developing<br />
countries (Quinet & Vickerman 2004).<br />
Since this general trend is confirmed also within the Alpine<br />
Space, according to the available data at EU level, a growth<br />
in the demand for transport services and infrastructure is also<br />
likely to occur in the Alpine territory, especially if an adequate<br />
quality of transport services is ensured.<br />
In any case, it is questionable whether the issue of new<br />
transport infrastructure construction in the <strong>Alps</strong> is crucial for<br />
regional economic growth. As already mentioned, the reasons<br />
for building new infrastructures in the <strong>Alps</strong> cannot be<br />
strictly economic. But rationales may also consider other so-<br />
78
Chapter C – Effects of Transport and Mobility in the <strong>Alps</strong><br />
cial and ecological benefits that can be stimulated by transport<br />
in the Alpine region – and that should also be assessed<br />
in economic terms (see discussions of external costs below).<br />
For instance, improvements in short-range mobility can have<br />
an effect on local social networks, and new rail networks,<br />
accompanied by sound transport policies, can help to reduce<br />
the use of motor vehicles in the Alpine area, by improving<br />
both freight and passenger transport by rail.<br />
C1.5 External costs of transport<br />
from an economic perspective<br />
C1.5.1 A complex definition<br />
The issue of the external costs of transport, particularly those<br />
of road freight transport, is increasingly being discussed in<br />
the Alpine region, both in regard to their environmental impact<br />
and to their direct economic costs (e.g. infrastructure<br />
investments, insurance, etc.), not usually recognised by national<br />
accounting. Detailed information about transport costs<br />
is essential both for micro-economic and private decisions<br />
and for macro-economic policy choices.<br />
Different types of costs are usually considered to make up<br />
the structure of transport costs. The main cost categories<br />
considered are internal and external costs (cp. Fig. C1-3),<br />
where the former include infrastructure and private costs and<br />
the latter environmental and social costs and costs related to<br />
congestion, accidents and land use (Greene et al. 1997).<br />
Some of the typical transport costs that should be covered by<br />
users are land use (e.g. purchase and development of land),<br />
infrastructure supply (e.g. construction and maintenance<br />
costs of the infrastructure) and possibly external costs borne<br />
by the population and public authorities (e.g. environmental<br />
and congestion costs).<br />
This is an extremely sensitive subject, particularly in those<br />
Alpine countries which have a very high rate of through traffic<br />
(for example Switzerland, Austria and Italy).<br />
When trying to assess the costs of the transport system in<br />
the Alpine region, it is essential to work both on macro- and<br />
micro-level. Firstly, macro cost categories are defined, which<br />
then have to be split into micro sub-categories, as illustrated<br />
in Fig. C1-3 above. In this context, among others, the following<br />
costs in particular have to be taken into account:<br />
• Investment and management costs of the system, including<br />
in this macro-category costs relating to labour force<br />
employed and logistic costs (such as handling, inventory,<br />
stock-out and other costs),<br />
• external costs, including the impact on the environment<br />
and human health, as well as accident costs, and<br />
• time costs, including also the cost of congestion in terms<br />
of longer travel time.<br />
For each of the costs reported in Fig. C1-3 an indicator has<br />
to be set and agreed among stakeholders (policy, research,<br />
enterprises and other user groups, resident population). A<br />
balance with resulting benefits (for example in terms of timesavings<br />
and better accessibility) has then to be made.<br />
Moreover, to define other specifically Alpine cost categories,<br />
it is necessary to promote a review of the methods used in<br />
different countries to assess transport externalities and the<br />
tariffs currently applied, with the aim of defining the parameters<br />
to be used in order to determine the “true costs”, as<br />
provided by Article 14 of the Transport Protocol of the Alpine<br />
Convention.<br />
Fig. C1-3: Components of transport costs (elaboration on Greene et al.<br />
1997).<br />
The most interesting components of transport costs for the<br />
Alpine region are external and infrastructure costs. Measures<br />
must be taken to internalise external costs and to compensate<br />
for rising infrastructure costs especially by means<br />
of tolls, which are widely borne by public authorities (both at<br />
the national and EU level) but can lead to substantial advantages<br />
for private trade and interests.<br />
Strategy for response and use of economic instruments<br />
Concerning the external costs – more precisely the environmental<br />
costs of transport – it is important to remember that<br />
there are different methods of assessing them, and an agreement<br />
on these is far from being reached among experts. To<br />
attempt an evaluation of these costs is rather complex and<br />
delicate. The benefits generated by mobility and transport<br />
activities for the Alpine economy have also to be considered.<br />
Comprehensive studies have been developed both at national<br />
and at EU level, the results of which are presented in<br />
Figures C1-4 and C1-5 at the next page (EEA 2006).<br />
79
Report on the State of the <strong>Alps</strong><br />
Fig. C1-4: Composition of external costs of transport in EU-15 plus Norway<br />
and Switzerland by transport mode (Elaboration on INFRAS 2004).<br />
According to these studies, transport imposes significant<br />
costs on society. In the EU-15 plus Norway and Switzerland<br />
(EU15+2), external costs from transport were estimated at<br />
7.3% of GDP in 2000, which is almost 650 billion EUR (IN-<br />
FRAS/IWW 2004). Car use causes the largest share of external<br />
costs (44%), followed by heavy-duty vehicles (25%).<br />
Road transport as a whole accounts for 83% of external costs<br />
while the share of rail and water transport is very small.<br />
Fig. C1-5: Composition of external costs of transport in EU-15 plus Norway<br />
and Switzerland by cost category (Elaboration on INFRAS 2004).<br />
The cost-categories considered in the Swiss study include<br />
accidents (medical care, costs of lost opportunities to society,<br />
suffering and grief), noise (damage to human health),<br />
air pollution (human health, material damage, biosphere),<br />
climate change (damage from global warming), nature and<br />
landscape (damage reparation, compensation), urban effects<br />
(time loss, land take), upstream processes (additional<br />
environmental costs including risk) (EEA 2001).<br />
The results of some interesting analyses developed at<br />
national level in some Alpine countries are given in the table<br />
below (Tab. C1-3).<br />
EC WHITE FRENCH MINISTRY<br />
INFRAS<br />
AMICI DELLA TERRA<br />
PAPER min<br />
max<br />
cent EUR/t*km EUR/veic*km cent EUR/t*km EUR/veic*km EUR/veic*km EUR/veic*km EUR/veic*km<br />
Incidentality 0.68 0.04 0.4 0.02 0.01 0.02 0.04<br />
Noise 0.51 0.03 1.47 0.08 0.02 0 0.05<br />
Air pollution 3.1 0.17 4.94 0.27 0.09 0.01 0.28<br />
Greenhouse emissions 1.5 0.08 0.78 0.04 0.01 0.03 0.04<br />
Nature and landscape 0.22 0.01<br />
Urban effects 0.13 0.01<br />
No direct costs 0.87 0.05<br />
Congestion 0.78 0.04 0.06 0 0.23<br />
Infrastructure 0.03 0.03 0.04<br />
totAL 7.01 0.39 8.37 0.46 0.22 0.08 0.65<br />
Tab. C1-3: External costs of freight transport evaluated on the basis of main European studies (Source: MATT 2005).<br />
The marginal external costs – which form the best basis<br />
for the establishment of internalisation instruments and represent<br />
the incidence of a certain mode of transport on the<br />
environment – vary considerably between and within transport<br />
modes. They also depend heavily on the type of vehicle,<br />
<br />
Marginal external costs (MEC) are the change in the cost to parties other than the<br />
producer or buyer of a good or service due to the production of an additional unit of<br />
the good or service. Environmental pollution is an example of external costs and can<br />
be assessed in marginal terms. (For example, suppose it costs the producer €50 to<br />
transport another unit of a good. Suppose this movement results in pollution which<br />
causes €60 worth of damage to the public. The marginal external cost is €60).<br />
the fuel used, and on the specific traffic situation. Hence,<br />
when defining transport price, flexible pricing instruments<br />
are needed to internalise such costs effectively. Eventually, a<br />
pricing policy should result in an optimal transport provision<br />
in a competitive system which should incorporate all aspects<br />
of sustainable development.<br />
There is a common need to address the serious challenge<br />
of growing external costs in the Alpine area with appropriate<br />
measures. This appears also from the EU charging policy<br />
known as Eurovignette.<br />
80
Chapter C – Effects of Transport and Mobility in the <strong>Alps</strong><br />
Some of the main problems generated by the transport<br />
activities in the Alpine area are the following:<br />
• Economic inefficiencies, including increasing transport<br />
costs and transport networks unable to cope with<br />
the growing logistic requirements and mobility needs in<br />
relation to commercial competitiveness,<br />
• increasing congestion problems in the whole Alpine region,<br />
mainly in urban areas during the summer period,<br />
• a large number of traffic accidents and related high general<br />
health and social costs,<br />
• increasing environmental damage and growing energy<br />
consumption, and<br />
• imbalances and inefficiencies of territorial and urban<br />
planning reinforced by the current transport network.<br />
In order to address the negative effects on the Alpine economy<br />
caused by increasing mobility, the EU is pushing Member<br />
States to adopt measures promoting environmentally friendly<br />
means of transport, a more balanced use of transport infrastructures<br />
and specific incentives to reduce their environmental<br />
and socio-cultural impact.<br />
Main findings<br />
Status<br />
The transport system can play a substantial role in supporting<br />
local development in less accessible areas. The<br />
economic effects of transport in the Alpine region remain<br />
complex to assess accurately, since economic advantages<br />
can add to adverse economic effects.<br />
In general, new transport infrastructures in Central<br />
Europe are only one of a multitude of factors influencing<br />
regional development and have only limited effects on<br />
economic development in the <strong>Alps</strong>.<br />
From an economic point of view, transport is considered<br />
as a public good, producing both positive and negative<br />
externalities in terms of improved accessibility, development<br />
of inter-regional trade, development of local markets<br />
but also increasing environmental (ecosystem,<br />
energy, noise, pollution) and functional costs (congestion,<br />
accidents, land use).<br />
Trends<br />
A steady growth of trade within the EU common market is<br />
predicted which will affect and intensify traffic within and<br />
across the <strong>Alps</strong>.<br />
The construction of new infrastructure can have positive<br />
effects on local employment and market enlargement,<br />
and can help to foster competition and regional sectoral<br />
specialisation. On the other hand it can also expose<br />
less competitive and traditional firms and areas to global<br />
market forces and lead to complex structural changes in<br />
regional economies. Furthermore, an improved transport<br />
infrastructure leads to polarising effects on shopping facilities<br />
and consumption between central and peripheral<br />
Alpine regions, which often reduces local daily supply options<br />
for the latter. Some of the effects deriving from new<br />
infrastructure in the Alpine area go far beyond the scope<br />
of the Alpine region and have to be considered on a European<br />
scale.<br />
Hot issues<br />
Some of the Alpine countries are among the richest in<br />
the world and their general economic situation can be defined<br />
as stable. In this context until now no decoupling<br />
between economic and traffic growth has been achieved<br />
and a considerable future traffic growth is expected for<br />
Europe and especially the <strong>Alps</strong>. No clear correlation between<br />
regional added value and transport infrastructure<br />
can be established for the Alpine region. While improved<br />
transport infrastructure may enhance regional development,<br />
several other factors are equally steering economic<br />
development.<br />
The issue of internalisation of external costs is very complex.<br />
As well as negative external effects, such as environmental<br />
degradation, noise pollution, building damages<br />
and insurance costs, beneficial external effects such as<br />
social interaction and time savings need to be taken into<br />
consideration.<br />
Even though the assessment of external costs of transport<br />
in the <strong>Alps</strong> remains a complex task, some efforts<br />
in this direction have been made in the Alpine countries<br />
and at European level. On the other hand, economic instruments<br />
are increasingly adopted in the framework of<br />
national transport policies in the Alpine countries. At European<br />
level the recently updated Eurovignette Directive<br />
(Directive 2006/38/EC) addresses the problem of external<br />
costs and of harmonising charges for heavy vehicles<br />
using the road network. It draws attention to the need to<br />
find a common methodology to assess external costs of<br />
road freight transport in accordance with the Transport<br />
Protocol of the Alpine Convention.<br />
Bibliography<br />
AlpenCorS (2005): Guidelines for an efficient policy of Corridor<br />
V – AlpenCorS the core of Corridor V.<br />
ALPTRANSIT (n.d.): www.alptransit.ch<br />
Anderson J. E, Wincoop E. v. (2004): Trade costs. In: Journal<br />
of Economic Literature. 42: 691–751.<br />
ARE – Bundesamt für Raumentwicklung (2003): Effetti territoriali<br />
delle infrastrutture di trasporto „imparare dal passato“.<br />
Bern.<br />
ARE – Bundesamt für Raumentwicklung (2007): Räumliche<br />
Auswirkungen der Verkehrsinfrastrukturen. Bern.<br />
Armstrong, H., Taylor, J. (2000): Regional economics and<br />
policy. Blackwell Publishers.<br />
BAK Basel Economics (ed.) (2005): MARS Report, July 2005,<br />
Basel.<br />
Blauwens, G., De Baere, P., Van de Voorde, E. (2002): Transport<br />
economics. Uitgeverij De Boeck, Antwerpen.<br />
81
Report on the State of the <strong>Alps</strong><br />
Button, K. J. (2003): Transport economics. Elgar, Cheltenham.<br />
CAFT – Cross Alpine Freight Transport (2004), Official<br />
dataset.<br />
Dematteis, G., Governa, F. (2002): Grandi infrastrutture e<br />
sistemi locali. Il valore aggiunto territoriale delle infrastrutture<br />
di trasporto. Franco Angeli, Milano.<br />
DG TREN (2004): EU Energy and Transport Report 2000–<br />
2004. Luxembourg.<br />
EEA – European Environment Agency (2001): TERM – Indicators<br />
tracking transport and environment integration in the European<br />
Union, Environmental issue report No 23. September<br />
2001, Copenhagen<br />
EEA – European Environment Agency (2005): The European<br />
Environment: State and Outlook 2005 – State of Environment.<br />
EEA Report No. 1/2005.<br />
EEA – European Environment Agency (2006): Transport and<br />
environment: facing a dilemma - TERM 2005. EEA Report<br />
No. 3/2006.<br />
EEA – European Environment Agency (2007): Transport and<br />
environment: one way to a new common transport policy<br />
– TERM 2006: indicators tracking transport and environment<br />
in the European Union. EEA Report No. 1/2007.<br />
Emmison, M. (2003): Social Class and Cultural Mobility:<br />
Reconfiguring the Cultural Omnivore Thesis. In: Journal of<br />
Sociology, 39 (3): 211–230.<br />
ESPON – European Spatial Planning Observation Network<br />
(2003): Synthesis report I, October 2003. http://www.espon.<br />
eu/mmp/online/website/content/publications/98/102/file_<br />
385/ESPON_synthesis_report_I.pdf.<br />
ESPON – European Spatial Planning Observation Network<br />
(2005): Synthesis report II, April 2005. http://www.espon.eu/<br />
mmp/online/website/content/publications/98/856/file_319/<br />
ESPON_synthesis_report_II.pdf.<br />
ESPON – European Spatial Planning Observation Network<br />
(2006): Database public files. http://www.espon.eu/mmp/<br />
online/website/content/tools/832/index_EN.html (accessed<br />
March 2006).<br />
European Commission (2001): White paper. European transport<br />
policy for 2010: time to decide.<br />
European Commission (2006): 314 final Communication from<br />
the Commission to the Councils and the EU Parliament<br />
“Keep Europe moving – Sustainable mobility for our continent”.<br />
Mid-term review of the European Commission’s 2001<br />
Transport White Paper.<br />
Eurostat (2005): Regional per capita GDP in PPS (index<br />
EU-25 = 100) http://epp.eurostat.ec.europa.eu/portal/<br />
page?_pageid=1996,39140985&_dad=portal&_schema=<br />
PORTAL&screen=detailref&language=en&product=SDI_<br />
MAIN&root=SDI_MAIN/sdi/sdi_ed/sdi_ed_inv/sdi_ed1130<br />
Greene D., Jones D. & Delucchi M. (1997): Full Costs and<br />
Benefits of Transportation, Spinger.<br />
INFRAS/IWW (2004): External Costs of Transport, Update<br />
study. Final report, Zurich/Karlsruhe.<br />
Kopp A. (2006): Transport Costs and International Trade. A<br />
Review of Current Research, 85th Transportation Research<br />
Board Annual Meeting. Washington D.C.<br />
LTF (2006): Lyon Turin Ferroviaire, Dossier di presentazione<br />
MARS.<br />
MATT – Italian Ministry for Environment (2005): Elaboration<br />
for the Subgroup “Costs of Alpine transport” of the WG on<br />
Transport of the Alpine Convention.<br />
McCarthy, P. S. (2001): Transportation economics: theory<br />
and practice: a case study approach. Blackwell, Oxford.<br />
MONTESPON (2006): Seminar Report, 5-6 September<br />
2006, Luzern.<br />
OECD (2001): Environmentally sustainable transport (EST).<br />
Phase 3: policy instruments for achieving EST – Vol. 2 Case<br />
study for the Alpine Region: provided by Austria, France,<br />
Italy and Switzerland.<br />
OECD (2006): Factbook 2006 – Economic, Environmental<br />
and Social Statistics.<br />
OECD, EEA (no date): Database on instruments used for<br />
environmental policy and natural resources management.<br />
http://www2.oecd.org/ecoinst/queries/index.htm.<br />
Owen, W. (1987): Transport and World Development.<br />
Hutchison, London.<br />
pan-EUROSTAR (2003): Pan-European Transport Corridors<br />
and Areas Status Report Project N° TREN/B2/26/2004<br />
Final Report. Developments and Activities between 1994<br />
and 2003. Forecast until 2010.<br />
Polak, J. B., Heertje, A. (eds.) (2001): Analytical transport<br />
economics: an international perspective. Elgar, Cheltenham.<br />
Quinet, E., Vickerman, R. (2004): Principles of transport economics.<br />
Elgar, Cheltenham.<br />
Rietveld, P., Nijkamp, P. (2001): Transport Infrastructure and<br />
Regional Development. In: Polak, J. B., Heertje, A. (eds.)<br />
Analytical transport economics: an international perspective.<br />
Elgar, Cheltenham.<br />
Rietveld, P., Vickerman, R. (2004): Transport in regional science:<br />
The “death of distance” is premature. Papers in Regional<br />
Science, 83: 229–248.<br />
Spiekermann, K. (2006): Proceedings of the conference “Territorial<br />
impact on transport” MONTESPON, Lucerne, 5. September<br />
2006.<br />
Wegener, M., Eskelinnen, H., Fürst, F., Schürmann, C.,<br />
Spiekermann, K. (2002) Criteria for the Spatial Differentiation<br />
of the EU Territory: Geographical Position. Forschungen<br />
102.2, Bonn: Bundesamt für Bauwesen und Raumordnung.<br />
Zambrini, M. (2005): Connection of Accessibility and Regional<br />
Development. National Report Italy. In: CIPRA (ed.): Leisure,<br />
Tourism and Commuter Mobility (= Future in the <strong>Alps</strong>, Question<br />
4). Vienna.<br />
82
Chapter C – Effects of Transport and Mobility in the <strong>Alps</strong><br />
C2<br />
Effects in the Social<br />
Sphere<br />
Large parts of the Alpine arc are characterised by decentralised<br />
settlement patterns. These are places where<br />
people live and work that can be rather far away from the<br />
main economic and commercial centres.<br />
There is a particular risk of decentralised settlements in<br />
strongly agricultural areas where the decline of alternative<br />
employment opportunities other than agriculture<br />
forces people to leave, and which are not easily connected<br />
with one of the above-mentioned economic centres<br />
(Meyre & Stalder 2006). Unlike the peripheral areas<br />
in the lowlands (Sweden, Germany), the Alpine arc is<br />
characterised by a rather small-scale pattern in which<br />
depopulating areas and areas with a positive growth rate<br />
are located close to each other.<br />
For people living in peripheral areas, reaching shops,<br />
public transport stops, public offices, health and social<br />
centres can be difficult. All this, together with the often<br />
poor connection to communication networks and to the<br />
limited public transport services, contributes to make<br />
the distance from the other areas longer and penalises<br />
the groups who for some reason do not own a car or are<br />
not able to drive causing a problem of social equity.<br />
The social sphere is affected by transport and mobility<br />
in many ways. These consist of positive and negative<br />
factors: for instance, the separation of homes and<br />
workplaces and their corresponding social contacts, a<br />
change in life quality in urban and rural surroundings<br />
due to noise and a change of access to open space, faster<br />
and better accessibility to shops and public services<br />
or the disappearance of public services from sparsely<br />
populated areas. Among these factors, demographic<br />
change plays a key role in the effects on social sphere<br />
in the Alpine area.<br />
This chapter therefore introduces the role of accessibility<br />
in social equity and the groups which are most affected.<br />
The effects of an ageing population on transport<br />
needs are outlined and the situation in the Alpine arc is<br />
analysed.<br />
“Basic provision”<br />
A certain politically determined minimum level of public<br />
services, including the infrastructure necessary to provide<br />
them: drinkable water and sewage treatment, energy, telecommunications,<br />
postal service, radio, tv, public transport<br />
and road network, medical and pharmacological,<br />
school, education, primary necessity goods.<br />
“Public services”<br />
Products and services of a public (cooperative) nature,<br />
i.e. goods that would not be provided – or not provided to<br />
a sufficient, universal degree – if left to the market alone<br />
(Egger 2006)<br />
C2.1 Accessibility and social equity<br />
In mountain areas public transport can only provide a partial<br />
service (see chapter A3). Peripheral municipalities, in<br />
particular, are serviced by public transport only few times<br />
or even only once a day. Because of the lower number of<br />
potential users and the higher cost of supply in comparison<br />
with the central areas, the maintenance of the service can<br />
be quite unprofitable for this kind of municipalities and the<br />
consequences are:<br />
• A high car dependency (the car is the most flexible<br />
means of transport and facilitates access to jobs, leisure<br />
and other services);<br />
• The penalization of those such as the elderly, disabled<br />
people, children or simply those with a low income who<br />
do not own a car or who are not able to drive. For these<br />
groups of the population, reaching the basic services<br />
can become a real problem. In particular, circumstances<br />
such as a bus stop which is too far away, or a reduced<br />
bus service, may constitute serious limits for these<br />
groups of people, and are an obstacle for participation in<br />
community life and for their social inclusion (WHO 1999,<br />
WHO 2002).<br />
The social inclusion of a particular group or of an individual is<br />
affected by many transport-related factors:<br />
• Access needs: some groups such as students,<br />
employees, parents with children or elderly people tend<br />
to require access to more activities than retired people,<br />
or people who have no dependants;<br />
• Location and land use: in a more accessible location,<br />
destinations are closer together, reducing the amount of<br />
physical travel required to reach a given set of activities;<br />
• Mobility options: people’s ability to travel is affected by<br />
the quantity, quality and affordability of their travel options;<br />
• Mobility substitutes: telecommunications and delivery<br />
services can sometimes substitute for physical mobility,<br />
reducing the amount of travel needed to reach activities.<br />
The more responsibilities and physical, economic or social<br />
constraints an individual bears, the more likely they are to<br />
experience transport-related social exclusion.<br />
The situation is sometimes worsened by the tendency towards<br />
a reduction in decentralised shops and, at the same<br />
time, an increase in the number of shopping centres in or<br />
near towns. This contributes to the separation of living, working<br />
and buying locations (see chapter B2) while the accessibility<br />
of shops within walking distance has decreased. Like<br />
a vicious circle, the low use of infrastructures and services<br />
which leads to their abandonment makes these locations<br />
even less attractive for the inhabitants as well as for those<br />
who might move there (Steiner 2005).<br />
Elderly people and less mobile people in those regions which<br />
registered a depopulation are particularly penalised by the<br />
lower availability of infrastructures (see chapter B1). In many<br />
mountain municipalities there are not enough customers to<br />
83
Report on the State of the <strong>Alps</strong><br />
keep shops, pharmacies, post offices, associations etc. open<br />
(Machold & Tamme 2005). For instance, almost half of the<br />
Tyrolean municipalities, and in particular those characterised<br />
by a rather low demographic density, have no post office<br />
any more, and one third are lacking a grocery shop (Stalder<br />
2005; Steixner 2005).<br />
The increasing concern for maintaining public service provision<br />
in sparsely populated mountain regions has led to the<br />
development of sustainable strategies and innovative solutions<br />
for improving public transport, roads, infrastructures relating<br />
to youth, health, telecommunications and daily needs.<br />
This allows these regions to upgrade, both as economic areas<br />
and as places of residence (Petite 2006).<br />
An important challenge for the future is making these decentralised<br />
areas sufficiently accessible, keeping under consideration<br />
both the environmental and the socio-economic aspects.<br />
In these areas accessibility, if inserted into a political<br />
framework of sustainability, can have important implications<br />
on economic development, quality of life, the vitality of mountain<br />
areas and on the development of cultural landscape.<br />
Adequate accessibility, both from the point of view of transport<br />
and communications infrastructures and from the point<br />
of view of the connection to public services (public transport,<br />
telecommunications network, social and cultural services,<br />
etc.), is important for the physical and intellectual mobility<br />
of individuals. It is important both for elderly and for younger<br />
and highly skilled people. The former constitute a share of<br />
population which is constantly increasing, whose requirements<br />
have to be identified and met. As for the latter, transport<br />
systems and infrastructures are essential because they<br />
make it possible for them to commute in order to study, work<br />
and benefit from the educational, cultural and recreational<br />
opportunities of the urban centres. At the same time they use<br />
facilities to do the shopping.<br />
<strong>How</strong>ever, good accessibility is not the only variable to guarantee<br />
a vital mountain region (Pfefferkorn et al. 2005). For<br />
a balanced demographic structure and the integration of all<br />
social and age groups, more appropriate policies and economic<br />
measures are necessary in order to support services,<br />
infrastructures, any sort of cultural stimuli and a good interchange<br />
between modern trends and traditional values. Only<br />
this integrated approach permits the conservation of settlement<br />
patterns and of human capital (Bätzing 2005; Egger<br />
2005).<br />
C2.2 The ageing population<br />
Elderly people and young people still in the educational process<br />
are the two groups which suffer the most from scarce<br />
means of access. If the former continue to live in the municipalities<br />
where they have always lived, facing the difficulties<br />
associated with living in peripheral areas and the closing<br />
down of many shops and services, it is likely that many of the<br />
latter will leave these areas as soon as they can in order to<br />
benefit from a wider range of services and opportunities.<br />
The exodus of the population aged between 20 and 64 years,<br />
typical of peripheral municipalities, contributes to the overall<br />
ageing of these towns. Ageing is a global phenomenon but in<br />
certain areas it can have particularly serious consequences.<br />
In 2000 in Europe the percentage of persons over 64 years<br />
amounts to 15.7 % (= EU-15; EU-25: 16.3 %, EUROSTAT<br />
2000) and has continued to increase in the last 15 years.<br />
EUROSTAT (2006) expects that in 2050 one third of the<br />
population will be over 65 years, i.e. the share will double<br />
by 2050.<br />
Ageing of population<br />
A summary term indicating the shifts in the age distribution<br />
(i.e. age structure) of a population toward older ages.<br />
It is a direct consequence of the ongoing global decline of<br />
fertility and mortality (Gavrilov & Heuveline 2003).<br />
Over-ageing<br />
A population can be regarded as “over-aged” when more<br />
than 15% of the total population is over 60 years old (Bähr<br />
2004).<br />
Old age index<br />
A dynamic indicator used to describe the demographic<br />
structure of a region (ASTAT 2003). It is defined as the<br />
number of people over 64 per 100 young people under 15<br />
(Gavrilov & Heuveline 2003).<br />
With its particularly high percentage of people over 64, Italy<br />
is at the top of the compared Alpine States. But there is no<br />
difference between the Italian <strong>Alps</strong> and the national value.<br />
The Principality of Monaco was not considered because, due<br />
to its particular conditions (tax policies, climate, society and<br />
leisure facilities), mainly old and well-heeled people have<br />
settled there. Hence the highest values could be observed<br />
here. From a demographical point of view a dynamic development<br />
was registered for Slovenia and for Liechtenstein.<br />
Both have a very low share of people older than 64.<br />
A more differentiated picture shows the distribution of municipalities<br />
with an above-average share of elderly people. For<br />
63% of municipalities within the Alpine Convention area, the<br />
percentage of inhabitants older than 64 years is above 15%.<br />
41%, or 1,529, of these municipalities are in Italy while more<br />
than a quarter are in France. Almost 87% of “over-aged municipalities”<br />
are in the Italian Alpine Convention area, 60%<br />
in the German and more than half in the French and Swiss<br />
ones. Within the Italian Alpine arc, Alto Adige/Südtirol is striking<br />
with its share of 15.7% of people older than 64. Only 39<br />
(33.1%) of the 116 South Tyrolean municipalities exceed the<br />
share of 15%.<br />
The old-age index (see box) accurately determines the<br />
distribution of over-ageing in single mountainous regions.<br />
The Alpine-wide average value is 100.3. An analysis of the<br />
population older than 64 confirms a high percentage of elderly<br />
people in Italy’s Alpine regions. In Liguria in particular,<br />
the old-age index amounts to 241 (Fig.C2-1 and Fig.C2-2).<br />
Among those five regions with the highest old- age indices,<br />
four are located in Italy’s Alpine arc. The regions with the lowest<br />
old-age index are Liechtenstein (63), Vorarlberg/AT (64),<br />
Rhône-Alpes/FR (70) and Tirol/AT (73).<br />
84
.<br />
Chapter C – Effects of Transport and Mobility in the <strong>Alps</strong><br />
Map C2-1 depicts a high contrast between the northern and<br />
the southern part of the Alpine arc. Due to their low share of<br />
over-aged people, the autonomous provinces of Alto Adige/<br />
Südtirol and Trentino, as well as the autonomous region<br />
Valle d’Aosta, are an exception. Due to a high migration rate,<br />
some Austrian municipalities in Obersteiermark and some<br />
municipalities bordering the Bavarian <strong>Alps</strong> are also suffering<br />
from over-ageing. On the contrary, Liechtenstein and the<br />
Austrian regions of Vorarlberg, Tirol and Salzburg show a<br />
below-average old-age index.<br />
Persons over 64 in the<br />
total population [%]<br />
Alpine Convention area<br />
Country<br />
National<br />
values<br />
Alpine<br />
Convention<br />
Municipalities<br />
Municipalities<br />
recording over 15%<br />
of persons older<br />
than 64 years<br />
Share of municipalities,<br />
recording over<br />
15% of persons older<br />
than 64 years [%]<br />
Total share of all municipalities<br />
with over<br />
15 % of persons older<br />
than 64 years [%]<br />
1 2 3 4 5 5/4 5/5 (total)<br />
Austria 15.4 15.1 1,148 493 43 13.2<br />
Switzerland 15.4 15.9 944 519 55 13.9<br />
Germany 16.4 17.3 285 170 60 4.6<br />
France 16.1 15.1 1,749 990 57 26.6<br />
Liechtenstein 11.3 11 0 0 0<br />
Italy 18.3 19.1 1,756 1,529 87 41<br />
Monaco 22.4 1 1 100 0<br />
Slovenia 14.0 14.0 60 26 43 0.7<br />
Alpine Convention 17.0 5,954 3,728 63 100.0<br />
Tab. C2-1: The share of people over 64 in the Alpine Convention area. Data refer to 1999 (France), 2000 (Switzerland), 2001 (Austria, Italy, Germany and<br />
Liechtenstein), 2002 (Slovenia). [Source for Alpine Convention: INSEE 1999 (France); Bundesamt für Statistik Bern 2000 (Switzerland); Statistik Austria<br />
2001 (Austria); Bayerisches Landesamt für Statistik und Datenverarbeitung, 2001 (Germany); Amt für Volkswirtschaft 2001 (Liechtenstein); Statistical Office<br />
Slovenia 2000 (Slovenia)].<br />
Fig. C2-1: Old-age index in Alpine Convention regions. Data refer to: 1999 (France), 2000 (Switzerland and Monaco), 2001 (Austria, Germany, Italy and<br />
Liechtenstein), 2002 (Slovenia) (Sources: see tab. C2-1).<br />
85
Map C2-1: Old-age index in Alpine municipalities.
Chapter C – Effects of Transport and Mobility in the <strong>Alps</strong><br />
Are these over-ageing phenomena connected with a certain<br />
size of municipality? According to the population values of<br />
the municipalities, a tendency to ageing was detected for<br />
the least densely inhabited municipalities ( 100<br />
Municipalities with a<br />
population decrease<br />
between 1990 and 2000*<br />
Municipalities with an old-age<br />
index > 100 and a population<br />
decrease between 1990 and 2000*<br />
Total N° [%] N° % N° [%] [%]<br />
Columns 1 2 3 3/1 4 5 6 6/1 6/4<br />
< 500 1,872 119.9 1,080 57.7 688 36.8 563 30 81.8<br />
501-1,000 1,095 98.0 503 45.9 310 28.3 228 21 73.5<br />
1,001-2,500 1,584 92.7 618 39.0 385 24.3 258 16 67.0<br />
2,501-5,000 817 93.7 325 39,8 141 17.3 104 13 73.8<br />
5,001-10,000 360 95.6 169 46.9 66 18.3 55 15 83.3<br />
10,001-25,000 178 99.6 88 49.4 34 19.1 27 15 79.4<br />
25,001-50,000 34 123.6 22 64.7 13 38.2 10 29 76.9<br />
> 50,000 14 121.6 12 85,7 5 35.7 5 36 100.0<br />
Total <strong>Alps</strong> 5,954 100.3 2,817 47.3 1,642 27.6 1,250 21 76.1<br />
Tab. C2-2: Old-age index of the municipalities of the Alpine Convention.<br />
* Data refer to: 1999 (France), 2000 (Switzerland and Monaco), 2001 (Austria, Germany, Italy and Liechtenstein), 2002 (Slovenia)<br />
(Sources: see Tab. C2-1).<br />
Municipalities Region (NUTS 2)<br />
Inhabitants<br />
(2004)<br />
Old-age<br />
index<br />
Luzern Zentralschweiz 59,904 188.98<br />
Bolzano/<br />
Bozen<br />
Trentino-Alto Adige 97,236 158.44<br />
Maribor Slovenia 111,673 137.34<br />
Kempten Schwaben 61,576 135.07<br />
Trento Trentino-Alto Adige 110,142 130.83<br />
Rosenheim Oberbayern 60,108 121.65<br />
Annecy Rhône-Alpes 52,100 121.20<br />
Salzburg Salzburg 142,662 118.73<br />
Innsbruck Tirol 115,498 116.52<br />
Klagenfurt Kärtnen 91,723 108.98<br />
Villach Kärtnen 57,829 106.87<br />
Grenoble Rhône-Alpes 156,203 102.7<br />
Kranj Slovenia 52,689 91.98<br />
Chambéry Rhône-Alpes 57,592 91.95<br />
Alpine<br />
Convention<br />
- - 100.30<br />
Tab. C2-3: Old-age index of the most populated municipalities. Data refer<br />
to 1999 (France), 2000 (Switzerland), 2001 (Austria, Germany, Italy), 2002<br />
(Slovenia) (Sources see Tab. C2-1).<br />
Most of the urban centres in the central <strong>Alps</strong> attain an oldage<br />
index above 100 except Kranj (91.98) and Chambéry<br />
(91.95), that means there is more than one old person for<br />
every young person (Tab. C2-3). High values were also registered<br />
for Luzern and Bolzano/Bozen, whereas in Luzern<br />
there are two inhabitants older than 64 for every person<br />
younger than 15.<br />
Those municipalities in particular with fewer than 100 inhabitants<br />
attain the highest rate of over-aged people. Ribordone,<br />
near Turin/IT, is the municipality with the highest old-age index:<br />
it amounts to well over 5,500, i.e. there are 55 people<br />
over 64 years for every one person under 15. Six of the ten<br />
municipalities with the highest old-age index are located in<br />
Piemonte.<br />
In addition, the relationship between the old-age index and<br />
the accessibility of the Alpine municipalities was analysed<br />
(see chapter B2). Although the easily accessible locations at<br />
the southern foothills of the <strong>Alps</strong> are characterised by a positive<br />
migration rate, they register an old-age index of over 100<br />
(Fig.C2-2). The closer the vicinity to the Alpine main ridge in<br />
this part, the more this index is increasing.<br />
As shown in table C2-4, analyses revealed no meaningful linear<br />
relationship between old-age index and accessibility (at<br />
least in the way it is calculated in project REGALP, i.e. as the<br />
number of accessible inhabitants within a travel time of three<br />
hours). Municipalities with an old-age index lower than 100<br />
represent the largest percentage of “less accessible municipalities”<br />
category (fewer than 0.4 Mio inhabitants accessible<br />
within a three-hour journey) and the smallest percentage of<br />
the ‘most accessible municipalities’ category (over 1.5 Mio<br />
inhabitants accessible within a three-hour journey). <strong>How</strong>ever,<br />
when average accessibility values are taken into account<br />
(between 0.4 Mio and 1.5 Mio inhabitants accessible<br />
within a three-hour journey) trends are less clear.<br />
87
Report on the State of the <strong>Alps</strong><br />
Accessibility Municipalities (%)<br />
Total of<br />
municipalities<br />
Accessible<br />
Inhabitants<br />
within a<br />
travel time<br />
of 3 hours<br />
(in Mio.)<br />
Old-age index<br />
100<br />
1,475 0.0 - 0.2 17,8 20,2 11,1 6,1 17,4 7,9 11,3 8,3<br />
1,258 0.2 - 0.4 13,2 8,7 11,9 5,5 22,7 8,9 18,7 10,5<br />
1,265 0.4 - 0.6 11,9 24,3 6,7 12,6 11,7 13,2 10,9 8,6<br />
133 0.6 - 0.8 3,8 0,8 9,8 5,3 27,8 3,8 42,9 6,0<br />
707 0.8 - 1.0 12,7 19,0 15,3 8,9 13,7 10,0 10,7 9,6<br />
687 1.0 - 1.5 15,7 20,1 8,6 6,0 14,6 10,5 13,0 11,6<br />
59 1.5 - 2.0 0,0 42,4 0,0 8,5 10,2 11,9 13,6 13,6<br />
345 2.0 - 3.0 0,6 22,0 3,5 18,6 4,9 20,6 5,2 24,6<br />
Tab.C2-4: Municipalities with an old-age index above and below 100 according to the population classes and accessibility (Regalp, 1995; no data: 35 municipalities)<br />
[Source: Austria (Old-age index: Statistik Austria 2001); France (Old-age index: INSEE 1999); Germany (Old-age index: Bayerisches Landesamt für<br />
Statistik und Datenverarbeitung, 2001); Italy (Old-age index: ISTAT 2001); Slovenia (Old-age index: Statistical Office Slovenia 2002); Switzerland (Old-age<br />
index: Swiss Federal Statistical Office 2000)].<br />
Considering the demographic size of municipalities, communities<br />
with fewer than 500 people and an old-age index over<br />
100 are the largest category both in the group of municipalities<br />
with the poorest accessibility and in the two groups with<br />
the best accessibility.<br />
It seems therefore that the old-age index is linked to other<br />
variables and that good accessibility alone is not enough<br />
to guarantee a balanced demographic structure. As project<br />
REGALP pointed out, some municipalities display a good<br />
demographic growth in spite of their poor accessibility. That<br />
is the case in areas whose economy is dominated by the<br />
tourism industry, with a high number of ‘incoming’ commuters,<br />
a growth in the number of new buildings and a very<br />
small-sized primary sector.<br />
Main findings<br />
Status<br />
Generally, the age-structure of a society depends on various<br />
aspects. Furthermore, the situation in mountain municipalities<br />
is strongly influenced by the overall national<br />
and regional situations.<br />
In most Alpine countries the share of inhabitants over<br />
the age of 64 is above the respective national average<br />
(exception: Austria, France and Slovenia).<br />
On average the highest shares are registered in the Italian<br />
<strong>Alps</strong>, the Italian-speaking regions in Switzerland (Ticino)<br />
and Monaco.<br />
Very small-structured municipalities (
Chapter C – Effects of Transport and Mobility in the <strong>Alps</strong><br />
Bibliography<br />
ASTAT – Istituto provinciale di Statistica (2003): Manuale<br />
demografico della Provincia di Bolzano/Bozen.<br />
ASTAT – Istituto provinciale di Statistica (2005): 8. Censimento<br />
generale dell’industria e dei servizi 22 ottobre 2001<br />
con confronto tra Tirolo, Alto Adige e Trentino.<br />
ASTAT – Istituto provinciale di Statistica (2006): Laureati<br />
in Provincia di Bolzano/Bozen in Informazioni ASTAT 4,<br />
February.<br />
Bähr, J. (1997): Bevölkerungsgeographie. Ulmer, Stuttgart.<br />
Bähr, J. (2004): Bevölkerungsgeographie. Ulmer, Stuttgart.<br />
Bätzing, W. (2005): Le Alpi. Bollati Boringhieri.<br />
Egger, T. (2005): Starker Gemeinschaftssinn in Isenthal. In:<br />
Montagna, 3: 26–27.<br />
Egger, T. (2006): Public Services in sparsely populated<br />
mountain regions (PUSEMOR). http://www.euromontana.<br />
org/Chaves/WS1_egger.pdf<br />
Stalder, U. (2005): Service public im Berggebiet verbessern.<br />
In: Montagna, 1/2: 26–27.<br />
Stalder, U. (2006): Public Services in mountain regions –<br />
new needs and innovative strategies. Proceedings of Mont<br />
Espon Conference, 05. September 2006, Lucerne.<br />
Steiner, J. (2005): Wir tun dieser Schweiz gut. In: Montagna,<br />
1/2: 30–33.<br />
Steixner, A. (2005): Zukunftsauftrag ländlicher Raum.<br />
In: Montagna, 11: 6–9.<br />
WHO (1999): Ageing: Exploding the myths. http://whqlibdoc.who.int/hq/1999/WHO_HSC_AHE_99.1.pdf<br />
(accessed:<br />
June 2006).<br />
WHO (2002): Active Ageing: a Policy Framework.<br />
http://whqlibdoc.who.int/hq/2002/WHO_NMH_NPH_02.8.pdf<br />
(accessed: June 2006).<br />
ERTRAC – European Road Transport Research Advisory<br />
Council (2004): Vision 2020 and challenges. http://www.<br />
ertrac.org/pdf/publications/ertrac_brochure_june2004.pdf<br />
(accessed: June 2006).<br />
EUROSTAT (2000): Regional Data online: http://epp.eurostat.ec.europa.eu/portal/page?_pageid=0,1136162,0_<br />
45572076&_dad=portal&_schema=PORTAL (accessed 20<br />
September 2006)<br />
Eurostat (2006): Internationaler Tag der älteren Generation.<br />
Pressemitteilung Nr. 129, 29. September 2006.<br />
Gavrilov, L. A., Heuveline, P. (2003): Aging of Population. In:<br />
Demeny, P., McNicoll, G. (eds.): The Encyclopedia of Population.<br />
Macmillan Reference, New York.<br />
Harrison, E. L., Huntigton, S. P. (2000): Culture matters: how<br />
values shape human progress. Basic Books, New York.<br />
Machold, I., Tamme, O. (2005): Versorgung gefährdet. Soziale<br />
und wirtschaftliche Infrastrukturentwicklung. In: Bundesanstalt<br />
für Bergbauernfragen. Forschungsbericht 53, Wien.<br />
Maretzke, S. (2001): Altersstruktur und Überalterung. In:<br />
Institut für Länderkunde (eds.): Bundesrepublik Deutschland<br />
– Nationalatlas, Band 4 Bevölkerung, Leipzig.<br />
Meyre, S., Stalder, U. (2006): Dezentrale Besiedlung und<br />
flächendeckende Versorgung. SAB – Schweizerische Arbeitsgemeinschaft<br />
für die Berggebiete (ed.), Nr. 182, Bern.<br />
http://www.sab.ch/fileadmin/user_upload/MONTAGNA/<br />
SAB_Verlag/Dezentr_D.pdf.<br />
OECD (2002): Investissements en infrastructure de transport<br />
et développement regional.<br />
Petite, G. (2006): PUSEMOR: un projet pour maintenir le<br />
service public. In: Montagna 3: 22–25.<br />
Pfefferkorn, W., Egli, H.-R., Massarutto, A. (2005): Regional<br />
Development and Cultural Landscape Change in the <strong>Alps</strong>.<br />
The Challenge of Polarisation. In: Geographica Bernensia,<br />
G74, Bern.<br />
Scheiner, J. (2005): Bestimmungsgrössen der Freizeitmobilität<br />
älterer Menschen: Die Bedeutung von Siedlungsstrukturen<br />
und Pkw-Verfügbarkeit. In: Zeitschrift für Verkehrswissenschaft,<br />
76, 2: 164–189.<br />
89
Report on the State of the <strong>Alps</strong><br />
C3<br />
Environmental and Health<br />
Effects<br />
C3.1 Air quality<br />
Air pollution can cross both natural and political boundaries,<br />
especially in the case of pollutants with a higher<br />
atmospheric lifetime like ozone and particulate matter.<br />
Acidifying compounds can be transported over thousands<br />
of kilometres before being deposited, thereby<br />
affecting ecosystems far away from the source of the<br />
pollution. In Alpine areas, pollutants emitted or formed<br />
in valleys are dispersed over large areas by specific<br />
meteorological conditions such as valley and slope<br />
winds, and temperature inversions during autumn and<br />
winter. They affect sensitive ecosystems. Thus the<br />
control of air pollution in the Alpine States is necessarily<br />
an activity best addressed by countries in cooperation<br />
with each other. The Alpine Convention aims<br />
to reduce air pollutants. The reduction of traffic emissions<br />
will play an important role in achieving this goal.<br />
C3.1.1 Impacts of air pollution on ecosystems<br />
and human health<br />
Vehicle emissions as important sources of high concentration<br />
of air pollutants<br />
Vehicle emissions contribute significantly to ambient air concentrations<br />
of nitrogen oxides (NO and NO 2<br />
) and fine particulates<br />
(PM) – and indirectly to ground-level ozone (O 3<br />
),<br />
since NOx and VOC (volatile organic compounds) are the<br />
main precursors of ozone and secondary particulate matter<br />
(PM). As PM10 (particulate matter < 10 µm) is the smallest<br />
size so far subjected to regulatory measures in the EC, the<br />
further elaborations cover only PM of this size, although recent<br />
discussions are now entering on a limit value of PM2.5<br />
(< 2.5 mm).<br />
Nitrogen oxides, ozone and PM10 affect human health, ecosystems<br />
and vegetation. The synergetic effects of these pollutants<br />
can increase harmful effects. In the case of particulate<br />
matter and nitrogen oxides, high concentrations occur mainly<br />
during winter, whereas ozone is mainly a problem during the<br />
summer, because the formation processes are triggered by<br />
sunlight.<br />
Health risks<br />
For humans, the most common adverse effects of the abovementioned<br />
pollutants are - depending on the concentration<br />
of pollutants and the exposure - coughs and other respiratory<br />
problems such as bronchitis, but asthma and allergies<br />
may also occur. Cardiovascular function, too, can be affected<br />
both by pollution-induced inflammation and even by impacts<br />
on the autonomic heart function. There are wide variations<br />
in people’s susceptibility to air pollution. The greatest effects<br />
are generally seen in those people with underlying disease<br />
such cardiovascular or respiratory diseases. Children, the<br />
elderly and those taking in large amounts of air while exercising<br />
outdoors in polluted conditions also appear to be vulnerable<br />
(EEA 2005).<br />
Ecosystem damages<br />
Nitrogen oxides can contribute to acidification and eutrophication<br />
in terrestrial and freshwater ecosystems, but they can<br />
also have direct toxic impacts on plants by being taken up<br />
via their stomata.<br />
<strong>How</strong>ever, the main effects of acidification and eutrophication<br />
occur by deposition. Nitrogen deposition is the most significant<br />
factor in endangering mountain forest ecosystems. High<br />
deposition rates convey nutrient imbalances and higher frost<br />
sensibility. Having been exposed for many years to high nitrogen<br />
deposition, a lot of ecosystems are losing their capacity<br />
to absorb more nutrients, with the consequence that<br />
they will be leached out of the root zone or emitted into the<br />
atmosphere.<br />
Ecosystems are characterised by specific thresholds – so<br />
called Critical Loads – which indicate the level at which the<br />
detrimental effects of long-term deposition are to be expected.<br />
Forests are particularly threatened due to high deposition,<br />
as are ecosystems with a low nutrient status or with a<br />
low base saturation. In Austria, for example, critical loads for<br />
nitrogen are exceeded predominantly in the Northern Limestone<br />
<strong>Alps</strong>, where deposition is higher than in other parts of<br />
Austria.<br />
Ozone is a cytotoxin which is taken up by the leaves of plants<br />
and induces chlorosis and loss of foliage (Herman & Smidt<br />
2003). Therefore ozone-related vegetation damage mainly<br />
occurs on sites with a good water supply in the summer<br />
months when the stomata of plants are open for prolonged<br />
periods. Due to high precipitation many parts of the <strong>Alps</strong><br />
offer good water conditions and therefore suffer a high risk<br />
of plant damage.<br />
Special topographic and meteorological factors in the <strong>Alps</strong><br />
Dispersion conditions and accumulation over several days<br />
are – besides emissions of primary particles and precursors<br />
of secondary particles including NOx – a key factor for high<br />
NO 2<br />
and PM10 concentrations in Alpine valleys and basins.<br />
Adverse dispersion conditions affect especially the valleys<br />
and basins in the south-eastern parts of the <strong>Alps</strong>, which are<br />
shielded from oceanic north-westerly winds by the central<br />
Alpine ridge.<br />
C3.1.2 Measuring air quality<br />
Due to the long history of monitoring of air quality and enforcement<br />
by EU-regulations which aim to limit the concentration<br />
of air pollutants endangering human health, ecosystems<br />
and vegetation, there is a relatively high level of harmonisation<br />
of air quality measurements. While NOx and ozone, for<br />
example, have been measured for some decades in many<br />
countries, PM10 measurements were not begun before the<br />
late 1990s, replacing the monitoring of total suspended particulates.<br />
The status and trends of deposition loads cannot<br />
be discussed within this report.<br />
The following map (Map C3‐1, next page) provides an overview<br />
of the monitoring stations which were considered in this<br />
study. Longtime data series were not delivered for all stations,<br />
and data for the whole set of parameters are not available<br />
for all stations.<br />
90
Map C3‐1: Air quality measuring stations (classification according to Directive 2001/752/EC).
Report on the State of the <strong>Alps</strong><br />
Type of stations in relation to dominant emissions<br />
sources<br />
Traffic Stations located such that their pollution<br />
level is influenced mainly by emissions<br />
from a nearby road/street<br />
Background Stations that are neither traffic nor industrial;<br />
located such that their pollution level<br />
is not mainly influenced by any single<br />
source or street but rather by the integrated<br />
contribution from all sources upwind of the<br />
station<br />
Type of area<br />
Urban Continuously built-up area<br />
Suburban Largely built-up area: continuous settlement<br />
of detached buildings mixed with<br />
non-urbanised areas (small lakes,<br />
woods, agricultural)<br />
Rural All areas that do not fulfil the criteria for<br />
urban/suburban areas<br />
Air quality limits for ambient concentrations have been set by<br />
the EU and the European member states to protect human<br />
health, ecosystems and vegetation.<br />
Pollutant<br />
EU<br />
Directive<br />
Value and number of times<br />
exceeded limit allowed<br />
to be<br />
met in<br />
Protection of human health<br />
NO 2<br />
(LV) 1999/30/EC 200 µg/m³ (1h average) 2010<br />
limit exceeded < 19 times for<br />
1 hour average / year<br />
with margin of tolerance<br />
NO 2<br />
(LV) 1999/30/EC 40 µg/m³ (annual mean) 2010<br />
with margin of tolerance<br />
O 3<br />
(TV) 2002/3/EC 120 µg/m³ (8h average) 2010<br />
< 25 days (averaged over<br />
three years)<br />
O 3<br />
(ITH) 2002/3/EC 180 µg/m³ (1h average)<br />
O 3<br />
(ATH) 2002/3/EC 240 µg/m³ (1h average)<br />
PM10 (LV) 1999/30/EC 50 µg/m³ (24h average) 2005<br />
< 36 days / year<br />
PM10 (LV) 1999/30/EC 40 µg/m³ (annual mean) 2005<br />
Protection of ecosystems and vegetation<br />
NOx (LV) 1999/30/EC 30 µg/m³ (annual mean) 2001<br />
O 3<br />
(TV) 2002/3/EC AOT40 of 18 mg/m³h 2010<br />
(5 year average)<br />
LV limit value – TV target value – TH threshold,<br />
ITH Information Threshold – ATH Alert Threshold<br />
Current EU legislation (the EC framework directive on ambient<br />
air quality and management and related daughter<br />
directives) is based on threshold values recommended by<br />
the World Health Organization (WHO). Nevertheless, it is important<br />
to stress that the levels for PM10, ozone and NO 2<br />
do<br />
not represent no-effects thresholds.<br />
C3.1.3 Concentration of nitrogen oxides –<br />
state and development<br />
The hot spots of NO 2<br />
pollution are motorways and trunk roads<br />
both in urban locations and at major Alpine transit routes. In<br />
remote rural Alpine areas, the indirect effect of NO 2<br />
by ozone<br />
formation is more relevant.<br />
Long-term development of NO 2<br />
concentration<br />
Although during the last two decades a reduction in NO 2<br />
concentrations and an improvement in air quality have been<br />
achieved, pollution remains at a level which requires further<br />
measures to comply with European regulations.<br />
The most important reduction took place in the years around<br />
1990; the average concentration decreased by nearly 30%.<br />
This reduction was primarily caused by the introduction of<br />
cars with three-way catalytic converters in the late 1980s<br />
and early 1990s in all EU countries. This was induced by<br />
Directive 91/441/EEC – although many Member States had<br />
already encouraged the introduction of catalytic converters<br />
to cars before 1990. Emission standards for Heavy-Duty Vehicles<br />
(HDV) (Directive 91/542/EEC, Stage I and II) and passenger<br />
cars (Directive 94/12/EC) also contributed – although<br />
to a smaller extent – to emission reductions in the period<br />
1994–98 (Molitor et al. 2001). After 1995 the concentrations<br />
did not change more or less until 2000 (see Fig. C3‐1).<br />
Similar trends – reductions of NO 2<br />
concentration, although to<br />
a smaller extent – can be identified for background stations.<br />
In urban areas, the reduction effects were higher than in suburban<br />
and rural areas.<br />
Tab. C3‐1: EU ambient air quality limit and target values, thresholds<br />
(Source: EEA 2005 and own compilation).<br />
The European Information System on Air Quality (Air-<br />
Base) provides Europe-wide collected data on nitrogen<br />
oxides, ozone, and PM10: http://air-climate.eionet.eu.int/<br />
databases/airbase/index_html<br />
Nevertheless, there remain some monitoring stations at<br />
national level which do not supply any data to the EU.<br />
These data have also been used for the analyses shown<br />
in Tab. C3‐1.<br />
Fig. C3‐1: Annual means of NO 2<br />
on traffic stations in the <strong>Alps</strong> (data from<br />
AT, CH, DE, no longtime data series available for the other countries).<br />
Focusing on the developments of the last 10 years and analysing<br />
also the data from recently established traffic-related<br />
monitoring sites, in the last few years a trend of stable NOx<br />
and increasing NO 2<br />
concentrations can be detected in the<br />
Alpine countries, irrespective of the type of area (urban, suburban,<br />
rural) of the monitoring site (see Fig. C3‐2). The rea-<br />
92
Chapter C – Effects of Transport and Mobility in the <strong>Alps</strong><br />
son for this may be the continuously increasing traffic loads<br />
(see chap. A2 and A3) which compensate for the NOx reduction<br />
effects caused by technical improvements. Furthermore<br />
there are likely to be increasing emissions of NO 2<br />
due to the<br />
use of diesel particulate matter filters (UBA 2006b).<br />
Number of stations<br />
Stations where limits were not exceeded<br />
Stations where limits were exceeded<br />
(>50-60 µg/m 3 )<br />
Stations where limits were exceeded (>40/50 µg/m 3 )<br />
Stations where limits were exceeded<br />
(>60 µg/m 3 )<br />
Fig. C3‐2: Annual means of NO 2<br />
on traffic stations in the <strong>Alps</strong> (data from<br />
AT, CH, DE, FR, no longtime data series available for the other countries).<br />
Instances when the annual limit value for NO 2<br />
was<br />
exceeded<br />
By 2010 the limit value of 40 µg/m³ of NO 2<br />
(annual mean)<br />
has to be attained Europe-wide (Directive 1999/30/EC).<br />
Until this date a decreasing margin of tolerance (MoT) was<br />
defined, triggering the development of air quality management<br />
plans if the limit is exceeded.<br />
Since the EU-Directive (1999) came into effect, the number<br />
and percentage of stations exceeding the limit value<br />
plus the MoT have been increasing (as the MoT limit value<br />
decreased). In 2005 the sum of limit values and MoT was<br />
exceeded at 32% of all traffic stations in the <strong>Alps</strong> (see Tab.<br />
C3‐2), both in urban and rural areas. In contrast, these values<br />
were not exceeded at urban and rural background stations.<br />
Year<br />
Limit value plus<br />
margin of<br />
tolerance<br />
Number<br />
of traffic<br />
stations<br />
Number<br />
(percentages)<br />
of stations where<br />
limit was exceeded<br />
2000 60 µg/m³ 22 1 (5%)<br />
2001 58 µg/m³ 24 1 (4%)<br />
2002 56 µg/m³ 33 4 (12%)<br />
2003 54 µg/m³ 57 11 (19%)<br />
2004 52 µg/m³ 60 16 (27%)<br />
2005 50 µg/m³ 31 10 (32%)<br />
Tab. C3‐2: Stations which exceeded the limit values plus margin of<br />
tolerance between 2000 and 2005 (data from AT, CH, DE, FR, IT, LI).<br />
Fig. C3‐3: Percentage of traffic-related stations showing where the future<br />
European long-term limit value for NO 2<br />
(40 µg/m³) was exceeded at all<br />
stations (data from AT, CH, DE, FR, IT, LI).<br />
Instances when the short-term limit value for NO 2<br />
was<br />
exceeded<br />
The EU short-time limit value of less than 19 days (per calendar<br />
year) of the one hour average of 200 µg/m³ will have<br />
to be met from 2010 on. For the period until 2010, however,<br />
higher limit values are effective (200 µg/m³ plus margin of<br />
tolerance). For this report only data from Austria have been<br />
delivered. Though for Austria it is known that – taking advantage<br />
of the margin of tolerance – the value has not been<br />
exceeded in the last years except at one traffic station in<br />
2005.<br />
Considering only the limit value of 200 µg/m³ without tolerance,<br />
the limits were exceeded on more than 18 occasions<br />
(the future EU short-time limit value) at some traffic stations,<br />
especially in the last two years. In 2005, one hour mean values<br />
above 200 µg/m³ were measured at almost 20% of all<br />
traffic-related monitoring sites (see Fig. C3‐4). Thus the new<br />
general tendency of increasing annual means of NO 2<br />
in areas<br />
strongly influenced by traffic is also reflected by a higher<br />
frequency of short-time peak values.<br />
Several traffic stations record increasing annual means<br />
above the future limit value of 40 µg/m³ so that it is likely that<br />
the limit value will not be met by the attainment date. Nine<br />
out of a total of 15 stations which exceeded the limits in 2005<br />
are situated in an urban environment, three in the rural area<br />
near the motorways A10, 12 and 13 in Austria.<br />
In the last three years, about 50% of all traffic stations recorded<br />
values in excess of the future limit value of 40 µg/m³<br />
(see Fig. C3‐3).<br />
Fig. C3‐4: Percentage of traffic stations in the <strong>Alps</strong> exceeding the European<br />
short-term limit value for NO 2<br />
(data from AT, CH, DE, FR, LI).<br />
93
Report on the State of the <strong>Alps</strong><br />
According to Directives 1996/62/EC and 1999/30/EC the exceeding<br />
of 1h average or annual mean limit values for NO 2<br />
requires the Member States to draw up plans to comply with<br />
the limit value at the attainment date, which will be 2010. In<br />
the case of NO 2<br />
the main source is road traffic.<br />
Case study: Development of NOx emissions and concentration<br />
at Alpine highways<br />
Trends of air quality measurements for NOx and traffic<br />
emissions close to highways are available for three sites<br />
in Austria and one site in Switzerland (see Fig. C3‐5). In<br />
Austria, the air quality monitoring sites are situated at the<br />
A10 Tauernautobahn (Zedernhaus, Salzburg), A12 Inntalautobahn<br />
(Vomp, Tirol) and A13 Brennerautobahn (Gärberbach,<br />
Tirol). In Switzerland the monitoring site is next<br />
to the A9 at Sion (canton Wallis).<br />
NO x<br />
concentration (ppb) / Emission (kg/m 2 /day)<br />
Number of vehicles passing Vomp on A12 per day<br />
NOx traffic emissions were calculated with the help<br />
of traffic data from nearby traffic counting stations and<br />
the handbook of emission factors (Keller & Hausberger<br />
2004). On the A10 (Katschberg) about 15,000 vehicles/<br />
day are passing by on average, 23% of which are heavy<br />
duty vehicles (HDV). The A12 (Vomp) shows a much<br />
higher traffic flow of about 50,000 vehicles/day and a<br />
share of 17% of HDV. At the A13 (Matrei) the traffic flow<br />
amounts to about 30,000 vehicles/day; the share of HDV<br />
is about 22%. The A9 (Sion) which is not completed yet,<br />
shows about 19,000 vehicles/day and a very low share of<br />
HDV of only 3%.<br />
The emissions show a decline for the A12 highway in Austria<br />
and the A9 Switzerland, the A10 shows an increase<br />
until 1998 and a decline from 2000 onwards. The emissions<br />
at the A13 are roughly at the same level from 1994<br />
to 2005. The trend of the emissions is decoupled from the<br />
traffic flow, which shows a more or less constant increase<br />
for all four highways in this period.<br />
The concentrations do seem to reflect the trends in emissions<br />
apart from the last two years. This decoupling might<br />
be due to an underestimation of NOx emissions in the<br />
handbook of emission factors as the real world emissions<br />
of Euro 2, Euro 3 and Euro 4 passenger cars are considerably<br />
higher than for the test driving cycle (Hausberger<br />
2006, Umweltbundesamt 2006b). Furthermore, it has to<br />
be noted, that close to traffic the NO 2<br />
concentrations do<br />
not necessarily reflect the trends of NOx (NO+NO 2<br />
) emissions<br />
as there is an increase in the NO 2<br />
/NO ratio of Diesel<br />
car emissions due to increased use of oxidation catalysts<br />
in Diesel cars. This leads to an increase in NO 2<br />
concentration<br />
even for constant or slightly decreasing NOx emissions.<br />
Fig. C3‐5: Trend of NOx emissions and concentrations at highways in Alpine<br />
valleys as well as the traffic flow of the A12 at Vomp (data from AT<br />
and CH).<br />
C3.1.4 Concentration of ozone – state and<br />
development<br />
Ground level (tropospheric) ozone is not directly emitted in<br />
the atmosphere. It is formed by photochemical reactions.<br />
Ozone is by far the most important constituent of the so<br />
called photochemical smog, a complex chemical mixture of<br />
secondary pollutants. The photochemical reactions are triggered<br />
by sunlight in the presence of the precursors of ozone.<br />
The most important ones are volatile organic compounds<br />
and nitrogen oxides (NOx and VOC). Temperature and the<br />
intensity of insolation are key factors for the chemical reactions,<br />
so that ozone is much more intensively formed in the<br />
summer months. The combination of ozone formation, vertical<br />
mixing and depletion at solid surfaces triggers the daily<br />
variation of ozone concentrations. Depletion and titration of<br />
ozone by NO lead to low concentrations near the ground during<br />
night time, whereas in the reservoir layer at elevated altitudes,<br />
high concentrations can prevail over several days.<br />
Therefore areas remote from the sources of the precursors<br />
are affected by higher ozone levels – especially long-term<br />
concentrations – than areas directly influenced by traffic<br />
emissions.<br />
High long-term ozone levels in most remote parts of the <strong>Alps</strong><br />
correspond to increased ozone concentration levels compared<br />
to Central European ozone levels. Precursor emissions<br />
and ozone formation in large parts of Europe, especially<br />
in the Po Valley and western Central Europe, contribute to<br />
a considerable extent to ozone levels on this spatial scale.<br />
Long-term development of O 3<br />
concentration<br />
The long-term development of summer averages shows<br />
a slightly increasing trend in the Alpine countries (see Fig.<br />
C3‐6), which is statistically significant only in northern Alpine<br />
valleys (Tirol, Salzburg), but superseded by considerable inter-annual<br />
variations caused by varying meteorological conditions<br />
(UBA 2006c).<br />
94
Chapter C – Effects of Transport and Mobility in the <strong>Alps</strong><br />
O 3<br />
concentration in µg/m 3<br />
Number of stations exceeding value for O 3<br />
Fig. C3‐6: Summer averages at background and traffic stations in the <strong>Alps</strong><br />
(data from AT, CH, DE, FR, SI).<br />
The high concentrations in 2003 are a consequence of extraordinarily<br />
long-lasting hot and dry periods with intensive<br />
insolation, which led to strong ozone formation throughout<br />
large parts of Europe and considerable transport of ozone<br />
into the <strong>Alps</strong> from (western) Central Europe (high peak concentrations<br />
even in remote areas in the northern <strong>Alps</strong>).<br />
Exceeding the target value for the protection of human<br />
health<br />
The EU Directive 2002/3/EC defined as the target value for<br />
the protection of human health the maximum daily 8-hour<br />
mean value of 120 µg/m³, not to be exceeded on more than<br />
25 days per calendar year (averaged over three years). This<br />
target value becomes effective in 2010.<br />
A large number of instances of the target value being exceeded<br />
are observed in high Alpine regions (due to small<br />
temporal variations at high mean concentrations), whereas<br />
several urban traffic stations (with low concentrations during<br />
night time and coinciding with NO peaks) comply with the<br />
target value.<br />
With respect to the severe amount by which the target value<br />
is exceeded in most parts of the <strong>Alps</strong> it is obvious that attainment<br />
will require further action; until now only a minority<br />
of (urban) background stations meet the EU target (see Fig.<br />
C3‐7). Even though most of the traffic stations did not exceed<br />
the future target value (up to 25 exceedances per year),<br />
nearly all stations did exceed the concentration of 120 µg/m³<br />
at least once (long-term target).<br />
Decreasing short-term peak concentrations (1-hour mean)<br />
and increasing occasions on which the target value is exceeded<br />
are not statistically significant (EEA 2003; UBA<br />
2005).<br />
Fig. C3‐7: Percentage of background stations showing where the European<br />
limit value for O 3<br />
for the protection of human health (120 µg/m³ as<br />
maximum daily 8-hour mean value) has been exceeded at all stations<br />
(data from AT, CH, DE, FR, IT, LI, SI).<br />
Long-term exposure of vegetation to ozone<br />
To avoid damage to crops and natural vegetation like forests,<br />
the EU set the long-term target value for AOT40, the<br />
accumulated exposure over a threshold of 40 ppb, calculated<br />
from 1h mean between May and July. The target value is<br />
defined as 18,000 µg/(m³*h) and will be valid from 2010 onwards<br />
(Directive 2002/3/EC).<br />
In the last ten years, a considerable percentage of the background<br />
stations did not comply with the target value for the<br />
protection of vegetation (see Fig. C3‐8).<br />
Number of stations exceeding target value<br />
0-18,000 µg/m 3 *h AOT40 >18,000 µg/m 3 *h AOT40<br />
Fig. C3‐8: Percentages of background stations in the <strong>Alps</strong> deviating from<br />
the European target value for the protection of the vegetation (AOT) (data<br />
from AT, CH, DE, FR, IT, SI).<br />
Short-term threshold values of ozone<br />
Related to short-term effects of ozone on human health, the<br />
information threshold (1h average of 180 µg/m³) and the<br />
alert threshold (1h average of 240 µg/m³) are set in Directive<br />
2002/3/EC. If these thresholds are exceeded, the population<br />
has to be informed about the current situation.<br />
Due to the meteorological conditions, there are large interannual<br />
variations concerning the number of times the thresholds<br />
are exceeded, as well as the number of stations exceeding<br />
the threshold values (see Fig. C3‐9) for information<br />
threshold.<br />
95
Report on the State of the <strong>Alps</strong><br />
Number of days exceeding threshold<br />
Fig. C3‐10 is based on the aggregation of 16 monitoring sites<br />
operated since 2001 and shows the maximum, mean and<br />
minimum annual mean value of this data set. No clear trend<br />
can be identified over this period; the high mean concentrations<br />
in 2003 were caused by adverse meteorological conditions<br />
during the first months of this year. The highest PM10<br />
pollution among these 16 sites was recorded in Klagenfurt<br />
in all years.<br />
Fig. C3‐9: Number of days exceeding or reaching the information threshold<br />
of 180 µg/m³ on background stations in the <strong>Alps</strong> (data from AT, CH,<br />
DE, LI, FR, IT, SI).<br />
Similar variations between the years as for the information<br />
threshold can be observed for the alert threshold of 240<br />
µg/m³ in the last decade. The maximum number of exceedances<br />
at the background stations has been observed in 2003<br />
with 19 days of exceedances. In the same period of ten years<br />
the alert threshold was not exceeded at the traffic related<br />
stations.<br />
C3.1.5 Concentration of PM10 – state and<br />
development<br />
PM10 originates from primary particle emissions as well as<br />
from atmospheric formation of secondary particles.<br />
The main sources of primary particles are road traffic (exhaust,<br />
tire and road abrasion, re-suspension), domestic<br />
heating (mainly wood), industry (process emissions, heat<br />
generation, indiscriminate emissions) including off-road machinery,<br />
construction works (indiscriminate emissions and<br />
off-road machinery), agriculture (indiscriminate emissions<br />
and off-road machinery), and natural sources (erosion, Sahara<br />
dust).<br />
The contributions from different sources vary largely in the<br />
Alpine region, depending on local traffic volume, population<br />
density and industrial activities. The total (estimated) PM10<br />
emissions for the Alpine region are not related to the PM10<br />
pollution in a certain region and will therefore not be given<br />
here.<br />
The main constituents of secondary particles are ammonium<br />
sulphate, ammonium nitrate and VOC, the precursors of<br />
which are SO 2<br />
, NOx and NH 3<br />
emissions. Chemical analyses<br />
available until now indicate that in Alpine basins and valleys<br />
secondary pollutants are of less importance compared to<br />
extra-Alpine regions, where long-range transport contributes<br />
especially to secondary inorganic particles. The formation of<br />
secondary particles in Alpine valleys and basins depends on<br />
the amount of local SO 2<br />
and NOx emissions.<br />
“Trends” of PM10<br />
PM10 monitoring began in the late 1990s. Most monitoring<br />
stations have been installed during the last few years. Therefore<br />
time series of PM10 data are short and do not really<br />
allow trend analyses.<br />
Fig. C3‐10: Maximum, mean and minimum annual mean value of the<br />
PM10 annual mean value operated throughout the period 2001–2005<br />
(data from 16 monitoring sites in AT, DE, LI).<br />
Instances when the limit values of PM10 were exceeded<br />
The limit value set for the daily mean – 50 µg/m³, not to be<br />
exceeded on more than 35 days per calendar year – is violated<br />
in all valleys and basins with high PM10 emissions,<br />
with particularly high numbers above the limit in valleys in<br />
the south-eastern part of Austria (UBA 2006c).<br />
Averaged over the period 2001 to 2005 (with increasing<br />
numbers of PM10 stations), 5% of rural background stations<br />
exceeded the daily limit value, 11% of rural traffic stations,<br />
39% of urban background stations, 66% of urban traffic stations,<br />
and 47% of industrial stations. It can be clearly seen<br />
that going over the PM10 limit value is an urban problem, aggravated<br />
by traffic contributions. Towns south of the central<br />
Alpine ridge suffer levels above the limit value in every year<br />
since the start of monitoring.<br />
According to Directive 1996/62/EC and 1999/30/EC, going<br />
over the limit values requires the Member States to apply<br />
measures to the main sources in order to comply with the<br />
limit value at the attainment date, which was 2005 for PM10.<br />
In the case of PM10 the main sources are most often traffic<br />
and residential heating, locally also industry and construction<br />
sites.<br />
The limit value for the daily mean (50 µg/m³, not to be exceeded<br />
on more than 35 days per calendar year) is much<br />
more stringent than the annual mean value (40 µg/m³), which<br />
is only exceeded at urban locations in Steiermark (Graz,<br />
Köflach).<br />
96
Chapter C – Effects of Transport and Mobility in the <strong>Alps</strong><br />
Main findings<br />
Nitrogen dioxide – state and trends:<br />
NO 2<br />
concentrations are constant or have even increased<br />
in recent years, due to continuously increasing traffic<br />
loads (which compensate for the technical efforts realized<br />
in the last decade for reducing emissions), and probably<br />
due to an increasing NO 2<br />
/NOx ratio of diesel car emissions.<br />
Several traffic stations in the <strong>Alps</strong>, both in urban and rural<br />
locations, exceed the long-term limit value for NO 2<br />
(annual<br />
mean of 40 µg/m³ plus margin of tolerance). It is likely<br />
that it will be difficult to attain the EU limit value in 2010<br />
without additional measures.<br />
Ozone – state and trends:<br />
The EU target values both for the protection of human<br />
health and vegetation – to be met by 2010 – are exceeded<br />
in large parts of the <strong>Alps</strong>, especially in remote areas<br />
with constantly high ozone levels. During the last decade,<br />
an increase in the long-term ozone levels was observed.<br />
Attaining the target values by 2010 seems unlikely. The<br />
information threshold for ozone was frequently exceeded<br />
in the last few years.<br />
Particulate matter – state and trends:<br />
High PM10 levels exceeding the short-term limit value<br />
(daily mean) are observed in most major Alpine valleys<br />
and basins in many towns, especially at kerb side locations.<br />
The major sources are road traffic and domestic<br />
heating (wood burning). Up to now no trend can be detected.<br />
Hot issues:<br />
Effective measures to reduce the traffic emissions of NOx<br />
and PM10 – both for urban and regional traffic as well<br />
as transit – will be inevitable to improve air quality and<br />
achieve compliance with the EU limit and target values for<br />
NO 2<br />
and PM10. For PM10 a reduction of PM emissions<br />
from domestic wood burning will be beneficial.<br />
To achieve compliance with ozone target values, measures<br />
for reducing the emission of ozone precursors at<br />
least at a European scale would be necessary to reduce<br />
the high long-term ozone concentration observed<br />
throughout the <strong>Alps</strong>, even in remote high Alpine regions.<br />
Bibliography<br />
Directive 91/441/EEC (1991): Council Directive 91/441/EEC<br />
of 26 June 1991 amending Directive 70/220/EEC on the<br />
approximation of the laws of the Member States, relating<br />
to measures to be taken against air pollution by emissions<br />
from motor vehicles. Official Journal of the European<br />
Communities L 242.<br />
Directive 91/542/EEC (1991): Council Directive 91/542/EEC<br />
of 1 October 1991 amending Directive 88/77/EEC on the approximation<br />
of the laws of the Member States, relating to the<br />
measures to be taken against the emission of gaseous pollutants<br />
from diesel engines for use in vehicles. Official Journal<br />
of the European Communities L 295.<br />
Directive 94/12/EC (1994): Directive 94/12/EC of the European<br />
Parliament and the Council of 23 March 1994 relating<br />
to measures to be taken against air pollution by emissions<br />
from motor vehicles and amending Directive 70/220/EEC.<br />
Official Journal of the European Communities L 100.<br />
Directive 1996/62/EC (1996): Council Directive 1996/62/EC<br />
of 27 September 1996, on ambient air quality assessment<br />
and management. Official Journal of the European Communities<br />
L 296/55.<br />
Directive 1999/30/EC (1999): Council Directive 1999/30/EC<br />
of 22 April 1999, relating to limit values for sulphur dioxide,<br />
nitrogen dioxide and oxides of nitrogen, particulate matter<br />
and lead in ambient air. Official Journal of the European<br />
Communities L 163/41–60.<br />
Directive 2002/3/EC (2002): Directive of the European parliament<br />
and of the council of 12 February 2002, relating to<br />
ozone in ambient air. Official Journal of the European Communities<br />
L 67/14–30.<br />
EEA – European Environment Agency (2003): Europe’s<br />
environment: the third assessment. Environmental assessment<br />
report No. 10, Copenhagen.<br />
EEA – European Environment Agency (2005): The European<br />
Environment – State and Outlook 2005. Copenhagen.<br />
Hausberger, S. (2006): Emission Levels of Diesel<br />
Cars EURO 1 – EURO 4. Preliminary Results of<br />
measurements under NEDC and CADC conditions.<br />
Proceedings of the conference on “Emission Reduction<br />
Requirements for Cars and Light-Duty Vehicles in View of<br />
the forthcoming EU Regulation (EURO 5)”, Brussels, 2. February<br />
2006.<br />
Herman, F., Smidt, S. (2003): Ozon - die Nr. 1 der Luftschadstoffe<br />
in Österreich. http://bfw.ac.at/600/2231.html<br />
(accessed: 16 May 2006).<br />
Keller, M., Hausberger, S. (2004): Handbook of Emission<br />
Factors from Road Transport. Version 2.1.<br />
Molitor, R., Käfer, A., Thaller, O. (2001): Road freight<br />
transport and the environment in mountainous areas. Case<br />
studies in the Alpine region and the Pyrenees. EEA – European<br />
Environment Agency (ed.), Technical Report No. 68,<br />
Copenhagen.<br />
UBA – Umweltbundesamt (ed.) (2005): Spangl, W., Nagl,<br />
C., Schneider, J. – Jahresbericht der Luftgütemessungen in<br />
Österreich 2004. http://www.umweltbundesamt.at/jahresberichte/<br />
(accessed: 18 May 2006).<br />
UBA – Umweltbundesamt (ed.) (2006a): Stellungnahme<br />
zum CRT-Rußfilter (Continuous Regenerating Trap). http://<br />
www.umweltbundesamt.de/verkehr/techemissmm/technik/<br />
crt/crt.htm (accessed: 15 May 2006).<br />
UBA – Umweltbundesamt (ed.) (2006b): Trends von NOx-<br />
Emissionen und Immissionen in Österreich, 1990–2004.<br />
Report REP0056, Wien (in press).<br />
UBA – Umweltbundesamt (ed.) (2006c): Jahresbericht der<br />
Luftgütemessungen in Österreich 2005. http://www.umweltbundesamt.at/jahresberichte.<br />
97
Report on the State of the <strong>Alps</strong><br />
C3.2 Noise – the health aspect<br />
In Europe, transport (road, rail and air traffic) is the<br />
most important source of community noise. Approximately<br />
30% of the European Union‘s population (EU-15)<br />
is exposed to levels of road traffic noise of more than<br />
55 dB(A) (WHO-The PEP 2004 a). Exposure to high noise<br />
levels has decreased in some countries since 1980 due<br />
to technological measures, noise barriers and spatial<br />
planning. <strong>How</strong>ever, due to the expected growth in traffic,<br />
extra measures will be needed.<br />
In several surveys it has been proved that a large percentage<br />
of the population feel disturbed by traffic noise.<br />
So the WHO (2000) states that noise is the only environmental<br />
factor for which complaints have increased<br />
since 1992.<br />
What is noise?<br />
Noise is sound which is perceived as a molestation. From<br />
a scientific perspective only sound pressure levels, not<br />
noise, can be measured.<br />
Because of the logarithmic scale of sound / noise measurement<br />
a reduction of 10 dB(A) is perceived as a bisection<br />
of sound, a reduction of road traffic noise of only 3 dB(A)<br />
means a reduction in traffic quantity of 50% (SRU 2005).<br />
Sound perception is individual: certain sounds are perceived<br />
as noise and others not – sometimes even if the<br />
same sound pressure level is measured (see Fig. C3-12).<br />
Noise is not only an annoying disturbance of human<br />
quality of life it also has to be considered as a severe<br />
threat to human health. The scientific evidence for the<br />
adverse health effects of noise is growing. Good evidence<br />
was found for effects on communication, school<br />
performance, sleep and temper, as well as on cardiovascular<br />
effects.<br />
C3.2.1 Impacts of traffic noise on human<br />
health and well-being<br />
Health and health effects<br />
The WHO defines health as the “state of complete physical,<br />
mental and social well-being and not merely the absence of<br />
disease or infirmity“ and regards health as one of the fundamental<br />
human rights (SRU 1999).<br />
Quality of life<br />
Objective factors + individual<br />
perceptions:<br />
Labour market Accessibility<br />
Environment Landscape<br />
Living conditions Social contacts<br />
Recreation Health care services<br />
Public safety Public service supply<br />
Transport<br />
effects<br />
Public health<br />
Psychological health<br />
(e.g. stress factors)<br />
Physical health (e.g. accidents,<br />
noise, air pollution)<br />
Social health (e.g. neighbourhoods,<br />
social safety)<br />
Fig. C3-11: Overall interrelation of human health and transport effects.<br />
Noise does not cause a specific “noise disease” but acts as a<br />
stress factor to the human body (see Fig. C3-11). Unexpected<br />
sound rings an alarm in the human body, which releases<br />
certain hormones into the bloodstream. As a stressor noise<br />
can evoke indirect effects like disturbances of concentration,<br />
sleep disruption, heart disease, psychological symptoms,<br />
changes in social behaviour such as aggression and may<br />
play an important role in the aggravation of health problems.<br />
Fig. C3-13 (next page) shows one model depicting the possible<br />
mechanism of noise-induced health effects and their<br />
interactions (SRU 1999, WHO-The PEP 2004a).<br />
Fig. C3-12: Sound pressure and human perception (Source: LfU 2003).<br />
Reactions to noise are very individual and depend on individual<br />
health, age, living environment as well as on social values.<br />
The WHO PEP-Project (Pan-European Programme on transport,<br />
health and environment) differentiates health impacts<br />
on adults and health impacts on children.<br />
For adults a review of epidemiological studies shows that<br />
noise exposure can produce various effects, including annoyance<br />
and sleep disturbance, but the evidence for a<br />
causal association between noise exposure and increased<br />
cardiovascular health risks is limited (see Fig. C3-14, next<br />
page, WHO-The PEP 2004a). No definite conclusion can be<br />
drawn for impacts on mental health, but a significant association<br />
between self-reported noise exposure and depression or<br />
cognitive failures was observed.<br />
For children the possible effects of noise on cognitive functioning<br />
were studied the most frequently. They show sufficient<br />
evidence that noise exposure affects children’s cognition,<br />
motivation and annoyance and influences their aptitude<br />
(WHO-The PEP 2004a).<br />
Dimension of health effects evoked by traffic noise<br />
Some scientific models give a first estimation of the dimension<br />
of traffic noise-related health effects: The German<br />
Federal Environmental Agency (UBA) calculated in models<br />
that about 12 Mio Germans expect higher risks of ischaemic<br />
heart diseases. According to estimations of the Austrian<br />
98
Chapter C – Effects of Transport and Mobility in the <strong>Alps</strong><br />
noise exposure<br />
physical<br />
and social<br />
environment<br />
life style<br />
appraisal as noise<br />
vegetative response<br />
processing by the organism<br />
genetic and acquired<br />
characteristics<br />
(attitude, sensitivity,<br />
coping style etc.)<br />
disturbance of sleep, activities<br />
performance, concentration<br />
annoyance and stress<br />
somatic and psychosomatic<br />
responses (blood dynamics,<br />
hormones, lipoprotein levels)<br />
cardiovascular, psychiatric<br />
disorders<br />
dynamic demographic, social, cultural, technological and economic environment<br />
Fig. C3‐13: Conceptual model representing relation between noise exposure, health and quality of life (Source: WHO-The PEP 2004 a, slightly modified).<br />
Ministry for Environment about 32% of the Austrian population<br />
are exposed to road noise of about 60 dB during the day<br />
or 50 dB at night. About 9.4% of Austrians feel strongly or<br />
very strongly disturbed by noise of which 61% attribute this<br />
to road noise (Dörfler 2000; Statistik Austria 2005).<br />
Latest studies reveal that there are no thresholds for risk increase,<br />
meaning cardiac risks may also occur as well with<br />
moderate noise immissions.<br />
Another approach to describe the dimension of health effects<br />
evoked by traffic noise is to quantify them in terms of monetary<br />
values, in years of life lost (YOLL) or disabled adjusted<br />
life years (DALY) (BUWAL 2003, WHO-The PEP 2004 a).<br />
“It has been estimated that for Europe as a whole, the overall<br />
external costs (abatement costs) of road- and rail-traffic<br />
noise amount to 0.4% of the total GDP” (ECMT 1998, cit.<br />
from WHO-The PEP 2004 a, p. 50).<br />
Human well-being and quality of life<br />
”Well-being”, an integral part of the WHO definition of health,<br />
means, in addition to physical health, things such as the possibility<br />
of taking part in social life, having social support, not<br />
suffering from violence, having no fear, being in a good temper<br />
and having the feeling of power and self-confidence.<br />
Human well-being is affected by traffic noise in terms of communication<br />
disturbances inside and outside houses, loss of<br />
recreation values etc. One crucial element of social quality of<br />
life is human communication. Long term noise exposure may<br />
retard linguistic development as well as the reading and writing<br />
abilities of children. Noise may also decrease communication<br />
in neighbourhoods. Some studies show more social<br />
distance between neighbours in densely populated areas<br />
with high traffic loads (Höger & Schreckenberg 2003).<br />
As a side-effect of the permanent expansion of traffic infrastructure<br />
and volume an increasing loss of really “silent areas”<br />
has been observed, where silence in terms of absence of<br />
human-made sounds can be explored. This means the sacrifice<br />
of human life’s qualities, such as areas for contemplation,<br />
undisturbed nature appreciation or the experience of<br />
solitude.<br />
Silent moments in the Kaiser mountain range (Photo: S. Marzelli).<br />
C3.2.2 Data sources and indicators<br />
By the time of the deadline for data submission to this report<br />
(middle of April 2006), strategic noise maps were not available.<br />
Actually an overview on traffic infrastructures due to<br />
noise mapping according to the thresholds of the EU Directive<br />
2002/49 was planned, but no data (except for the roads of the<br />
German part of the <strong>Alps</strong>) have been delivered. An overview<br />
of road, railway and airport infrastructure for which strategic<br />
noise maps and action plans were made was not available<br />
until the data deadline.<br />
Indicator C9-1: Emission of road traffic noise<br />
This indicator has been recommended by the WG<br />
“Environmental Objectives and Indicators”. <strong>How</strong>ever as<br />
only very few data are available this would require the calculation<br />
of noise emission from traffic flows on high level<br />
roads. Meanwhile the WG Transport has suggested using<br />
indicators based on the Directive 2002/49/EC. According<br />
to this directive up to 2007 strategic noise maps for highfrequented<br />
roads, railways and airports will be provided<br />
(see also chap. C3.2.6 on legal frameworks). Therefore the<br />
indicator has been changed into traffic noise indicated by<br />
noise impacts of roads, railways and airports.<br />
99
Report on the State of the <strong>Alps</strong><br />
Indicator C9-2: Noise immissions based on LUCAS<br />
field data<br />
The LUCAS survey delivers unique data for Austria, Germany,<br />
France and Italy on the subjective perception of<br />
noise. Based on these field data collected at certain points<br />
in a regular grid (18 x 18 km) it has been planned to show<br />
in a case study the present noise immission as subjective<br />
estimation. But as for Indicator C9-1 no data were delivered<br />
by the time of the editorial deadline of this report.<br />
Due to the data situation which is expected to improve<br />
from 2007 on – thanks to Directive 2002/49/EC – the<br />
indicators should be reformulated. It would be better to<br />
show areas and persons exposed to certain noise levels<br />
(dependent on thresholds) than showing emissions and<br />
immission. This information should be provided by the<br />
strategic noise maps in the future.<br />
This leads to the effect that the same noise emission level<br />
leads to much higher noise immission in Alpine areas. A<br />
comparison by Scheiring (1988) discusses the difference of<br />
a motorway near Hamburg and the Inn Valley motorway in<br />
Tirol. Despite higher traffic loads in the flat land a 40 dB(A)<br />
level is reached within 416 m, whereas in the Inn Valley it<br />
takes about 2000 m for the noise to decline to the same level<br />
(SRU 2005).<br />
For topographical reasons traffic infrastructures are mainly<br />
situated in the valley bottoms which often also feature high<br />
population densities. Due to the above-mentioned self-amplifying<br />
effects, also illustrated in Fig. C3-15, it could be<br />
expected that the population in Alpine areas is exposed to<br />
higher percentages of traffic noise than the population in the<br />
lowlands.<br />
Indicator C9-3: Expenditure on noise abatement<br />
measures along main thoroughfares<br />
Investments for noise abatement are one of the major<br />
measures for noise prevention from human living spaces.<br />
Measures are mainly taken by governmental bodies<br />
for traffic infrastructures where this is mandatory by the<br />
respective national legislation. The economic aspect of<br />
noise is highlighted in an Austrian case study (see chap.<br />
C3.2.5).<br />
C3.2.3 What is different in mountainous<br />
areas?<br />
Noise emission in mountains is often different compared to<br />
lowlands due to different traffic infrastructures (bridges, tunnels,<br />
viaducts) from where sound spreads differently. Also,<br />
motor sounds are louder in mountain areas as cars are driven<br />
in lower gears and with higher rotation speed.<br />
Noise spreads quite differently in mountainous areas than<br />
in lowland areas. Topography leads to an effect such as in<br />
amphitheatres (see Fig. C3-14), so due to sound reflections<br />
from valley slopes noise is also perceived at higher altitudes.<br />
Noise absorption by soil and vegetation is less effective on<br />
slopes than in flat areas. Topography also alters meteorological<br />
conditions (inversions, wind systems) which remarkably<br />
influence noise spread.<br />
amphitheatre<br />
effect<br />
ducting<br />
in slope wind<br />
layers<br />
Fig. C3‐14: Noise propagation (Source: ALPNAP 2006).<br />
multiple<br />
reflections<br />
Distance from motorway (in meter)<br />
Fig. C3-15: Noise spread in mountainous areas (Source: EEA 2001, p. 22).<br />
C3.2.4 Noise emissions and immissions<br />
Road noise emission<br />
Main sources of road noise are engine noise and the rolling<br />
noise made by the vehicles on the road. From a speed of<br />
40 km/h (cars) and 60 km/h (trucks) the engine sound becomes<br />
less relevant than the rolling noise. In general heavy<br />
goods vehicles cause disproportionally more noise as they<br />
produce the same noise as up to ten cars at the same<br />
speed.<br />
Map C3‐2 (next page) shows the road sections in the German<br />
part of the AC which are used by more than 6 million vehicles<br />
per year and for which strategic noise maps and action<br />
plans will be worked out in the first phase of implementing<br />
the Directive 2002/49/EC.<br />
Road noise emissions are monitored in Switzerland within<br />
the project “Monitoring flankierende Maßnahmen Teilprojekt<br />
Umwelt – MFM-U” (see Fig. C3-16, next page). Along the A2<br />
are five measure points and at the A13 one measure point for<br />
air and noise emissions (near Basel noise and air quality are<br />
measured at different locations). According to this monitoring<br />
road noise level at night (from 10 p.m. to 6 a.m.) is about 6-7<br />
dB(A) lower than during the day time. Stations which show<br />
the highest levels at day time are also the most affected stations<br />
at night time. The noise levels in 2004 did not change<br />
compared with 2003, a trend is not visible (BUWAL 2005).<br />
Height in meter<br />
100
Chapter C – Effects of Transport and Mobility in the <strong>Alps</strong><br />
Map C3‐2: Major road sections with more than 6 Mio vehicle passages a year (German AC area).<br />
Hardwald (BL)<br />
Tenniken (BL)<br />
Reiden (LU)<br />
A2<br />
Erstfeld (UR)<br />
A13<br />
Rothenbrunnen<br />
(GR)<br />
Moleno (TI)<br />
Camignolo (TI)<br />
In Switzerland data on railway noise are monitored by the<br />
Bundesamt für Verkehr (BAV) at different railways (see<br />
Fig. C3‐17). The results are regularly updated in yearly reports<br />
by the BAV. Some key results from the Gotthard line<br />
are that at night time noise is dominated by the higher frequency<br />
of freight trains and their double length compared<br />
with passenger trains. But also at day time freight trains are<br />
more responsible for rail noise, even if passenger trains pass<br />
over more frequently. In the yearly average railway noise level<br />
at night is only about 0.5 dB(A) lower than at daytime due<br />
to the dominance of freight trains. Road noise is on average<br />
about 5 dB(A) lower at night time.<br />
Fig. C3‐16: Measure points for road noise emission in Switzerland MFM-U<br />
(Source: BUWAL 2005).<br />
Railway noise emission<br />
Noise emission by rail comes from three major sources: up to<br />
about 80 km/h the engine’s sound is predominant, between<br />
90 and 270 km/h the wheel sound is more important and<br />
above 300 km/h the wind sound of a high speed train is most<br />
important. Sounds of brakes, curves, uneven rails, and ventilation<br />
also are relevant for noise emissions.<br />
Noise emissions from railways are perceived as less annoying<br />
than the noise of cars or aeroplanes at the same sound level.<br />
Due to this fact in Germany, Austria and Switzerland railways<br />
get a so-called “railway bonus”, a reduction of five dB (A) of<br />
the outcome of the railway noise calculation (WHO-The PEP<br />
2004a). <strong>How</strong>ever, a recent study points out that the bonus is no<br />
longer justified (Lercher 2007).<br />
Fig. C3‐17: Measure points monitoring railway noise in Switzerland<br />
(Source: BAV 2004).<br />
101
Report on the State of the <strong>Alps</strong><br />
Aircraft noise<br />
Noise emissions from aircraft are very irregular and difficult to<br />
express as an average number. Measuring of aviation noise<br />
is complex, affects very large areas of some tens or hundreds<br />
of square kilometres and it is a long term task. Therefore<br />
aircraft noise is mostly calculated by noise models. The<br />
main noise emissions are caused through take-off and landing<br />
activities. As only three international airports are situated<br />
in the <strong>Alps</strong> commercial aircraft noise can be considered as a<br />
minor issue compared to road and railway traffic noise.<br />
Noise immissions<br />
Noise immissions may be analysed in terms of “objective”<br />
data based on measurements and on “subjective” data<br />
based on census or field data providing the disturbance of<br />
traffic noise as perceived by individual persons. In any case<br />
a status of traffic noise immissions is not available specifically<br />
for the Alpine Convention area.<br />
Noise immission based on objective data<br />
A first impression of noise immissions can be derived for<br />
Austria from the reports summarising the results of an OECD<br />
questionnaire. Based on noise immission plans, railway<br />
noise cadastre and air noise zones data on noise immissons<br />
have been compiled. Impacts on communities through noise<br />
immissions are displayed in Tab. C3‐3.<br />
LAeq,day or<br />
Laeq,night+10dB<br />
Municipalities<br />
below 20,000<br />
Inhabitants [%]<br />
Municipalities<br />
over 20,000<br />
Inhabitants [%]<br />
(without Wien)<br />
Pro-rata<br />
average for<br />
Austria<br />
>= 55 61.6 51.1 60.9<br />
>= 60 29.2 29.2 32.2<br />
>= 65 5.0 18.5 9.8<br />
>= 70 2.0 6.4 4.6<br />
>= 75 0.0 2.0 1.0<br />
Tab. C3‐3: Noise immission by road traffic in Austria (Source: excerpt from<br />
UBA 2001, <strong>English</strong> translation).<br />
Noise from rail traffic has been compiled in Austria<br />
based on the railway noise cadastre for night time (years<br />
1993/94); residential areas and inhabitants on both sides<br />
of railways were taken into consideration. The result<br />
presented in Tab. C3‐4 shows (the number of) people<br />
exposed to railway noise in three different noise zones at<br />
NUTS-2 level.<br />
These data from Austria highlight the general situation at administrative<br />
level but do not allow a distinctive conclusion for<br />
the Alpine Convention area. Due to topographic reasons it<br />
may be estimated that people in mountainous areas of the<br />
Alpine Convention are disturbed to a higher extent.<br />
Federal State<br />
Inhabitants<br />
Affected inhabitants in zone with<br />
noise level Lr* (night)<br />
Inhabitants (%) in zone with Lr* (night)<br />
55-60 dB 60-65 dB >65 dB 55-60 dB 60-65 dB >65 dB<br />
Burgenland 270,880 11,046 341 40 0.39 0.13 0.01<br />
Kärnten 547,796 10,468 5,015 1,021 1.91 0.92 0.19<br />
Oberösterreich 1,333,480 34,687 17,095 7,110 2.6 1.28 0.35<br />
Salzburg 482,365 22,008 11,707 7,501 4.56 2.43 1.56<br />
Steiermark 1,184,720 27,536 11,810 2,697 2.32 1.00 0.23<br />
Tirol 631,410 12,935 9,540 8,243 2.05 1.51 1.31<br />
Vorarlberg 331,472 5,421 3,745 1,417 1.64 1.13 0.43<br />
Austria total 7,795,786 184,061 89,763 38,122 2.36 1.15 0.49<br />
Tab. C3‐4: Inhabitants affected by railway noise in Austria (Source: excerpt from UBA 2001 <strong>English</strong> translation).<br />
* Lr means a weighted sound pressure level under 5 dB<br />
Pilot project noise data base in Switzerland<br />
Switzerland does not apply the Directive 2002/49/EC but<br />
with its so-called “Lärmdatenbank” (LDBS) it provides<br />
a collection and delivery of noise data according to EU<br />
norms. Actually the LDBS will not only differentiate between<br />
noise types (road, rail, aviation) but additionally<br />
deliver noise data for the whole territory, data on recreation<br />
areas and “silence areas”. In two phases data will be<br />
available for an overview based on federal data and a<br />
detailed version based on higher resoluted data at Cantons<br />
level. Till middle of April 2006 data for about 100 km²<br />
were available for the Canton Luzern (see Fig. C3‐18).<br />
(Poldervaart & Jordi 2005; BAFU 2005, 2006; Ingold<br />
2006).<br />
Fig. C3‐18: Pilot maps from the Swiss LDBS, area of Luzern displaying<br />
road noise (left) and railway noise (right).<br />
102
Chapter C – Effects of Transport and Mobility in the <strong>Alps</strong><br />
This approach marks a very advanced state of noise analysis<br />
which might be a standard for treating the topic in the whole<br />
of the <strong>Alps</strong>.<br />
C3.2.5 Noise abatement measures<br />
An estimate of measures of noise abatement is difficult as<br />
central documentation does not exist in Alpine countries.<br />
<strong>How</strong>ever some figures, based on numbers from Austria may<br />
underline noise abatement as a cost intensive issue (Tab. C3-5).<br />
Year on roads in buildings total<br />
1990 13.0 6.5 19.4<br />
1991 12.6 6.4 18.9<br />
1992 20.2 8.6 28.8<br />
1993 12.2 7.9 20.1<br />
1994 10.5 7.4 17.9<br />
1995 8.0 6.7 14.7<br />
1996 6.8 5.0 11.8<br />
1997 5.1 5.9 10.9<br />
1998 6.0 4.7 10.7<br />
1999 9.9 4.0 13.9<br />
2000 11.4 2.8 14.1<br />
Tab. C3‐5: Noise abatement expenditures along Bundesstraßen (federal<br />
roads) in Austria (roads / buildings) from 1990-2000 in Mio EUR (Source:<br />
UBA 2004, <strong>English</strong> translation).<br />
An increase in expenditure for road noise abatement is estimated<br />
by the Austrian ASFINAG according to Fig. C3‐19.<br />
Directive 2002/49/EC defines a common approach among<br />
all EU Member States which is intended to avoid, prevent or<br />
reduce harmful effects of environmental noise. For this reason<br />
noise indices (L den and L night ) for the use of strategic<br />
noise mapping have been defined to harmonise data in EU<br />
Member States. After implementation the Directive will offer<br />
to the public strategic noise maps for conurbations, major<br />
roads, railways and airports. The Member States were to<br />
communicate to the Commission not later than 18 July 2005<br />
any relevant limit values expressed in L den and L night and<br />
where appropriate L day and L evening for road-traffic noise,<br />
rail-traffic noise, aircraft-noise around airports and noise on<br />
industrial activity sites. <strong>How</strong>ever this information has not<br />
been made available from the Member States.<br />
Thresholds for health effects have been defined manifold,<br />
some common approaches have been compiled by WHO<br />
(see Tab. C3‐6, next page; source WHO 2000).<br />
What is ...?<br />
…sound pressure level: The sound pressure level (L)<br />
is a measure of the air vibrations that make up sound.<br />
Because the human ear can detect a wide range of sound<br />
pressure levels (from 20 micro-Pascal up to 200 Pascal),<br />
they are measured on a logarithmic scale with units of<br />
decibels (dB) to indicate the loudness of a sound.<br />
…a-weighted sound pressure level: The human ear is<br />
not equally sensitive to sounds at different frequencies.<br />
To take account of the loudness of a sound a spectral<br />
sensitivity factor is used to weigh the sound pressure<br />
level at different frequencies (A-filter). These, so called A-<br />
weighted sound pressure levels are expressed in dB(A).<br />
…equivalent sound levels: When sound levels fluctuate<br />
in time, the equivalent sound level is determined over a<br />
specific period of time. For this purpose the A-weighted<br />
sound level is averaged over a period of time (T), using<br />
a prescribed procedure (symbol L,T). A common exposure<br />
period T in community studies/regulations is from<br />
7 to 23 hours (L Aeq ,7-23 hr).<br />
Fig. C3‐19: Noise abatement expenditure on the existing highway and federal<br />
road system according to the Austrian ASFINAG (including estimates<br />
for years 2004 and 2005) (Source: UBA 2004, <strong>English</strong> translation).<br />
For railways the use of the braking disc system on freight<br />
trains would allow a further reduction of noise of almost 10<br />
dB.<br />
C3.2.6 Legal framework and thresholds<br />
According to the Traffic Protocol of the Alpine Convention<br />
the Member States have agreed to take enforced measures<br />
for noise abatement due to specific topography of the <strong>Alps</strong><br />
(Art. 3 d), to reduce step-by-step pollution and noise emission<br />
of all transport systems [Art. 7, (2)] and they have agreed to<br />
reduce environmental impacts of air traffic [Art. 12 (1)].<br />
…day-night level (L dn ): This metric is used in environmental<br />
impact assessment as it correlates much better with<br />
community annoyance than the equivalent sound level.<br />
L dn is the equivalent sound level over 24 hours, increasing<br />
the sound levels during the night (11 p.m. to 7 a.m.)<br />
by 10 dB(A) since noise during the evening and the night<br />
is perceived as more annoying than during daytime.<br />
…day-evening-night level (L den ) is constructed in a<br />
similar way as the L dn , increasing the sound levels in the<br />
evening (7 to 11 p.m.) with 5 dB(A) and those during the<br />
night (11 p.m. to 7 a.m.) with 10 dB(A).<br />
…night level (L night ) is the equivalent sound level over<br />
night (11 p.m. to 7 a.m.).<br />
…sound exposure level (SEL) of a noise event, such as<br />
the noisy passage of an aircraft, is the equivalent sound<br />
level during the event normalised to a period of one second<br />
(WHO-The PEP 2004 a, p. 17).<br />
103
Report on the State of the <strong>Alps</strong><br />
Guideline values for community noise in specific environments<br />
Environment Critical health effect(s) Time base L Aeq (dB) L Amax , fast (dB)<br />
Dwellings<br />
Indoors<br />
Speech intelligibility and moderate annoyance,<br />
daytime and evening<br />
16 hours 35 –<br />
Inside bedrooms Sleep disturbance (night) 8 hours 30 45<br />
Outside bedrooms Sleep disturbance, window open (outdoor values) 8 hours 45 60<br />
Schools and preschools<br />
Disturbance of speech intelligibility, information<br />
Classrooms indoors<br />
extraction and message communication<br />
Playground outdoors<br />
Hospitals<br />
Wards/Rooms indoors<br />
Treatment rooms<br />
indoors<br />
Other<br />
Outdoor living area<br />
Outdoors in parkland<br />
and conservation areas<br />
Sleep disturbance (night-time)<br />
Sleep disturbance (daytime and evenings)<br />
Interference with rest and recovery<br />
Serious annoyance, daytime and evening<br />
Moderate annoyance, daytime and evening<br />
During class 35 –<br />
8 hours<br />
16 hours<br />
16 hours<br />
16 hours<br />
Disruption of tranquillity –<br />
Tab. C3‐6: Compilation of threshold (Source: excerpt from WHO 2000).<br />
30<br />
30<br />
As low as<br />
possible<br />
55<br />
50<br />
40<br />
–<br />
–<br />
–<br />
Existing quiet outdoor areas should be<br />
preserved and the ratio of intruding noise to<br />
natural background sound should be kept low.<br />
Main findings<br />
Status<br />
Topography, meteorological conditions, and construction<br />
needs of transport infrastructure lead to a higher exposure<br />
of Alpine areas to traffic noise compared to lowlands.<br />
Due to concentration of settled areas, traffic infrastructure<br />
and above mentioned conditions also the population<br />
in the <strong>Alps</strong> may be exposed to traffic induced noise at a<br />
higher proportion than people in the lowlands.<br />
Trends<br />
As traffic loads on roads, rails and in the air are expected<br />
to increase, the emission and immission of noise will also<br />
increase. Correspondingly an increase in costs for noise<br />
abatement measures may be expected.<br />
On the other hand due to the implementation of the “Technical<br />
Specification for Inter-operability” (TSI) regarding railway<br />
noise, some specific emission levels may be reduced<br />
by technical measures in the future. The Directive 2002/49/<br />
EC on noise will give better information to the public. The<br />
action plans which have to be made in accordance with<br />
the Directive until July 2008 might force the Member<br />
States to take further action.<br />
Hot issues<br />
All major transport routes touching populated areas, in<br />
particular valleys, may be considered as hot spots of<br />
noise impacts in the Alpine Convention area.<br />
104
Chapter C – Effects of Transport and Mobility in the <strong>Alps</strong><br />
Bibliography<br />
ALPNAP (2006): Workshop presentation general. Workshop<br />
Turin, March 2006.<br />
BAFU – Bundesamt für Umwelt (2005): Pilotprojekt Lärmdatenbank<br />
Schweiz (LDBS). Projekt-News April 2005.<br />
BAFU – Bundesamt für Umwelt (2006): Pilotprojekt Lärmdatenbank<br />
Schweiz (LDBS). Projekt-News März 2006.<br />
BAV – Bundesamt für Verkehr (2004): Monitoring Eisenbahnlärm.<br />
Jahresbericht 2003.<br />
WHO (2000): Transport, environment and health. WHO regional<br />
publications. European series, No. 89.<br />
WHO – The PEP (2004a): Transport-related Health Effects<br />
with a particular Focus on Children. Assessment of health impacts<br />
and policy options in relation to transport-related noise<br />
exposures. Topic paper noise. RIVM rapport. Bilthoven.<br />
WHO – The PEP (2004b): Transport-related Health Effects<br />
with a particular Focus on Children. Assessment of health<br />
impacts and policy options in relation to transport-related<br />
noise exposures. Synthesis report.<br />
BUWAL – Bundesamt für Umwelt, Wald und Landschaft<br />
(2003): Monetarisierung verkehrslärmbedingter Gesundheitsschäden.<br />
Umwelt-Materialien Nr. 166, Bern.<br />
BUWAL – Bundesamt für Umwelt, Wald und Landschaft<br />
(2005): Umweltmonitoring MFM-U; Jahresbericht 2004: Luftund<br />
Lärmmessungen. Umwelt-Materialien Nr. 205, Bern.<br />
BUWAL-INFO (2006): Pilotprojekt Lärmdatenbank Schweiz<br />
(LDBS) http://www.buwallaerm.unibe.ch/cms/daten/dokus/<br />
laermdatenbank_de_xpe_pub.pdf (accessed: 12 May 2006).<br />
Dörfler, H. (2000): Umweltbedingungen, Umweltverhalten.<br />
Ergebnisse des Mikrozensus Dezember 1998. Beiträge zur<br />
österreichischen Statistik. Heft 1.325, Statistik Österreich, Wien.<br />
EEA – European Environment Agency (2001): Road freight<br />
transport and the environment in mountainous areas. Case<br />
studies in the Alpine region and the Pyrenees. Technical Report<br />
No. 68.<br />
EUROSTAT (2003): The Lucas survey. European statisticians<br />
monitoring territory. Luxembourg.<br />
Höger, R., Schreckenberg, D. (2003): Lärm und soziale<br />
Lebensqualität. Modellvorstellungen über Wirkungszusammenhänge.<br />
In: Guski, R. (Ed.): Lärmwirkungen. (in press).<br />
Ingold, K. (2006): Pilotprojekt Lärmdatenbank Schweiz<br />
– News April 2006, BAFU – Bundesamt für Umwelt, Abt.<br />
Lärmbekämpfung.<br />
Lercher, P. et al. (2007): Public Health Studie BBT. Erstellt<br />
im Auftrag des BBT-SE im Zuge des grebzüberschreitenden<br />
UVP-Verfahrens. Innsbruck.<br />
Poldervaart, P., Jordi, B. (2005): Lärmdatenbank soll Lücken<br />
schließen. In: Umwelt 2/2005. Bundesamt für Umwelt,<br />
Bern.<br />
Scheiring, H. (1988): Lärmbelastung durch Autobahnen in<br />
Berggebieten und im Flachland. Bericht an die Landesregierung.<br />
Amt der Tiroler Landesregierung, Landesbaudirektion,<br />
Innsbruck.<br />
SRU – Sachverständigenrat für Umweltfragen (1999):<br />
Umwelt und Gesundheit, Risiken richtig einschätzen. Sondergutachten<br />
des Sachverständigenrates für Umweltfragen.<br />
Baden-Baden.<br />
SRU – Sachverständigenrat für Umweltfragen (2005):<br />
Umwelt und Straßenverkehr. Sondergutachten des Sachverständigenrates<br />
für Umweltfragen. Baden-Baden.<br />
STATISTIK AUSTRIA (2005): Statistische Nachrichten<br />
5/2005.<br />
UBA – Umweltbundesamt (2001): Umweltsituation in Österreich.<br />
Sechster Umweltkontrollbericht. Wien.<br />
UBA – Umweltbundesamt (2004): Umweltsituation in Österreich.<br />
Siebter Umweltkontrollbericht. Wien.<br />
105
Chapter D – Alpine Relevant Traffic Policies and Cooperation in the <strong>Alps</strong><br />
D<br />
Relevant Traffic Policies<br />
for the <strong>Alps</strong> and<br />
the Alpine Cooperation<br />
On 26 May 2006 a group of residents from the border region<br />
between Tirol and Alto Adige/Südtirol blocked the Brenner<br />
pass for some hours to demonstrate for a more consistent<br />
reduction of air pollutants and noise exposure. They called<br />
for an extension of the night driving ban for heavy traffic, so<br />
far imposed only in Tirol, to the total route between Rosenheim<br />
(DE) and Verona (IT) and suggested raising the particular<br />
heavy vehicle fees up to the existing high level established<br />
in Switzerland.<br />
For the last 15 years, however, it is not only those citizens<br />
affected by the main Alpine transit routes who are concerned<br />
about the pressure on environment and health. Politicians<br />
have also turned their attention to the Alpine regions and the<br />
increasing traffic development.<br />
The Alpine Convention, introduced in chapter D1, considers<br />
traffic policy as well as other issues for preserving a sustainable<br />
development of the Alpine regions.<br />
To act effectively, different cooperation bodies, discussed<br />
in chapter D2, have been set up in the Alpine Convention<br />
dedicated to traffic subjects.<br />
EU policies, the subject of chapter D3, have also recognised<br />
the need for a coherent and sustainable transport policy<br />
(e.g. Eurovignette Directive, anchoring the “polluter-pays”<br />
principle).<br />
National transport policies<br />
To meet requirements for sustainable transport plans and<br />
strategies for sustainable transport have also been developed<br />
on national level, implementing and further structuring<br />
EU policies. The national transport policies described in<br />
chapter D4 have to satisfy social and economic requirements<br />
and at the same time increase transport safety and assure<br />
an efficient use of energy and a clean environment.<br />
Infrastructure policies<br />
Policies supporting the upgrading or construction of road and<br />
rail infrastructures (see chapter D5) as well as sea lines, are<br />
some of the major subjects of debates for solving the Alpine<br />
transport problems.<br />
Policies managing freight transport<br />
Generally, a lot of attention is paid to freight transport and the<br />
according policies which are explored in chapter D6.<br />
The specific topographical situation of the <strong>Alps</strong> in combination<br />
with the growing traffic volume often causes traffic jams<br />
at bottlenecks for road freight traffic and in some cases safety<br />
problems. Therefore inventories of the measures for regulating<br />
heavy goods traffic were conducted in each country and<br />
control systems were advanced. <strong>How</strong>ever, the implementation<br />
of the Zurich Declaration developed beyond mere safety<br />
issues: Coordinated action was taken to regulate road traffic<br />
and to encourage a shift to alternative modes of transport,<br />
as for example the combined transport of goods by trucks<br />
and railway.<br />
Combined transport could help lighten the load of road traffic<br />
but it is still limited as rail services often show functional<br />
inefficiencies. This calls for coordinated action, especially on<br />
key corridors between Germany, Austria and Italy, Switzerland<br />
and Italy and France and Italy. The emphasis is now<br />
placed on four new corridors which are expected to offer real<br />
alternatives to growth in road traffic: the Franco-Italian cross<br />
border base tunnel (Lyon-Turin-Ljubljana route), the Lötschberg<br />
base tunnel (opening planned for December 2007), the<br />
Gotthard base tunnel, and the Brenner base tunnel between<br />
Austria and Italy (completion for both expected by 2015). For<br />
all these infrastructure projects, existing rail corridors have to<br />
be improved and coordinated measures have to be taken to<br />
lighten road traffic on the major routes.<br />
Road pricing is considered to be a crucial instrument for<br />
regulating traffic flows. Based on a European directive on<br />
the charging of heavy goods vehicles, each country released<br />
specific regulations. Thereby so far only in Switzerland the<br />
external costs of using transport infrastructure (e.g. environmental<br />
and social burdens, accidents, land use etc.)<br />
are equally considered resulting in comparably high heavy<br />
vehicle fees.<br />
Passenger transport policies<br />
Not only the freight traffic depends on the transport infrastructure<br />
– passenger transport is equally important and is<br />
discussed in chapter D7. To satisfy the growing demand, integrated<br />
transport systems were for example implemented<br />
in Italian towns with more than 30,000 inhabitants. Public<br />
transport was improved by establishing new tramways<br />
(Grenoble), additional regional bus systems (between Telfs<br />
and Schwaz in Tirol) or integrated timetables for local trains<br />
(BayernTakt in Bayern). Nevertheless private cars are expected<br />
to remain the principal mode of transport.<br />
Traffic to leisure and tourist destinations makes up an<br />
increasing part of the traffic volumes primarily as a trend<br />
towards shorter but more frequent holidays can be observed.<br />
This part of the report will present EU-funded projects that<br />
address particular problems related to tourist and leisure traffic<br />
such as travel to resorts and on-site car-free mobility.<br />
Success stories<br />
Besides all the difficulties of drawing up policies in a multinational<br />
field, there have been some successful implementations<br />
of transport policies which are mentioned in chap. D8.<br />
If all political agreements concerning the sustainable development<br />
of the <strong>Alps</strong> are put into practice by the joint efforts of<br />
the Alpine countries, the residents of the Brenner region can<br />
easily be pleased, and involved in a common effort to preserve<br />
the <strong>Alps</strong> as a unique living space within Europe.<br />
107
Report on the State of the <strong>Alps</strong><br />
D1<br />
The Transport Agenda of<br />
the Alpine Convention<br />
The Alpine Convention<br />
The Alpine Convention, signed on 7 November 1991, is a<br />
framework agreement for the protection of the <strong>Alps</strong>, aimed<br />
at harmonising the policies of the signatory countries, to adjust<br />
the differences in the economic interests concerned in<br />
the <strong>Alps</strong>, with the requirement to protect of a natural heritage<br />
under threat. The Alpine Convention is divided into eight<br />
implementation protocols in specific domains; they constitute<br />
instruments for supervising the action of the signatory countries,<br />
aiming to prevent a policy of a “race to the bottom” in<br />
ecological terms.<br />
The Contracting Parties participating in the Alpine Conference,<br />
the decisive body of the AC, are Germany, Austria,<br />
Switzerland, France, Italy, Liechtenstein, Monaco and<br />
Slovenia, plus the European Union.<br />
allowing for environmental protection of sensitive population<br />
groups and areas, while encouraging the development of<br />
alternative modes as opposed to road transport (in particular<br />
piggybacking and sea-river transport).<br />
Smog in the Inntal valley near Innsbruck/A. The transport protocol aims<br />
at reducing the negative effects of the excessive traffic flows on the main<br />
routes through the <strong>Alps</strong> (Source: www.transitforum.at).<br />
Particular attention is also given to cross-border spaces and<br />
projects (consultation between countries, global consistency<br />
of functionality and of costs).<br />
Further prominent objectives which are relevant with regard<br />
to analyses or observations of this report in particular comprise<br />
the transport protocol’s<br />
• Article 1 on general objectives,<br />
• Article 3 on sustainable transport and mobility,<br />
• Article 9 on public transport,<br />
• Articles 10, 11 and 12 on the respective transport modes ,<br />
• Article 13 on tourism and transport, and<br />
• Article 15 on supply and utilisation of transport infrastructure.<br />
<br />
<br />
<br />
<br />
<br />
<br />
<br />
<br />
<br />
<br />
<br />
<br />
<br />
<br />
<br />
<br />
<br />
<br />
<br />
<br />
<br />
<br />
<br />
<br />
<br />
Fig. D1-1: Structure of the Alpine Convention: Eight countries, Germany,<br />
Austria, Switzerland, France, Italy, Liechtenstein, Monaco and Slovenia,<br />
plus the European Union signed the Alpine Convention to protect the <strong>Alps</strong><br />
(Graphic: ifuplan).<br />
The transport protocol<br />
The transport protocol was signed at Luzern on 1 October<br />
2000; it constitutes a tool for supervising of the action of<br />
the contracting Parties in the domain of transport within the<br />
Alpine space. The protocol is still awaiting ratification by<br />
Italy, Switzerland and the European Union. Austria, Germany,<br />
Liechtenstein, France and Slovenia have already ratified<br />
this protocol.<br />
The overall objective of the protocol is to identify a policy of<br />
sustainable development for transport in the Alpine space,<br />
108
Chapter D – Alpine Relevant Traffic Policies and Cooperation in the <strong>Alps</strong><br />
D2<br />
The Framework for Action<br />
by the Alpine Countries:<br />
the Cooperating Bodies<br />
D2.1 The Alpine Convention<br />
Transport Working Group<br />
Monitoring of the implementation of the transport<br />
protocol<br />
This monitoring has been entrusted, under the responsibility<br />
of the Permanent Committee of the Alpine Convention, to a<br />
specific working group (“Working Group on Transport”), first<br />
officially mandated at the 7 th Alpine Conference in Merano in<br />
November 2002, then completed at the 8 th Alpine Conference<br />
in Garmisch in November 2004 and Alpbach in November<br />
2006. Depending on procedures established by the Permanent<br />
Committee, the executive body of the AC, the working<br />
group consists of a delegation from each Contracting Party<br />
(representatives of the ministries for the environment and for<br />
transport) and a representative, acting as an observer, from<br />
each partner association or NGO, particularly interested in<br />
this topic.<br />
The main areas of work, undertaken under the aegis of the<br />
Alpine Convention and given in greater detail below, concern:<br />
• fair and efficient pricing of the trans-Alpine road transport,<br />
• development of the existing trans-Alpine rail corridors,<br />
• promotion of sustainable intra-Alpine mobility, both in links<br />
between communities, and in access to tourist centres.<br />
D2.2 The Zurich Declaration<br />
Monitoring Group<br />
On 30 November 2001, on the initiative of Switzerland, the<br />
transport ministers from Germany, Austria, France, Italy and<br />
Switzerland signed the declaration “concerning the improvement<br />
of road safety, in particular in the tunnels in the Alpine<br />
zone”, while the two Gotthard and Mont Blanc roadways<br />
were closed following serious accidents.<br />
Since then, three meetings of the ministers have taken place<br />
(on 11 May 2004, on 14 November 2005 and on 20 October<br />
2006), to consider the progress of the work and to adjust<br />
priorities. The next meeting will take place 2008 in Austria.<br />
Slovenia officially joined the group in 2006.<br />
Having taken road safety issues as its starting point, the<br />
implementation of the declaration has developed to identify<br />
measures to be coordinated between the signatory Alpine<br />
countries for regulating road traffic and encouraging a shift<br />
to an alternative mode of transport, with three main areas of<br />
work (detailed below):<br />
• the safety of the trans-Alpine road and rail tunnels,<br />
• a study of mobility in the Alpine zone, with coordination<br />
and use of the CAFT 2004 “Cross Alpine Freight Transport”<br />
survey,<br />
• the management and regulation of trans-Alpine road traffic.<br />
D2.3 the process of bi- or multilateral<br />
cooperation on specific<br />
projects<br />
The Alpine countries are participants in bilateral or trilateral<br />
cooperation bodies: the organisations that manage or operate<br />
the cross-border structures and infrastructure, cooperation<br />
concerning rail transport, improvement of access.<br />
Such a bilateral cooperation exists for example between Italy<br />
and France in the project Lyon-Torino, the tunnel of Fréjus<br />
and the tunnel of Mont-Blanc. Other examples are the commission<br />
of the Austrian and the Italian government for the<br />
Brenner tunnel project and the French-Austrian group for<br />
transport.<br />
Freight traffic through the <strong>Alps</strong>. The Alpine convention aims at developing<br />
a fair and efficient pricing system for trans-Alpine transport<br />
(Source: www.transitforum.at).<br />
The Zurich-group is an example of multilateral cooperation<br />
between Austria, France, Germany, Italy, Slovenia and<br />
Switzerland.<br />
109
Report on the State of the <strong>Alps</strong><br />
D3<br />
EU-Directives Adopted or<br />
in the Process of Adoption<br />
The Alpine space belongs to the Alpine population, but also<br />
to Europe in its widest sense. No solution may be developed<br />
for freight or for passengers without taking account, at least<br />
at European level, of a global vision of ways of life and methods<br />
of trade. Beyond their differences on various matters, the<br />
Alpine countries belonging to the EU and those who have entered<br />
in cooperation agreements with the EU are obliged to<br />
consider the frameworks and regulations decreed by the EU.<br />
Policy directions, regulatory action, financial structure, support<br />
for INTERREG programmes (see chapter D8) – all these<br />
relations of the Alpine countries with the European Union are<br />
an important factor in recognizing the possibilities and the<br />
limitations of cooperation on joint issues.<br />
Moreover, the European Commission White Paper “European<br />
Transport Policy for 2010: Time to decide” of 2001<br />
was largely inspired by the Alpine experience, where certain<br />
issues were concerned, and provided valuable foundations<br />
for reference for the development of the national policies of<br />
the Alpine countries.<br />
EU policy objectives and regulatory frameworks are an overall<br />
frame condition for a joint Alpine Transport Policy. Only<br />
the main cornerstones can be mentioned here, others are<br />
introduced below:<br />
• the EC Treaty, which encompasses the principles of free<br />
movements of goods, free provision of services and free<br />
circulation of persons, as well as the objective of preserving<br />
and protecting the quality of the environment,<br />
• the Action and development Plan for the EU, known<br />
as “Lisbon Strategy” (2000) targeting competitiveness,<br />
employment, economic reform and social cohesion, and<br />
• the 6 th Environmental Action Programme (Decision<br />
1600/2002) and the renewed Sustainable Development<br />
Strategy (2006) calling among other objectives for:<br />
» decoupling economic growth and the demand for transport<br />
with the aim of reducing environmental impacts,<br />
» reducing pollutant emissions from transport to levels<br />
that minimise effects on human health and/or the environment,<br />
and<br />
» achieving a balanced shift towards environmentally<br />
friendly transport modes to bring about a sustainable<br />
transport and mobility system.<br />
Cohesion policy and the transport system<br />
The building of a single EU market is a primary goal of the<br />
European Union. To achieve a competitive economic space,<br />
different policies have been set up aiming at ensuring competition<br />
and reducing the disparities among the EU regions,<br />
in order to guarantee their participation in the single market.<br />
The EU policy for cohesion among different regions involves<br />
the Alpine space, too. In order to achieve full integration of<br />
the Alpine region within the EU internal market, the main<br />
European regional policies have to be considered, wherein<br />
specific provisions have been made for financing specific<br />
programmes in the area.<br />
The Community Strategic Guidelines for Cohesion Policy<br />
aim to improve the attractiveness of member states, regions<br />
and cities; encourage innovation, entrepreneurship and<br />
growth of the knowledge economy; and create more and better<br />
jobs (EU Commission 2006). Developing an efficient and<br />
sustainable European transport system, and an appropriate<br />
charging system for the traffic passing through the <strong>Alps</strong>, as<br />
well as supporting sustainable transport modes and intermodality,<br />
are considered to be sustainable ways of supporting<br />
the economic development of the EU, by giving priority to<br />
some specific projects. Improving the efficiency of the EU<br />
single market, taking into consideration the economic development<br />
prospects at regional level, enhancing competition<br />
as a significant factor in the distribution of economic activity<br />
and income among Europe‘s regions, and enlarging the EU<br />
to include new countries, are among the main objectives of<br />
an EU transport policy (EU Commission 1998).<br />
Trans-European-Transport-Network (TEN-T)<br />
According to the EU Treaty (Art. 154, 155, 156), the European<br />
Union must aim at promoting the development of trans-<br />
European networks (TEN-T) as a key element for the creation<br />
of the internal market and the reinforcement of economic<br />
and social cohesion, by shortening the distances among EU<br />
regions and giving faster access to regions which are falling<br />
behind, and to peripheral areas. The TEN-T policies are<br />
expected to have strong economic, social and environmental<br />
impacts on the Alpine area since some of the projected<br />
trans-European corridors will cross the <strong>Alps</strong> (see chap. A).<br />
The enlargement of the EU and the resulting expected changes<br />
in traffic growth were also considered in the Commission<br />
strategy. This strategy aims for concentrating on a primary<br />
transport network made up of the most important infrastructure<br />
for international traffic and cohesion on the European<br />
continent, to introduce the concept of “sea motorways” and<br />
to include sections of pan-European corridors situated in the<br />
territory of candidate countries, including those which will still<br />
not be members of the Union at that time. The Alpine area<br />
will play a primary role in the EU transport policies framework<br />
because of its physical features and geographical position.<br />
With the decision of 29 April 2004, the Parliament and the<br />
Council revised the Community position in the domain of the<br />
Trans-European-Transport-Network, identifying high-priority<br />
projects of joint benefit (i.e. aiming in particular to remedy<br />
a bottleneck or to complete a missing link in a major route,<br />
in particular cross-border projects, or projects that cross<br />
natural obstacles). These projects should start before 2010<br />
and be completed by 2020, with co-financing from the European<br />
Commission.<br />
The following four trans-Alpine projects are featured among<br />
the high-priority projects of European interest:<br />
• TEN-T 1: Railway axis Berlin–Verona/Milano–<br />
Bologna–Napoli–Messina–Palermo including the<br />
Brenner corridor,<br />
• TEN-T 6: Railway axis Lyon–Trieste–Divaca/Koper–<br />
Divaca–Ljubljana–Budapest–Ukrainian border,<br />
• TEN-T 17: Railway axis Paris–Strasbourg–Stuttgart–<br />
Vienna–Bratislava, and<br />
110
Chapter D – Alpine Relevant Traffic Policies and Cooperation in the <strong>Alps</strong><br />
• TEN-T 21: Motorways of the sea (regular, high-capacity<br />
ferry routes between key ports in the EU to improve<br />
the efficiency and reliability of freight transport, providing<br />
viable alternatives for congested land routes on roads.<br />
collection should not involve excessive formalities or create<br />
barriers at internal borders. The calculation of costs will be<br />
based on a core set of principles set out in Annex II of the<br />
directive.<br />
In particular, motorways of the sea will help bypass the<br />
As from 2012, the directive (subject to certain derogation) will<br />
bottlenecks created by such geographical features as<br />
apply to vehicles over 3.5 tonnes, rather than only to vehicles<br />
mountain ranges).<br />
over 12 tonnes – the limit set by previous requirements. In<br />
As part of the next financial perspectives (2007–2013), the<br />
European Commission proposed a detailed re-evaluation<br />
of the budget for the Trans-European-Transport-Network,<br />
which would be used for a limited number of projects, with a<br />
very encouraging level of support (up to 50% for the crossborder<br />
projects).<br />
other provisions, the directive allows for a greater variation<br />
of tolls depending on the level of congestion. A fairer system<br />
of charging for use of the road infrastructure is based<br />
on the “user pays” principle. Thus, toll variations, reflecting<br />
the pollution caused by vehicles, will be mandatory as from<br />
2010. Member States will be able to charge different tolls<br />
depending on a vehicle’s emission category (EURO classification)<br />
and the level of damage caused to roads, as well as<br />
the place, the time and the amount of congestion.<br />
<strong>How</strong>ever, the final level of European support will depend on<br />
the overall budget allocated to the Trans-European-Transport-Networks,<br />
and on possible priorities that will be applied<br />
by the European Union among the various high-priority<br />
projects. At the beginning of 2006, the European budget for<br />
the period 2007–2013 was much lower than the initial expectations<br />
of the European Commission.<br />
Tunnel safety<br />
Directive 2004/54/EC on minimum safety requirements for<br />
tunnels in the trans-European road network, adopted in April<br />
2004, fixes minimum safety requirements for the civil engineering<br />
work, and for the management and regulation of the<br />
tunnels. It was largely inspired by the work conducted as part<br />
of UN-ECE and the Zurich Group, which brought together<br />
the representatives of the Transport Ministers of the Alpine<br />
countries, and in particular included a working group on the<br />
safety of the Alpine tunnels.<br />
Road user charges and Eurovignette<br />
The European Parliament and the Council adopted on 17 May<br />
2006 Directive 2006/38/EC amending Directive 1999/62/EC<br />
on the charging of heavy good vehicles for the use of certain<br />
infrastructures (so-called “Eurovignette Directive”).<br />
The 1999 directive provides for a framework for the levying of<br />
tolls and user charges on Europe’s motorways, by establishing<br />
the principle that tolls and user charges must be related<br />
to infrastructure cost.<br />
In its amended versions the directive now applies to the<br />
whole of the trans-European network and not just to<br />
motorways – as was previously the case. Although not<br />
obliging to do so, the directive also allows Member States to<br />
levy tolls and user charges on all other roads as well – any<br />
such revenues raised, however, must be in conformity with<br />
this directive.<br />
Tolls will still be based on the principle of recovery of infrastructure<br />
costs although environmental considerations<br />
will also play a key role in determining the rate charged.<br />
Revenues from tolls or user charges are used for the maintenance<br />
of the infrastructure and for the transport sector as a<br />
whole. Importantly, the amended directive states that toll<br />
charges should not discriminate against international traffic<br />
and should not result in distortions of competition between<br />
operators. Fees should be non-discriminatory and their<br />
As far as the “polluter pays” principle is concerned, the directive<br />
states that any future decisions for all modes of transport<br />
will take account of both internal and external costs. In addition,<br />
any future decision on this matter will take full account<br />
of the tax burden already borne by road haulage companies,<br />
including vehicle taxes and fuel excise duties. Provisions<br />
have been put in place to allow the Member States to increase<br />
tolls with a “mark-up” on roads in particularly sensitive<br />
mountainous regions such as the <strong>Alps</strong> or the Pyrenees. Any<br />
revenue thus collected must be re-invested into alternative<br />
transport infrastructure.<br />
In accordance with implementation procedures the European<br />
Commission will begin work on developing a generally<br />
applicable, transparent and comprehensible model for the<br />
assessment of external costs for all modes of transport, serving<br />
as the basis for future calculation of infrastructure charges.<br />
Combined transport modes – Marco Polo Programme<br />
In continuation of the PACT Programme (“Pilot Actions for<br />
Combined Transports”) of subvention to combined transport<br />
operators, the EU continues to encourage transfer to<br />
alternative modes of transport, using the Marco Polo and the<br />
Marco Polo II Programme, which covers all alternatives to<br />
road transport for the years 2003–2013. In addition, the EU<br />
is fostering the development of interoperability by organising<br />
competition on the trans-European rail network for freight with<br />
the second package of measures for rail transport and for<br />
passengers with the third package of measures for rail transport.<br />
Environmental impacts of transport plans and projects<br />
The EU issued the following two directives dealing with the<br />
impacts of transport plans and projects:<br />
• Directive 85/337/EC on the “Assessment of the<br />
Environmental Impact of Certain Public and Private<br />
Projects”, as amended by Directives 97/11/EC and<br />
2003/35/EC (EIA): This directive influences directly and<br />
indirectly many transport infrastructure projects.<br />
• Directive 2001/41/EC on the “Assessment of the Effects<br />
on the Environment of Plans and Programmes” (so-called<br />
“Strategic Environmental Assessment – SEA”) extends<br />
the consideration of environmental aspects to plans and<br />
111
Report on the State of the <strong>Alps</strong><br />
programmes. It will therefore affect the development of<br />
transport development plans at national, regional and<br />
local level.<br />
Information of the public<br />
Directive 2003/4/EC on the “Freedom of Access to Information<br />
on the Environment” facilitates the access to information<br />
held by public authorities. This emerged being of high<br />
relevance for transport related information and triggered an<br />
increasing awareness of citizens.<br />
Bibliography<br />
EU Commission (2006): Commission of the European<br />
Communities: Proposal for a Council decision on Community<br />
strategic guidelines on cohesion, Brussels, 13.7.2006.<br />
EU Commission (1998): Communication from the Commission<br />
to the Council, the European Parliament, the Economic<br />
and Social Committee and the Committee of the Regions of<br />
14 January 1999: „Cohesion and Transport“ [Not published<br />
in the Official Journal].<br />
This is supported by Directive 2003/35/EC which provides<br />
for public participation in respect of the drawing<br />
up of certain plans and programmes relating to the environment<br />
(implementation by the EC of the UN-ECE<br />
Aarhus Convention). The main objectives are to foster the<br />
effective public participation and taking account of these<br />
concerns in the decision-making process. The directive<br />
opens this participation to associations, organisations<br />
and groups, in particular non-governmental organisations<br />
promoting environmental protection. By this the<br />
decision-making process is compassed to gain more<br />
accountability and transparency.<br />
Environmental protection and biodiversity<br />
In addition, the EU has adopted several major directives concerning<br />
protection of the environment and biodiversity which<br />
affect the development and operation of transport infrastructure.<br />
In particular:<br />
• Directive 2002/49/EC concerning evaluation and management<br />
of noise in the environment requires, before<br />
2008, the evaluation of noise maps and of action plans<br />
to deal with the noise of road and rail infrastructure, with<br />
annual traffic in excess of 6 Mio road vehicles and 60,000<br />
train journeys respectively,<br />
• Framework Directive 96/62/EC on “Ambient Air Quality”<br />
requires the implementation of action plans to reduce<br />
air pollution in the areas where the limit values and alert<br />
thresholds defined by the so-called “daughter Directives”,<br />
which sets the limit values for specific pollutants<br />
(e.g. PM10, Ozone, lead, etc.), are exceeded and<br />
• in 1992 the EU adopted Directive 92/43/EEC on the<br />
“Conservation of Natural Habitats and of Wild Fauna and<br />
Flora (“Flora and Fauna Habitat Directive”). The directive<br />
has the objective to preserve Europe’s biodiversity<br />
by setting up of a coherent European ecological network<br />
of special areas of conservation, called Natura 2000. This<br />
network is intended to conserve the natural habitat types<br />
as the animal and plant species of Community interest.<br />
Together with Council Directive 79/409/EEC on the conservation<br />
of wild birds, the preservation objectives and<br />
the delineation of special areas of conservation (SAC)<br />
and special protected areas (SPA) are meanwhile important<br />
aspects to be considered in transport projects.<br />
112
Chapter D – Alpine Relevant Traffic Policies and Cooperation in the <strong>Alps</strong><br />
D4<br />
National Policies on<br />
Transport Infrastructure<br />
Programmes<br />
All Alpine countries have gradually become aware of the<br />
negative consequences of uncontrolled development of<br />
transport (lack of safety, noise, pollution, use of space and<br />
consumption of non-renewable energy), which are particularly<br />
acute in areas with heavy traffic, such as the Alpine crossings.<br />
All Alpine countries are taking account of these issues<br />
to an increasing extent in their national transport strategies.<br />
Germany<br />
In 2004, Germany completed its national strategy for sustainable<br />
development and in 2003 adopted the Federal Transport<br />
Infrastructure Plan which aimed to:<br />
• ensure a sustainable mobility compatible with the<br />
imperatives of the environment,<br />
• encourage European integration and strengthen<br />
Germany’s economic position, for the purpose of creating<br />
and preserving jobs,<br />
• encourage the setting up of sustainable structures in this<br />
area and habitat,<br />
• create conditions for competition that are equitable and<br />
comparable for all modes of transport,<br />
•<br />
•<br />
increase safety,<br />
reduce the negative effects on the environment (use of<br />
space, noise and atmospheric pollution, consumption of<br />
non-renewable energy).<br />
In addition, the Federal Transport Infrastructure Plan<br />
takes account of environmental issues. All projects, i.e.<br />
also those relevant to trans-Alpine traffic, are, before<br />
their inclusion in the Federal Transport Infrastructure<br />
Plan, subject to a uniform evaluation according to criteria<br />
relating to:<br />
• cost-benefit analyses,<br />
• environmental protection and nature conservation, and<br />
• regional planning (including urban development).<br />
Austria<br />
Austria has adopted both a general transport plan and a<br />
national strategy for sustainable development, as well as<br />
a strategy aiming to attain the Kyoto objective; these three<br />
programmes are divided into measures to enable the objectives<br />
of the transport protocol to be attained. In 2002, Austria<br />
published its general transport plan which aimed to:<br />
• strengthen Austria as an economic space,<br />
• develop the networks efficiently and appropriately for<br />
requirements,<br />
• improve safety, and<br />
• provide financing of measures.<br />
France<br />
In 2003, France adopted a national strategy for sustainable<br />
development, with a programme of very practical actions<br />
in the domain of transport (intended to separate economic<br />
growth from the environmental effects of transport),<br />
a health and environment plan (intended, in particular, to reduce<br />
diesel particle emissions), a noise pollution action plan<br />
(intended, in particular, to achieve sound proofing of homes),<br />
as well as a climate plan.<br />
At the interministerial committee meeting of 18 December<br />
2003, dedicated especially to directions for transport looking<br />
ahead to 2020, a new policy and scheduling of transport<br />
were defined around several objectives: economic development,<br />
attractiveness of territories, consideration of the global<br />
and local environmental issues.<br />
As part of this initiative, an innovative financing system has<br />
been put in place: a new agency for financing of transport<br />
infrastructure which implements the state contribution (7.5<br />
billion EUR between now and 2012) to the financing of the<br />
major new infrastructure projects (75% of which are rail<br />
or river projects), in the form of subsidies or reimbursable<br />
advances, and which takes its resources in particular from<br />
motorway tolls.<br />
The weighting of the environmental and nature conservation<br />
concerns is in this context not least of special importance in<br />
view of the objective of shifting traffic to more environmentally<br />
friendly transport modes. Within the framework of an<br />
overall economic cost-benefit analysis, the possible noise<br />
nuisances are recorded on the basis of the willingness of the<br />
parties involved to pay for prevention measures, the climatic<br />
effects (CO 2<br />
) by the estimate of prevention costs, the possible<br />
damage due to other air pollutants (e.g. NO x<br />
, dust, soot, CO,<br />
SO 2<br />
) by direct damage cost for health, vegetation and buildings.<br />
Within the framework of a preceding environmental risk<br />
assessment, the environmental effects are described<br />
(verbally) in terms of quality and find their way into the identification<br />
of a so-called environmental risk factor ranging from<br />
1 to 5, which determines on the classification of the project,<br />
among other things, in line with the requirements of the<br />
Habitat Directive.<br />
All Alpine countries place emphasis on developing the potential of rail<br />
transport for freight across the <strong>Alps</strong> (Source: Rail Cargo Austria).<br />
113
Report on the State of the <strong>Alps</strong><br />
Switzerland<br />
In Switzerland, the objective of sustainable development<br />
is anchored in the federal constitution. As far as transport<br />
policy is concerned, sustainable mobility means that the infrastructures<br />
must be planned in such a way that they respond<br />
to mobility needs while taking into account the cost and<br />
efficiency criteria and the demands related to public service.<br />
They can thus ensure to all population groups and to all the<br />
regions of the country access to an operational transport<br />
system. It is also necessary to guarantee that this accrued<br />
mobility is complemented by an improvement in traffic safety<br />
and that it does not harm the environment.<br />
More concretely, the objective of sustainable mobility is<br />
implemented through:<br />
• a public transport modernisation programme (Rail 2000,<br />
NRLA, connection to the European high-speed rail network,<br />
abatement of railway noise),<br />
• equalisation of conditions of competition between rail<br />
and road, in particular by the introduction of the MLHVT<br />
in 2001, and<br />
• the coordination of means of transport so that freight<br />
traffic can be shifted from road to rail.<br />
Italy<br />
In Italy, the national strategies are organised as a General<br />
Transport and Logistics Plan (PGTL) passed in 2001, which<br />
favours trans-Alpine and intra-Alpine mobility. The PGTL is<br />
accompanied by transport plans at various local levels, preferably<br />
linked to local mobility. It aims to contain the exponential<br />
growth of road traffic and its concentration on major<br />
routes, with three objectives:<br />
• the development of the potential of rail transport for<br />
freight across Alpine space, in liaison also with the main<br />
ports of North Italy,<br />
• the creation of itineraries for developing freight transport<br />
of freight from the North to the South by rail with gauges<br />
appropriate for transporting containers and swap bodies,<br />
in liaison with the transhipping ports and the main mountain<br />
passes, and<br />
• the strengthening of the system of transfer points for<br />
road-rail transfer in the South.<br />
Slovenia<br />
In Slovenia, the Resolution on the Transport Policy of the<br />
Republic of Slovenia (Intermodality, Time for Synergy), which<br />
was adopted at the beginning of 2006 by the National Assembly,<br />
defines – in terms of the starting points, vision, objectives<br />
and measures – the basic trends of a transport policy for the<br />
future. The main indicators of this transport policy originate<br />
in mobility, accessibility, the environment, safety, economic<br />
development, optimal exploitation of resources, intermodality/<br />
interoperability and a balance among transport systems.<br />
ment and ethics. The main objectives of the transport policy<br />
include the attainment of a social optimum in the part concerning<br />
the transport sector, an increase in transport safety<br />
and security, efficient use of energy and a clean environment.<br />
From an environmental standpoint it will be necessary to<br />
facilitate the development of new transport techniques<br />
and technologies which alleviate the burden placed on the<br />
environment and foster the use of more energy efficient and<br />
ecologically acceptable vehicles. With the changing social<br />
habits and economic dynamics, Slovenia attempts to raise<br />
public awareness about the significance of sustainable<br />
development, the role of transport and its operation as well<br />
as optimal utilisation.<br />
Public interest in providing mobility is also linked to social<br />
and environmental factors. The described vision of mobility<br />
in Slovenia is a response to the unbalanced development<br />
of passenger transport. Two different laws and two different<br />
administrators responsible for providing public transport<br />
services dictate the conditions for the work of major public<br />
transport operators, bus and railway operators.<br />
The Slovenian traffic authority argues that the awareness of<br />
passengers needs to be raised in order to steer passenger<br />
transport in the direction of intermodal objectives.<br />
Since economy is also a component of sustainable development,<br />
Slovenia has envisaged in its transport policy measures<br />
the setting up of a market-based system for charging<br />
fees for the use of infrastructure. It is in the interest of the<br />
state to have developed and competitive transport operators<br />
that provide quality services, are successful, increase added<br />
value and innovations, since fierce competition on the European<br />
transport market means that companies are forced to<br />
streamline their business operations and fight for survival.<br />
From an economic viewpoint, the inclusion of private capital<br />
in the development of transport infrastructure is anticipated.<br />
Private capital should be engaged in all those areas where<br />
the desired goals can be attained by means of a private initiative<br />
thus partly taking the burden from public finances. Regulations<br />
and other legislative acts should primarily lay down<br />
conditions for the development of a quality market structure<br />
in the field of transport.<br />
With the construction of a suitable infrastructure, Slovenia<br />
would like to enable a smoothly flowing and safe traffic for<br />
Slovenian and foreign transport operators entering and<br />
transiting the country. A free-market economy and administrative<br />
regulation foster the development of this sector, rather<br />
than traffic obstruction, and promote the competitiveness of<br />
Slovenian transport operators.<br />
Considering the complexity of sustainable development,<br />
those responsible for transport policy consistently noted the<br />
objectives and measures of a policy that equally, simultaneously<br />
and independently addresses all four dimensions of<br />
sustainable development: economics, society, the environ-<br />
114
Chapter D – Alpine Relevant Traffic Policies and Cooperation in the <strong>Alps</strong><br />
D5<br />
Development of Alpine<br />
Transport Infrastructure<br />
D5.1 Road infrastructure policies<br />
In the last eight years serious road accidents have occurred<br />
in some of the main Alpine crossing tunnels, causing deaths<br />
and injuries. The accidents blocked trans-Alpine traffic for<br />
months and even sometimes years, and mounting reconstruction<br />
costs of up to more than 180 Mio EUR (see more<br />
details in chapter A1.2.2).<br />
As part of the Zurich group, the Alpine countries have<br />
already contributed to applying the provisions of the European<br />
directive on road tunnel safety, issued in April 2004;<br />
nevertheless, a list of works in progress at European level on<br />
rail tunnel safety has still to be produced, in order to identify<br />
the additions that might be necessary when taking account of<br />
the specific characteristics of the Alpine region.<br />
With regard to the technical safety of heavy goods vehicles,<br />
the Working Group has produced a comparative list of provisions<br />
applicable in the Alpine countries, and is considering<br />
ways of reducing of the risk of heavy goods vehicles catching<br />
fire.<br />
For the Alpine space in the Trans-European-Transport-Network<br />
(TEN-T) no motorway projects as priority projects are<br />
reported (EU 2005). In the different Member States main road<br />
upgrades or network completion are the subject of the respective<br />
national transport programmes. Some examples of<br />
road construction projects are indicated in chapter A1.2.1.<br />
D5.2 Rail infrastructure policies<br />
Most of the rail lines crossing the <strong>Alps</strong> are old, and the tunnels<br />
accompanying them were produced using the drilling<br />
techniques of the late 19 th century, when it was necessary to<br />
dig for the shortest distance, using the tools of the time. On<br />
certain sections, therefore, these lines have gradients that<br />
are incompatible with developing modern, efficient freight<br />
services.<br />
To deal with the projected growth in trade and to offer a real<br />
alternative to road transport, four major drillings are in the<br />
process of implementation or design on major routes (see<br />
Fig. D5‐1):<br />
• Lyon-Torino base tunnel,<br />
• Lötschberg base tunnel,<br />
• Gotthard base tunnel,<br />
• Brenner base tunnel.<br />
These routes were recognised as having high priority for the<br />
structuring of trade in Europe, so that, between 2007 and<br />
2020, it will be possible to introduce an alternative to growth<br />
in road traffic on the North-South route as on the South<br />
European route.<br />
Fig. D5‐1: The four rail tunnels currently under construction.<br />
Franco-Italian cross-border base tunnel<br />
The new mixed (freight and passenger) link project connecting<br />
Lyon and Torino (TEN-T no.6 priority project see chap.<br />
D3) has a dual objective:<br />
• to ensure sustainable development of rail freight across<br />
this section of the <strong>Alps</strong> (expected capacity of 40 Mio<br />
tonnes/year), by replacing the current mountain line with<br />
a new level line with, in particular, a cross-border base<br />
tunnel about 52 km long, and<br />
• to allow passengers to cross the <strong>Alps</strong> in the best possible<br />
conditions, while providing an efficient service covering<br />
the major towns of the Alpine corridor.<br />
Following the technical studies initiated by the Treaty of Torino<br />
on 29 January 2001, both countries had to complete their<br />
respective procedures in 2006 for Italy and 2007 for France.<br />
The structure should be able to come into operation before<br />
2020, at a cost of seven billion EUR.<br />
Swiss New Rail Links through the <strong>Alps</strong> (NRLA) and its<br />
major tunnels<br />
In Switzerland, the implementation of the NRLA in stages is<br />
in progress. Proceeding in this way, by stages, allows costs<br />
to be controlled and the rail service offered will be able to be<br />
coordinated with demand. The main elements of the NRLA<br />
are:<br />
• the drilling of the Lötschberg base tunnel: the breakthrough<br />
of this tunnel, 34.6 km long, took place at the<br />
end of April 2005. The installation of rail technology is<br />
under way; the opening of the tunnel is planned for December<br />
2007,<br />
• the construction of the Gotthard base tunnel: 54% of this<br />
tunnel, with a length of 57 km, has already been drilled.<br />
It should be completed by 2015/2016. This structure<br />
will be extended to the South by the Ceneri base tunnel<br />
(15 km), which is planned to open in 2016. The building<br />
authorisation was granted in October 2005, and<br />
• the Zimmerberg and Hirzel tunnels are assigned to the<br />
second phase of the NRLA. Given the uncertainty of<br />
federal finances, these structures will be built in stages.<br />
The Zimmerberg tunnel will be built a few years later than<br />
planned. It is not considered necessary for the Hirzel<br />
tunnel to be in operation at the current time.<br />
115
Report on the State of the <strong>Alps</strong><br />
The initial capital expenditure was set at 8.9 billion EUR (CHF<br />
14.7 billion). In the summer of 2004, credit was increased by<br />
549 Mio EUR (CHF 900 million), reaching 9.5 billion EUR<br />
(CHF 15.6 billion, 1998 prices). The probable final costs are<br />
estimated at 10.0 billion EUR (CHF 16.4 billion, prices in<br />
1998, Schweizer Parlament 2006). An amount of 5.9 billion<br />
EUR (9.66 billion CHF) is planned for the St-Gotthard-Ceneri<br />
route and 2.6 billion EUR (CHF 4.22 billion) for the Lötschberg-Simplon<br />
route.<br />
The lengthening of the NRLA to the north of Switzerland is<br />
regulated by an agreement with Germany.<br />
The new and upgraded line Karlsruhe – Offenburg – Basel,<br />
which is the most important German feeder line to the NEAT<br />
in Switzerland, is classified in its entirety as a first priority<br />
project in the 2003 Federal Transport Infrastructure Plan. It<br />
is intended to complete the widening of the whole line to four<br />
tracks by 2015, simultaneously with the opening to traffic of<br />
the Gotthard Basis Tunnel in accordance with the Memorandum<br />
of Understanding concluded with Switzerland in 1996.<br />
The Federal Railway Infrastructure Upgrading Act contains<br />
further feeder lines to the NEAT. First priority projects are:<br />
• upgraded line München – Lindau – German/Austrian<br />
border,<br />
• upgraded line Stuttgart – Singen – German/Swiss border,<br />
• upgraded line Ulm – Friedrichshafen – Lindau.<br />
After the completion of the measures for capacity enhancement<br />
on the German feeder lines in 2001, further upgrading<br />
has to be oriented towards the demand to be expected,<br />
which depends ultimately on the completion of the Brenner<br />
base tunnel. In this connection, the considerable additional<br />
railway capacity between Germany and Italy which the NEAT<br />
in Switzerland with the Lötschberg and Gotthard base tunnels<br />
(completion scheduled for 2007/2015) and the fourtrack<br />
German feeder line Karlsruhe – Basel will offer, should<br />
also be taken into consideration.<br />
Bibliography<br />
European Commission (2005): Trans-European-Transport-<br />
Network TEN-T priority axes and projects 2005. Luxembourg.<br />
Schweizer Parlament (2006): Zusammenfassung zum<br />
Bericht der NEAT-Aufsichtsdelegation der eidgenössischen<br />
Räte zuhanden der Finanzkommissionen, der Geschäftsprüfungskommissionen<br />
und der Kommissionen für Verkehr und<br />
Fernmeldewesen betreffend Oberaufsicht über den Bau der<br />
Neuen Eisenbahn-Alpentransversale (NEAT) im Jahr 2005.<br />
http://www.parlament.ch/ed-pa-berichte-de-nad-20060508-<br />
zus.pdf.<br />
A convention has also been concluded between Italy and<br />
Switzerland. Through the coordination of infrastructure planning<br />
and of measures improving rail operations between the<br />
two countries, the convention is to improve the connections,<br />
in particular with Malpensa airport. In the longer term it is<br />
planned to ensure an optimal link between the NRLA and the<br />
high-speed Italian network.<br />
In this context, various lengthening variants of the NRLA to<br />
the south of Lugano are now being studied. Switzerland is<br />
examining four variants of a new stretch between Lugano<br />
and Chiasso (“AlpTransit Sud”). As for Italy, it is developing<br />
three alternatives for a new stretch towards Luino-Novara<br />
(“Gronda Ovest”). These alternatives will be assessed by the<br />
end of 2006.<br />
Brenner base tunnel<br />
In April 2004, Austria and Italy signed an agreement on the<br />
Brenner tunnel. The total cost of the 56 km-long tunnel is<br />
estimated at approximately 4.6 billion EUR. Regarding the<br />
financing Italy and Austria envisage topmost TEN subsidies<br />
from the European Union and a Private-Public-Partnership<br />
(PPP) is intended. The public part would be financed by 40%<br />
by Italy, 40% by Austria and 20% by the European Commission.<br />
The work for a pilot tunnel started in 2006. It is planned<br />
that the Brenner base tunnel will be in use by 2020.<br />
In June 1994 (Memorandum of Montreux), Germany, Italy<br />
and Austria agreed on the gradual construction of the feeder<br />
lines and the Brenner Basis Tunnel „in line with requirements“.<br />
These lines are to be upgraded in such a way that<br />
the capacities needed for additional traffic volumes can be<br />
provided in good time.<br />
116
Chapter D – Alpine Relevant Traffic Policies and Cooperation in the <strong>Alps</strong><br />
D6<br />
The Transport of Freight<br />
through the <strong>Alps</strong>, a major<br />
Concern<br />
More than 10 Mio heavy goods vehicles travelled over<br />
Alpine crossings in 2004. Freight traffic volume doubled<br />
in 20 years and has had a significant impact on journey<br />
safety and on the environmental quality of the <strong>Alps</strong>.<br />
This trend has caused increasing exasperation among<br />
the population who live beside the major road transport<br />
routes. Because of these circumstances the conditions<br />
of freight transport in the Alpine space are a major<br />
issue for its future, particularly the transport arising<br />
from international trade.<br />
Given this situation, the Alpine countries are gradually<br />
developing national and joint actions for regulating road<br />
freight traffic, ensuring better journey safety, and identifying<br />
pricing in relation to costs of road transport to take<br />
account of all the direct and indirect costs.<br />
These actions are still to come: although the national<br />
policies are well established, implementing effective<br />
cooperation is a more problematic task, at least in the<br />
short term.<br />
D6.1 The management and regulation<br />
of road freight traffic<br />
Within the framework of the Zurich group, the Alpine countries<br />
have prepared an accurate inventory of the measures<br />
which exist in each country for regulating heavy goods<br />
vehicle traffic through the <strong>Alps</strong> and are in the process of<br />
collecting opinions from the various parties involved, in order<br />
to perform an assessment of the existing or planned traffic<br />
management systems; the major objective is to reach joint<br />
or jointly-agreed actions, favouring a global approach to the<br />
Alpine space. In this context, two areas of work are particularly<br />
significant:<br />
• proposals for extension of the effective measures<br />
already implemented by certain Alpine countries and<br />
able to be transposed to others, and<br />
• the expert study of new regulatory systems such as the<br />
principle of an Alpine transport exchange, proposed by<br />
Switzerland.<br />
of social legislation, the legislation governing the transport of<br />
dangerous goods, technical checks at the roadside, cargo<br />
securing, weights and dimensions as well as the legislation<br />
governing road haulage and also the compliance with legal<br />
provisions.<br />
Roadside checks by the BAG which also include the feeder<br />
roads to the <strong>Alps</strong> were carried out on about 615,000 vehicles<br />
in 2005 (approx. 50% domestic and 50% foreign vehicles).<br />
The offender rate determined during those checks amounted<br />
to about 19.9%. Infringements of the social legislation<br />
(driving and resting periods) accounted for 60% of the<br />
offences, infringement of the road traffic law for about 25%.<br />
Austria – night traffic ban<br />
In Austria, due to the NO 2<br />
limits having been substantially<br />
exceeded, the government of Tirol has ordered night traffic to<br />
be prohibited on a 46 km section of the Inntal A12 motorway<br />
from winter of 2002/2003.<br />
France and Italy – tunnel cooperation and traffic monitoring<br />
Heavy goods traffic at the Mont Blanc and Frejus tunnels has<br />
been divided according to the conditions after reopening of<br />
Mont Blanc tunnel. Bilateral safety measures have also been<br />
taken at the Tende road tunnel (see subchap. A1.2.2).<br />
At Montgenevre pass, due to the physical characteristics<br />
of the road, heavy goods vehicles of more than 26 tonnes<br />
have been prohibited since August 2003, except for limited<br />
exemptions. A binational monitoring committee has been set<br />
This exchange would require a common approach by all<br />
Alpine states. It would allow, through market mechanisms,<br />
the management of the restricted road capacities on Alpine<br />
passes, or of the number of trips through the <strong>Alps</strong>.<br />
Germany – Monitoring of freight transport<br />
With a view to the improvement of road safety, environmental<br />
protection and fair competition, great importance is attached<br />
to the enforcement of rules and regulations.<br />
The task of enforcement is, in principle, incumbent on the<br />
police authorities of the Federal Länder. Moreover, by virtue<br />
of its powers, the Federal Office for Goods Transport (BAG),<br />
performs roadside checks at federal level mainly in the sector<br />
In Austria toll charges for motorcars are controlled by video (Source: ASFINAG).<br />
117
Report on the State of the <strong>Alps</strong><br />
up. Similar provisions have existed since July 2003 at the<br />
Larche/Maddalena pass.<br />
To take it further, which entails indispensable but proactive<br />
action, it will be necessary to include these measures in the<br />
wider context of traffic management over the whole Alpine<br />
space (see also text box on AlpCheck). If the measures<br />
established for regulating road traffic consisted only of transferring<br />
the charge that cannot be applied to the other routes,<br />
it would be inapplicable for population living alongside the<br />
road and ill-suited to the objectives of the Alpine Convention.<br />
Case study: Interreg IIIB-project AlpCheck<br />
Problems related to data sharing on mobility are evident,<br />
mainly due to differences in the data collection systems<br />
that lead to a difficult homogenization. AlpCheck aims to<br />
create an informative system able to manage data coming<br />
from the existing monitoring systems in the Alpine<br />
area. It should be global but it will have to adapt itself to<br />
the characteristics of each user. The system has to adapt<br />
itself to multiple requirements and various contexts and<br />
different types of travel.<br />
Project objectives: Tasks integrated with the system and<br />
developed through pilot projects are<br />
• to investigate with innovative technologies local,<br />
tourist and freight traffic flows,<br />
• to analyse the consequences of the traffic in<br />
environmentally critical points, and<br />
• to underline in the whole mobility network the routes<br />
of “empty trucks” in order to define a freight flow<br />
reallocation.<br />
Source: http://www.alpinespace.org/alpcheck.html<br />
D6.2 Identification of optimum<br />
pricing for freight transport<br />
The reality of transport costs, as a means of real competition<br />
between the different transport modes, is an important area<br />
of work for the Alpine countries. Part of the work of the Alpine<br />
Convention transport group includes the task of identifying a<br />
better pricing system for trans-Alpine road transport, incorporating<br />
all external factors, based on the comparison of the<br />
practices of the various countries and the cost of transport<br />
over major routes (see also information on road pricing in<br />
chapters A1 and C1).<br />
At the same time, each country is attempting to increase<br />
the costs of its road journeys within the framework of the<br />
wider applicable rules, which also explains the expectation of<br />
new possibilities opened by modification of the Eurovignette<br />
directive (see chapter D3).<br />
In 2005, Germany introduced a system of toll charges for<br />
heavy vehicles using the motorway infrastructure (LKW<br />
Maut), calculated in relation to the emission of pollutants<br />
and the mileage covered. After deducting the costs<br />
of operating, monitoring and inspecting the system, the<br />
toll charges received are allocated to constructing and<br />
improving transport infrastructure.<br />
In Austria, toll charges for heavy goods vehicles and coaches<br />
were introduced on the motorways and Austrian expressways<br />
on 1 January 2004. These are calculated in relation<br />
to mileage covered. In addition, the increase in the tax on<br />
mineral oils for diesel by 3 centimes per litre (but only 2 centimes<br />
for fuels without sulphur), on 1 January 2004, represented<br />
another step towards the allocation of real costs of<br />
road transport. All vehicles above a permissible gross weight<br />
of 3.5 tonnes – in other words mainly commercial vehicles<br />
but also large motor homes and buses – will be obliged to<br />
pay a toll.<br />
2,000 km of the high-level-road network (motorways and<br />
expressways) – in the responsibility of the state-owned<br />
Austrian Motorway Company ASFINAG – are subject to the<br />
new toll collection system. Because the current EU-Directive<br />
99/62/EC permits tolls only in relation to the infrastructure<br />
costs, it has been decided that these costs will at least be<br />
credited on the basis of the distance travelled. Recipient of<br />
the toll revenues is ASFINAG, which is also responsible for<br />
toll collection.<br />
The toll rates – graduated in three classes according to the<br />
number of axles – have been fixed in November 2002 in a<br />
decree by the Minister of Transport on basis of the law concerned.<br />
The rate for vehicles with two axles is 0.13 EUR/<br />
km, with three axles 0.182 EUR/km (+ 40%) and with four or<br />
more axles 0.273 EUR/km (+110%). The theoretical average<br />
toll rate is therefore 0.22 EUR/km (excl. VAT).<br />
In France, the rate of TIPP on diesel fuel came closer to that<br />
for petrol in 2004. Various studies have been carried out to<br />
check how an appropriate pricing system might influence the<br />
behaviour of users in terms of use of the Alpine roads, or<br />
contribute to financing alternative infrastructures. These considerations<br />
will continue as part of the Lyon-Torino project,<br />
with France and Italy having agreed, for all Franco-Italian<br />
journeys, to identify measures for regulation and pricing<br />
of road transport in order to ensure that the future rail link<br />
should be attractive.<br />
In Switzerland, to encourage the transfer between modes of<br />
transport (an objective included in the Federal Constitution<br />
since the acceptance of the article on protection of the <strong>Alps</strong>),<br />
the Mileage Related Heavy Vehicle Tax (MLHVT) has been<br />
implemented since January 2001. This fee applies the “polluter<br />
pays” principle and allows for offsetting of the effects<br />
of the gradual increase in the weight limit of lorries which<br />
reached 40 tonnes in 2005. The fee is charged on the Swiss<br />
and foreign vehicles of more than 3.5 tonnes and calculated<br />
on the basis of the mileage covered, the gross vehicle weight<br />
and the pollution emission rating of the vehicle.<br />
The joint land transport committee, which monitors the EU-<br />
Switzerland agreement, fixed the rate to apply from 1 January<br />
2005, until the entry into operation of the Lötschberg base<br />
tunnel (opened since June 2007). These rates are based<br />
on a weighted average of 178.42 EUR (CHF 292.50) for a<br />
40 tonne vehicle over a 300 km distance. Two thirds of the<br />
MLHVT received is allocated to financing the NRLA and<br />
other major public transport infrastructure projects.<br />
118
Chapter D – Alpine Relevant Traffic Policies and Cooperation in the <strong>Alps</strong><br />
D6.3 Optimization of rail corridors<br />
Looking ahead to 2020, the projected new trans-Alpine rail<br />
infrastructure is not sufficient to fulfil the need to present<br />
tangible signs of real support for alternative modes of freight<br />
transport. It is essential to combine practical actions in terms<br />
of successive phases of time, to first stabilise the current<br />
situation of freight transport across the <strong>Alps</strong> by rail, and then<br />
to attempt to make progress wherever possible and however<br />
possible. This implies the use of coordinated measures from<br />
one end of the economic route to the other to improve the<br />
service offered on the existing different rail corridors, and to<br />
progress towards network interoperability. This objective is<br />
largely monitored by the Alpine Convention transport group.<br />
The Brenner 2005 plan<br />
In July 2002, representatives of the Ministries of Transport<br />
from Germany, Austria, Italy and Greece decided to form<br />
three working groups, which would be responsible for finding<br />
solutions to the current problems in the trans-Alpine transport<br />
of freight, by developing, first and foremost, measures<br />
intended for combined transport in the Germany-Austria-<br />
Italy corridor on the Brenner route. The objective was to<br />
achieve an increase in the combined transport volume on the<br />
Brenner route by 2005, of at least 50% in comparison with<br />
2001. The measures have been grouped into the “Brenner<br />
2005” action plan.<br />
By adopting this action plan, all the transport and administrative<br />
economic interests have contracted highly practical,<br />
tangible responsibilities with the aim of coordinated action<br />
for the purpose of increasing the capacities and improving<br />
the competitiveness of trans-Alpine freight transport by rail.<br />
The ‘Brenner 2005’ action plan consists of three packages<br />
of measures:<br />
• package no.1 consists of top priority measures, for which<br />
implementation has started immediately,<br />
• package no.2 concerns measures, for which implementation<br />
has been able to start after a relatively short period<br />
and which aim to improve competitiveness, and<br />
• package no.3 concerns measures which can be implemented<br />
in the medium term, for example infrastructure<br />
measures, which will form the foundation for long-term<br />
growth of combined transport.<br />
The results of the implementation of these measures are in<br />
some cases very positive. The packages are covered by a<br />
monitoring report produced each year. The data for 2005<br />
data show a 21% increase in unaccompanied combined<br />
transport, and a 63% decrease in accompanied combined<br />
transport, leading to a total decrease of 19%. Some specific<br />
outcomes of the action plan are presented in chapter A1.3.<br />
The IQ-C corridor (International Group for Improving the<br />
Quality of Rail Transport in the North-South-corridor)<br />
In January 2003, a Memorandum of Understanding was<br />
signed by the ministers of the four countries of the North-<br />
South corridor via Simplon and Gotthard, namely Italy,<br />
Germany, the Netherlands and Switzerland.<br />
The IQ-C programme specifies a range of short-term measures<br />
aiming to identify and eliminate the current weak points<br />
of the rail corridor, with the aim of encouraging transfer between<br />
modes of transport. Concrete measures are described<br />
in chapter A1.3.<br />
Currently, the IQ-C group is concerned, first and foremost,<br />
with analysing the introduction of the ETCS in the North-<br />
South corridor (the variables affecting infrastructure are<br />
evaluated with respect to their benefit/cost ratio). It is planned<br />
to install ETCS on the whole corridor by 2012/15. This would<br />
allow locomotives equipped with a single safety device to<br />
use the whole corridor.<br />
Maurienne Corridor, Aiton-Orbassano rail motorway<br />
experiment<br />
The service on the Aiton – Orbassano line should be extended<br />
to 20 return journeys a week, from the end of the work of<br />
modernising the historic line. In the very short term, priority is<br />
given to improving the frequency of the shuttle service and to<br />
completing the work in the tunnel. During the Franco-Italian<br />
summit of 4 October 2005, the French and Italian Ministers<br />
decided to initiate studies of forms of operation for the subsequent<br />
service, after the work is completed.<br />
In the medium term, the ministers have also decided to draw<br />
up a coordinated action plan to optimise the rail service on<br />
the existing line, in order to curb the drop in the market share<br />
held by rail freight transport and to establish the credibility<br />
of the Lyon-Torino project in the long term. For this purpose,<br />
RFF, RFI, SNCF and Trenitalia, under the aegis of the two<br />
Ministries, will put together a practical action plan. France<br />
and Italy could then sign a memorandum of understanding,<br />
as in the approach taken for Brenner by Germany, Austria<br />
and Italy.<br />
D6.4 Offering alternatives using sea<br />
and river modes<br />
Development of fast sea transport routes in Mediterranean<br />
For France and Italy, it is important to facilitate bypassing<br />
the <strong>Alps</strong> and to lighten traffic on the major road transport infrastructure.<br />
This is particularly relevant due to the development<br />
of high-frequency and high-quality sea links, both for<br />
the North-South or Mediterranean long distance route, and<br />
for the Iberian Peninsula-France-Italy link or the France-Italy<br />
link. France has made a solid commitment to financing these<br />
projects planned by the France Transport Infrastructure<br />
Financing Agency (AFITF).<br />
A group of studies is currently in progress, with the aim<br />
of launching a request for proposals jointly with Italy and<br />
Spain in 2007. In particular France, as part of the CIG of the<br />
southern <strong>Alps</strong>, has conducted a study concerning the potential<br />
volume of traffic that can be transferred from road to a fast<br />
sea route such as this.<br />
This study, which looked at just under ten potential routes,<br />
was based on a comparison of the “door-to-door” transport<br />
costs. It shows that fast sea routes are a credible alterna-<br />
119
Report on the State of the <strong>Alps</strong><br />
tive to the “all-by-road” approach, with, in theory, a potentially<br />
substantial volume of traffic able to be picked up. But the<br />
sea route approach is very sensitively affected by transport<br />
costs, frequency, quality of maritime service, and organisational<br />
investment constraints for the operators.<br />
In addition, the Toulon – Civitavecchia line (mixed freight<br />
and passengers), created in January 2005, is a coastal route<br />
which might be suitable to become a “sea motorway”, in the<br />
event of an increase in capacity and frequency. Currently<br />
the average load factor in the region is about 40%. Three<br />
departures a week in each direction are offered with a journey<br />
time of 14 hours for a price of about 450 EUR for a heavy<br />
goods vehicle with driver. In comparison, using “all by road”<br />
transport, the trip would amount 800 EUR and 22 hours of<br />
driving.<br />
In Germany, the transfer of freight to waterway<br />
A reduction of the transit goods traffic by land transport<br />
modes can, in principle, apart from the possibilities inherent<br />
in the inland waterways, also be achieved by means of short<br />
sea shipping. In Germany, the “From road to sea/waterway”<br />
concept is vigorously pursued as a key issue of transport<br />
policy in order to make progress with the decongestion of<br />
road traffic for the benefit of transport services by waterway;<br />
indirectly, the concept also takes account of trans-Alpine<br />
freight traffic.<br />
120
Chapter D – Alpine Relevant Traffic Policies and Cooperation in the <strong>Alps</strong><br />
D7<br />
Encouraging Sustainable<br />
Mobility for the Population<br />
in the Alpine Space<br />
Freight transport represents a substantially significant<br />
element of transport in the Alpine space. But it should<br />
not be forgotten that more than 13 Mio people live in<br />
this area. For their everyday life and leisure activities, as<br />
for the tourists and visitors attracted by the exceptional<br />
quality of the <strong>Alps</strong>, encouraging sustainable mobility in<br />
movements of people within the <strong>Alps</strong> is a requirement<br />
that holds a high priority in the transport protocol of the<br />
Alpine Convention.<br />
Encouraging sustainable mobility is based on actions<br />
taken at local level by the competent local and national<br />
authorities, which makes it a focus of interest for the<br />
organisations involved in the Alpine Convention. Many<br />
projects are also developed through the Alpine space<br />
INTERREG programmes (see chapters D7.2 and D8).<br />
D7.1 Sustainable mobility of<br />
passengers in and around<br />
Alpine communities<br />
Sustainable passenger mobility takes place at different levels,<br />
such as inner urban traffic and local traffic as well as long<br />
distance traffic. A wide variety of initiatives and projects is<br />
under way to improve passenger mobility in the Alpine area.<br />
For economic, ecological and recreational reasons, the bicycle’s<br />
role in the transport system is also gaining importance<br />
in developed European countries. Regardless of the age and<br />
social status, a wide range of people take up cycling.<br />
Some examples of successful policies are given below.<br />
Improvements in urban passenger transport in Italy<br />
In Italy, any towns of more than 30,000 inhabitants must produce<br />
an “Urban Traffic Plan”, consisting of pricing and regulatory<br />
measures, or even coercive measures in the event<br />
of prolonged and effective environmental alerts. The main<br />
objective is to regulate the use of the car, whether for routine<br />
journeys, which may be made more efficiently by using<br />
public transport, or for journeys in districts that continually<br />
experience congestion.<br />
The Urban Traffic Plan therefore aims to implement an integrated<br />
transport system (public funds and private vehicles,<br />
urban and extra-urban services and public transport services<br />
managed by various operating entities), both in terms of<br />
infrastructure and services offered and in terms of demand<br />
control and regulatory activities: park-and-ride facilities, cycle<br />
paths, town centre shuttle services, etc.<br />
Some particularly interesting actions for all these plans have<br />
been developed in the towns of the Alpine space: Imperia, Bergamo,<br />
Bolzano, Brescia, Como, Trento, Trieste and Udine. For example,<br />
since 1998, Udine has more than tripled its park-and-ride<br />
facilities, and Imperia and Bergamo have doubled their paid<br />
parking spaces. The larger Alpine towns have also instituted<br />
traffic limiting zones and pedestrian areas. This policy<br />
received a particular boost in Udine and Trieste.<br />
Other actions also contribute to a sustainable local mobility,<br />
such as<br />
• the development of cycle paths (Trento, Trieste, Udine), and<br />
• programmes for developing innovative vehicles for<br />
public transport (Imperia, Udine, Trieste, Trento).<br />
It should be noted that in Brescia, Bergamo and Trieste,<br />
there is an obligation to control exhaust gas emissions exist<br />
(application of a blue sticker, the Bollino Blu).<br />
On the other hand, the Italian Alpine towns remain behind in<br />
setting up telematic systems for traffic management (even<br />
though some of them, such as Brescia, have interesting initiatives),<br />
and makes too little use of the financing of innovative<br />
actions put into place in 1999–2000 by the State for ‘sustainable<br />
mobility’. Trieste is the only town which has a contribution<br />
for the development of innovative systems.<br />
Transborder regional railway connection between<br />
France and Switzerland<br />
Between France and Switzerland, a railway link project between<br />
Cornevin – Eaux Vives – Annemasse (CEVA project)<br />
is under study. It foresees the construction of a 4.8 km long<br />
railway tunnel between Cornavin – La Praille and Eaux-Vives<br />
– Annemasse. The line between Eaux-Vives and the French<br />
border will be doubled and will be constructed in the cut and<br />
cover mode. A bilateral convention project is being drawn up,<br />
which will concern such issues as end user competences<br />
and maintenance, electrical supply and infrastructure gauge.<br />
The railway link is planned to come into service between<br />
2010 and 2020.<br />
Another project now under consideration aims to improve the<br />
railway connection between Mendrisio and Varese (MEVA).<br />
The project includes a new, 5.2 km long line between Stabio<br />
and Arcisate (Italy). Entry into service is planned for 2010.<br />
In December 2005, the Federal Council adopted a message<br />
destined for the Parliament. It suggests that the costs of<br />
these two projects, which are to be financed by the Confederation,<br />
would be covered by an infrastructure fund reserved<br />
for agglomerations.<br />
Regional tram and coach extension around French cities<br />
In France, three projects are in the design phase or in the<br />
process of implementation in the Grenoble conurbation area,<br />
apart from the pricing integration at department level, established<br />
on 1 October 2002:<br />
• the implementation of a third tram line and the extension<br />
of the existing lines to Grenoble (to come into operation<br />
in 2006),<br />
• the metropolitan tramway: Grenoble-Moirans link, 18.5 km<br />
long (entry into operation expected in 2008), and<br />
• while waiting for completion of the above projects, an express<br />
coach link between Crolles, Grenoble and Voiron<br />
came into operation on 2 September 2002, running every<br />
10 minutes, as well as the use (currently experimental)<br />
of the hard shoulder of the A48 motorway, which is very<br />
often congested.<br />
121
Report on the State of the <strong>Alps</strong><br />
• development of regional city bus traffic between Telfs<br />
and Schwaz, using the new turntable at the Innsbruck<br />
bus station.<br />
Increasingly attractive conditions for public transport in<br />
Germany<br />
In Germany, Bavaria is endeavouring to transfer passengers<br />
in the Alpine region from private cars to public transport, by<br />
improving services and fixing attractive prices.<br />
From 1996, the government of the Free State of Bavaria,<br />
with the financial accommodation of the Federal State, put<br />
into place an integrated timetable (BayernTakt) which improves<br />
the attractiveness of public transport, in particular for<br />
leisure purposes, with wider implications for Alpine tourism.<br />
The majority of the tourist regions are integrated into the DB<br />
rail network. Terminal transport is provided by bus or shared<br />
taxi. The construction of park-and-ride facilities, close to the<br />
stations, is encouraged by financial support.<br />
Cross-border links already exist using short-distance public<br />
transport between Bavaria and Austria, like the Berchtesgaden-Salzburg<br />
link or the bus link between Reit im<br />
Winkel and Kössen. The Lake Constance card can be used<br />
to travel by rail, boat and bus throughout the lake region,<br />
from 21 EUR a day.<br />
Tramway in Grenoble (Source: S. Marzelli).<br />
Regional rail system development in Austria<br />
As part of the implementation of the infrastructure programme<br />
for local transport in Salzburg (NAVIS), a rapid<br />
transit system is being set up. This project plans for an<br />
automatic traffic timing system in the Salzburg–Strasswalchen,<br />
Salzburg–Golling and Salzburg–Saalachbrücke/<br />
Freilassing zones. The creation of 12 new stations in total,<br />
as well as two lines on the route connecting Salzburg’s main<br />
station to Saalachbrücke/Freilassing, and the establishment<br />
of regular time-controlled links, will allow for new development<br />
of local rail traffic from “greater Salzburg”, which will<br />
provide an attractive alternative to private vehicle use.<br />
In November 2003, the Tyrolean Government took the decision<br />
to improve the public transport system in the Innsbruck<br />
urban region in the form of a regional rail system and a city<br />
bus system running between Telfs and Schwaz.<br />
In November 2003 the Tyrolean Government took the<br />
decision to set up the following projects:<br />
• modernisation of the Stubaitalbahn to transform it into<br />
an attractive regional line, with direct access to the main<br />
station of Innsbruck on a new route allowing journey time<br />
to be reduced,<br />
• construction of of a new regional line between Völs and<br />
Hall in Tyrol, which will enable the town centre to be<br />
crossed using the existing tram-lines in combination with<br />
a service to the main station,<br />
• extension of the network of the Innsbruck tram system,<br />
partly using the new regional railway lines to be<br />
constructed, and<br />
The Bayern Ticket represents an attractive price for public<br />
transport throughout Bavaria. In addition, combined tickets<br />
have been launched in Bavaria, allowing the ticket holder to<br />
use several means of transport, such as the railway or the<br />
mountain railway. In Allgäu, the “Allgäu Card” can be used<br />
for public transport over short distances.<br />
Especially in the Alpine region, the local and regional authorities<br />
that organise public transport provide visitors with the<br />
option of using short-distance public transport at concessionary<br />
prices (ski bus, saver season ticket, day ticket, transport<br />
of bikes by train) and have created special routes for leisure<br />
traffic (for example: circular bus route from Wendelstein in<br />
the districts of Rosenheim and Miesbach).<br />
Light railways such as the “Bayerische<br />
Oberland Bahn” (BOB)<br />
have been successfully revitalised<br />
through the engagement of private<br />
railway enterprises.<br />
BOB<br />
Development of cycling in Slovenian communities<br />
Slovenia is endeavouring to promote changes relating to the<br />
choice of transport means in urban communities and to at<br />
least partly replace daily car commuting with cycling. Recently,<br />
a growing number of people have taken up recreational<br />
cycling in clean and friendly environment outside big towns<br />
on account for tourist, amateur sport or health preventive<br />
reasons. Cycling and walking areas are therefore becoming<br />
a focus of urban planners, designers and traffic experts.<br />
The national cycle network consists of long distance, main<br />
and regional cycle routes. The municipal cycling routes are<br />
connected with the national cycle network.<br />
122
Chapter D – Alpine Relevant Traffic Policies and Cooperation in the <strong>Alps</strong><br />
D7.2 Sustainable mobility of<br />
passengers in access to<br />
tourist sites<br />
The conference on “Environmentally Friendly Travelling in<br />
Europe – Challenges and Innovations Facing Environment,<br />
Transport and Tourism”, held on 30 and 31 January 2006<br />
in Vienna, provided an opportunity to report on numerous<br />
local experiences and cross-border cooperation. The aim was<br />
to encourage an intelligent provision of public transport for<br />
the tourist area itself, and to develop a serious provision of<br />
access to stations by rail rather than using private vehicles.<br />
Some directions for further work were proposed (see chap. E2):<br />
• encouragement of sustainable mobility via tourist areas<br />
as a factor in a positive competitive image,<br />
• development of cross-border cooperation between local<br />
authorities, transport operators and tourism operators for<br />
a better organised provision at the different levels of public<br />
transport in the <strong>Alps</strong>, and<br />
• acceleration of research into clean vehicles with lower<br />
use of non-renewable energy.<br />
This conference was also an opportunity for the communities<br />
involved in the “<strong>Alps</strong> Mobiliy II – Alpine Pearls”<br />
INTERREG programme (see chap. D8) to form themselves<br />
officially into an association, chaired by the mayor of Werfenweng<br />
(Austria).<br />
Wide acceptance of park-and-ride facilities in Germany<br />
In Germany, many municipalities have started to restrict the<br />
circulation of private cars in town centres, by creating parkand-ride<br />
facilities at the peripheries, sometimes linked to the<br />
centre by shuttle services, in order to reduce noise and pollution.<br />
The following Alpine towns are taking part in this project:<br />
Bad Aibling, Bad Kohlgrub, Bad Reichenhall, Bad Tölz, Bad<br />
Wiessee, Berchtesgaden, Fischen im Allgäu, Füssen, Garmisch<br />
Partenkirschen, Hindelang, Lindau, Mittenwald, Oberammergau,<br />
Oberaudorf, Oberstaufen, Oberstdorf and Ruhpolding.<br />
The current results show that this provision is widely<br />
used. The current results show that this provision is widely<br />
used, particularly during the summer months. For example,<br />
at Oberstdorf, up to 3,300 daily car journeys to or from the<br />
town centre are prevented by the park-and-ride offer.<br />
In the Bavarian <strong>Alps</strong>, the towns of Bad Reichenhall,<br />
Oberstdorf and Berchtesgaden are involved in the INTER-<br />
REG IIIB project <strong>Alps</strong> Mobility II. Its main objective is the<br />
creation of a combined provision using sustainable means<br />
of transport to go to the most beautiful countryside and the<br />
towns and villages that show the greatest respect for the<br />
Alpine environment.<br />
Cableway of major importance in Slovenia<br />
Slovenia provides cableway transport service for tourist<br />
and recreational purposes and as part of regular passenger<br />
transport services.<br />
Cableway transport in the Republic of Slovenia consists of<br />
more than 280 cableway installations, with six distribution<br />
cableways, 46 chair lifts and more than 230 drag lifts.<br />
These facilities are controlled by 47 operators, registered at<br />
the Chamber of Commerce and Industry of Slovenia. Among<br />
them, there are six sport centres of national importance,<br />
ten centres of regional and 39 centres of local importance.<br />
On average, the Slovenian cableway transport system carries<br />
more than 13 Mio passengers on a yearly basis. The<br />
objective is to establish a quality cableway system as an<br />
element of the overall Slovenian tourist provision.<br />
Case study: Results of the expert conference<br />
“Environmentally Friendly Travelling in Europe”<br />
In January 2006 Austria, while holding both the Presidency<br />
of the EU and the Presidency of the Alpine Convention,<br />
organised a large conference on “Environmentally<br />
Friendly Travelling in Europe” which produced widely<br />
acknowledged recommendations (see Annex). Based on<br />
a wide variety of projects and policy approaches presented,<br />
the recommendations of the conference provide<br />
a detailed framework for promoting tourism based on sustainable<br />
mobility and the integration of these endeavours<br />
in local development as well as a large variety of sectoral<br />
policies. For example the suggestions include,<br />
addressing the transport sector:<br />
• cross-border package offers using<br />
public transport,<br />
• logistic chains for luggage,<br />
• offers combining public transport<br />
and cycling,<br />
• integrated tariff-systems.<br />
addressing the destinations:<br />
•<br />
•<br />
•<br />
mobility management,<br />
origin/destination car-free service chains,<br />
creation of strategic partnerships between tourism<br />
industry and transport companies.<br />
addressing policy-makers:<br />
•<br />
•<br />
provision of reliable data,<br />
promotion of existing labels for destinations.<br />
More details are presented in the report Annex D7.<br />
Variety of tourist mobility offers in Austria<br />
Logo of the conference.<br />
In Austria the model project “Sustainable Mobility – Car-free<br />
Tourism”, was initiated in 1998 as a future-oriented common<br />
project for environment, tourism and mobility by three Austrian<br />
Ministries, the Land Salzburg and the two model communities<br />
Bad Hofgastein and Werfenweng. It was financially<br />
supported by the European Union.<br />
The project was initiated in recognition that a sound and<br />
clean environment is essential to attract visitors to a<br />
tourist resort. But tourism, particularly motorised transport,<br />
has negative impacts on the environment, including air<br />
pollution, noise and land use. Tourism is inherently linked<br />
to transport. Visitors travel to their holiday destinations and<br />
back home, and make local trips during their stay at a resort.<br />
The impact of motorised transport affects the region’s ecosystems<br />
and diminishes its recreational value.<br />
123
Report on the State of the <strong>Alps</strong><br />
Car-free travel to Bad Hofgastein is easy because the<br />
community is situated on the Tauern railway, the main connection<br />
between Munich and the South. The only problem<br />
is that the railway station is 2 km from the city centre. This<br />
means a change to bus or taxi. A private bus service therefore<br />
connects the railway station with the city centre. In Bad<br />
Hofgastein the focus is on a traffic management and the replacement<br />
of vehicles with internal combustion engines by<br />
electric vehicles for special purposes (car rental, car sharing,<br />
hotels, delivery): about 75 electric vehicles are in use<br />
in Bad Hofgastein. The city of Bad Hofgastein actively supports<br />
the bicycle as a means of transport and gave grants<br />
to every citizen for a new bicycle. Several hundred bicycles<br />
were bought by the citizens, before the project was officially<br />
closed in 2005.<br />
In Werfenweng, which has not got a railway station of its<br />
own, a dial-a-taxi-service, called the Werfenweng-Shuttle,<br />
has been set up to the next railway station, Bischofshofen,<br />
14 km from Werfenweng.<br />
The first solar re-charging station for electric vehicles in Austria<br />
was installed in Werfenweng (25 electric vehicles are in<br />
use in Werfenweng). A 12.5 m² photovoltaic system with a<br />
power of 2,200 W/h produces about 2,000 kWh/year for the<br />
electric vehicle fleet for visitors. A further focus lies on the<br />
development of a new tourism product. The special interest<br />
group “Holidays from the Car” offers special “all-inclusivepackages”<br />
(“mobile without a car”), partly in cooperation<br />
with international tour operators, some of whom specialise<br />
in travel by public transport. Information is already present<br />
in tour operators’ catalogues and tourism fairs. The group<br />
makes point-of-sales material, is implementing a new design<br />
for the communities’ PR, and organises information journeys<br />
for travel agency sales agents. All activities are accompanied<br />
by PR measures, e.g. press releases, newsletters, media<br />
cooperation (e.g. television spots in local TV), visualisation in<br />
the community (signs at the community entrances, stickers,<br />
pennants, flags), events (Sustainable and Mobile Day, carfree<br />
day with PR activities aimed at certain interest groups).<br />
Since 2006, Neukirchen am Großvenediger has been<br />
accepted as a model community in the project “Sustainable<br />
Mobility – Car-free Tourism”. Neukirchen am Großvenediger<br />
focuses first on the network of bicycle lanes and trails, being<br />
a well known community for mountain biking, and pedestrian<br />
trails as well as an improvement in car free access to Neukirchen<br />
by creating special offers.<br />
In the region Gesäuse, Eisenwurzen, Erzbergland in the<br />
Land of Styria, the project “Xeismobil“ in the framework of<br />
the INTERREG project “mobilAlp“ was initiated, to marry the<br />
needs of preserving public transport in an Alpine region with<br />
making the region accessible to tourists by sustainable transport<br />
means. 16 communities in the region work together to<br />
create offers for an individual nature experience starting from<br />
public transport stops or railway stations.<br />
The goals are reached by implementing a better offer on<br />
public transport (rail, bus, dial-a-ride), transport demand<br />
management by combining all transport means and through<br />
the implementation of a mobility centre, through marketing<br />
and through the implementation of alternative propulsion<br />
systems for public transport.<br />
Rental station for a variety of passenger transport vehicles in Werfenweng,<br />
Austria (Source: Tourismusverband Werfenweng).<br />
124
Chapter D – Alpine Relevant Traffic Policies and Cooperation in the <strong>Alps</strong><br />
D8<br />
Improving Transport in<br />
the <strong>Alps</strong>: some European<br />
Success Stories<br />
At the end of this part of the report some successful<br />
projects, carried out at a transnational level in the<br />
Alpine space are presented. Through these examples the<br />
abstract framework of policies may become more visible<br />
and tangible and may inspire further new activities.<br />
D8.1 Digest of current INTERREG<br />
projects<br />
The INTERREG IIIB “Alpine Space Programme” developed<br />
by the EU (with an investment in the structural funds amounting<br />
to 59.7 Mio EUR over the period 2000–2006) encourages<br />
international cooperation to improve efficiency, intermodality<br />
and accessibility in the <strong>Alps</strong>. Eight projects were implemented<br />
in the period of 2000–2006:<br />
• the AlpenCorS project is concerned with the large-scale<br />
issues of a policy of road corridors in the Alpine space.<br />
In particular, it endeavours to define the form of corridor<br />
5 (Lisbonne-Kiev), identifying its spatial coherence, the<br />
role of the entities involved and the methods for bringing<br />
it into operation.<br />
• the <strong>Alps</strong> mobility II – Alpine Pearls project is concerned<br />
with actions of sustainable mobility in the tourism<br />
sector. It defines the “Alpine Pearl” label and aims<br />
to encourage communication of experiences concerning<br />
mobility.<br />
• the Alpine Awareness project aims to raise the<br />
awareness of several target groups about the issues of<br />
sustainable mobility in the <strong>Alps</strong> (young people, tourism<br />
professionals and transport professionals).<br />
• the AlpFRail project, in line with the strategy of transfer<br />
to alternative modes of transport, aims to develop international<br />
solutions to manage transport of freight across<br />
the <strong>Alps</strong>, putting the existing infrastructure to more efficient<br />
use and identifying the missing links (see below).<br />
• the Monitraf project aims to create tools for evaluating<br />
trans-Alpine traffic, to encourage the formation and<br />
activity of a network of partners, and to assess the effects<br />
of road traffic in the Alpine space.<br />
• the Alpnap project aims to forecast the emissions of<br />
atmospheric pollutants and noise pollution, caused by<br />
transport in particular, and to assess their impact on<br />
the environment, quality of life and health of those living<br />
along transport routes.<br />
• the Vianova project aims to reduce car traffic in the<br />
conurbations, particularly for individual journeys, and to<br />
motivate inhabitants to undertake more physical activities<br />
(cycling, walking).<br />
• the mobilAlp project deals with all kinds of mobility<br />
(home-work, tourism, trade), and must produce a chart<br />
of sustainable mobility in the <strong>Alps</strong>, in terms of protection<br />
of the territory and the environment, by development of<br />
public transport and clean technologies.<br />
Other projects have already been identified. They will be able<br />
to be developed in the next programme for 2007–2013, for<br />
which the major issue is the involvement of a greater number<br />
of Alpine local authorities. The proposed priority area “connectivity<br />
and accessibility” may encourage transport related<br />
activities. In addition to the programme of international cooperation,<br />
other programmes of cross-border cooperation<br />
around the <strong>Alps</strong> make their contributions to the solution of<br />
shared problems and provide frameworks adapted to the<br />
cooperation and development of the cross-border transport<br />
networks.<br />
Scientific Workshop on Mountain Mobility and Transport<br />
SWOMM<br />
The “Scientific Workshop on Mountain Mobility – SWOMM”<br />
took place in two sessions in 2005 (Bolzano) and 2006<br />
(Domodossola) and collected some of the most important<br />
research and scientific projects concerning transport and<br />
sustainable mobility in mountain areas, in the following<br />
thematic fields:<br />
• transfer of goods from road to rail,<br />
• Alpine corridors,<br />
• environment-friendly means of transport,<br />
• strategies for efficient transport systems,<br />
• traffic management,<br />
• impact of traffic on the Alpine environment, and<br />
• international aspects of Alpine transport.<br />
SWOMM was promoted by the Italian Ministry for the Environment,<br />
Territory and Sea (MATTM), in the framework<br />
of its activities for the AlpFRail INTERREG III B Alpine<br />
Space Project (aimed at establishing an Alpine railway<br />
network and shifting freight from road to rail) and developed<br />
in cooperation with the European Academy of Bolzano<br />
and the Committee for the Simplon tunnel centenary.<br />
In this framework, experts and officers of institutions involved<br />
in mountain mobility and transport at national and<br />
local levels from all the Alpine countries presented the<br />
results and issues concerning Alpine transport in the first<br />
session. This was followed – in the 2 nd session – by a<br />
round table discussion of the main contents of SWOMM.<br />
A final publication focusing on the main topics raised<br />
during the two sessions of SWOMM has been issued<br />
(Angelini 2007).<br />
D8.2 Insights in selected INTERREG<br />
projects<br />
INTERREG IIIB project “Alpine Freight Railway” (AlpFRail)<br />
AlpFRail project, launched in summer 2003, aims at<br />
developing a transnational solution to cope with trans-Alpine<br />
goods transport using the existing infrastructure (cp. also information<br />
on AlpFrail in subchap. A1.3.2). In this connection,<br />
special account is to be taken of environmentally friendly rail<br />
transport mode.<br />
125
Report on the State of the <strong>Alps</strong><br />
The project is focused on inter-corridor solutions in terms of<br />
networks and systems. Moreover,<br />
missing links are to be identified and<br />
a traffic scenario is to be developed<br />
with an ensuing operational concept<br />
for Alpine transport, taking into consideration<br />
the enlargement of the<br />
EU to the east and the inclusion of<br />
the Mediterranean ports.<br />
For four years the lead partner, Logistik-Kompetenz-Zentrum<br />
Prien, cooperated with national governments, provinces,<br />
regions, chambers of commerce, associations, railway undertakings,<br />
carriers and ports from the entire Alpine arc<br />
in this project. This project was concluded in 2007. At the<br />
moment, specific projects such as the “Adria Train“ and the<br />
“Trailer Train“ are being fine-tuned.<br />
inteRREG IIIB project “<strong>Alps</strong> Mobility II – Alpine Pearls”<br />
The idea for the project was developed against the backdrop<br />
of the endangerment of the sensitive Alpine space by motorised<br />
traffic, which has considerably reduced not only the<br />
ecological balance but the recreational value as well. The<br />
focus of the project was the creation of innovative eco-tourism<br />
offers called “Alpine Pearls”.<br />
The project, which follows up the successful project “<strong>Alps</strong><br />
Mobility” in the framework of INTERREG IIC, had a financial<br />
volume of 3,216,960 EUR (of which the EU co-financed<br />
50%) and ran from May 2003 to September 2006. Partners<br />
from Germany, France, Italy, Austria and Switzerland worked<br />
transnationally and transsectorally. They produced and implemented<br />
innovative environmentally<br />
friendly solutions for soft<br />
mobility, car-free tourism and sustainable<br />
regional development.<br />
The “Alpine Pearls” offer combined points of interest to tourists<br />
and the advantages of soft mobility with environmentally<br />
sound means of transport. The objective was the creation of<br />
an attractive mobility and tourism package for a pleasurable<br />
and comfortable journey to the most beautiful landscapes<br />
and the most environmentally friendly resorts in the <strong>Alps</strong>.<br />
Transportation will be provided by train and bus, taxi, and<br />
environmentally friendly vehicles, as well as by ship or boat,<br />
bicycle, or on foot, and horse-drawn carriages or sleighs. In<br />
order to become an “Alpine Pearl,” each partner region has<br />
to fulfil certain mobility and tourism standard in terms of sustainability,<br />
according to a fixed criteria catalogue.<br />
rounding regions, e.g., bicycle routes, charter trains and<br />
charter buses,<br />
• improvement of regional mobility services (e.g. innovative<br />
public transport services, promotion of non-motorised<br />
transportation, use of the latest mobility technologies,<br />
etc.) and improvement of infrastructure conditions<br />
(e.g. traffic calming measures, improvements for cyclists<br />
and pedestrians), and<br />
• development and implementation of a common PR strategy<br />
for the tourism product.<br />
The basis for participation as an “Alpine Pearl” is the criteria<br />
catalogue, which takes into account all facets of an attractive,<br />
soft-mobile holiday destination. The criteria encompass<br />
the following areas:<br />
• transportation in general, mobility / transportation to the<br />
pearl, mobility guarantee in the holiday region,<br />
• tourism, regional and local development, and<br />
• nature and environment, culture, education, participatory<br />
planning.<br />
The “Alpine Pearls Association – Promotion of Sustainable<br />
Tourism with Environmentally Friendly Mobility,” as the umbrella<br />
organisation of the participating communities, links<br />
partner regions and communities in the entire Alpine space.<br />
This network of soft-mobile “Alpine Pearls” is being built up to<br />
become a strong tourism label for soft mobility.<br />
The association’s budget consists of proceeds from membership<br />
and marketing fees. Other income is based on subsidies<br />
and sponsoring. With these proceeds, the association<br />
finances common marketing and communication activities,<br />
its management, and events.<br />
Currently, the following communities are members of the<br />
Alpine Pearls Association: Werfenweng, Chamois, Ratschings,<br />
Villnöß, Welschnofen, Deutschnofen, Steinegg,<br />
Tiers, Feltre, Pievi di Cadore, Forni di Sopra, Sauris, Berchtesgaden,<br />
Bad Reichenhall, Arosa, Interlaken and Les Gets.<br />
Bibliography<br />
Angelini, P. (2007): SWOMM – Scientific workshop on mountain<br />
mobility and transport 2005-2006. Eurac research,<br />
Bolzano.<br />
The work consisted of the following steps:<br />
• specifying the details for trans-Alpine realisation in an<br />
implementation study, which was elaborated by a transnational<br />
expert group,<br />
• planning of the “string of pearls,” the sustainable travel<br />
chain to the <strong>Alps</strong> and between the partner regions, and<br />
the creation of bookable package modules,<br />
• development and improvement of mobility services and<br />
infrastructure conditions for an environmentally friendly<br />
travel chain between the resorts (“pearls”) and their sur-<br />
126
Chapter E – Main Conclusions for the <strong>Alps</strong><br />
E<br />
E1<br />
Main Conclusions<br />
for the <strong>Alps</strong><br />
Conclusions and Synthesis<br />
in View of Sustainable<br />
Mobility<br />
The results presented by the authors of the different<br />
chapters allow conclusions to be drawn in view of the<br />
objectives of sustainable mobility and of the Alpine<br />
Convention’s objectives in particular.<br />
Starting from this, at the end of this chapter an integrated<br />
view of the conclusions will be attempted. Based on this<br />
synthesis some options for action will be sketched. The<br />
chapter finally refers to the main challenges for policy<br />
which are the subject of chapter E2.<br />
Sustainable mobility<br />
The main objectives of sustainable development such as<br />
equity between present and future generations have been<br />
adopted by Member States and the EU in the renewed EU<br />
Sustainable Development Strategy. These objectives may be<br />
applied under the focus of this report on sustainable transport<br />
and mobility.<br />
In these terms sustainable transport and mobility would<br />
not endanger public health or ecosystems and would meet<br />
the needs for mobility consistent with the use of renewable<br />
resources below their rates of regeneration, respectively the<br />
use of non-renewable resources below the rates of development<br />
of renewable substitutes (cp. OECD 2000). It also<br />
includes the needs of economic development balanced with<br />
the other aspects of sustainability.<br />
<br />
<br />
<br />
<br />
<br />
<br />
<br />
<br />
<br />
<br />
<br />
<br />
<br />
<br />
<br />
<br />
<br />
<br />
<br />
<br />
Fig. E1.1: Dimensions of sustainable development (Source: EUDB).<br />
Mobility has been defined (see chapter A) as a basic social<br />
and economic human need, but this does not necessarily<br />
mean in every case physical transport of goods or persons.<br />
Basically it is possible to provide increasing mobility in terms<br />
of possible activities with less transport. Shortly said: main<br />
objective for sustainable mobility is mobility of citizen but not<br />
transport. Although an important need, mobility remains only<br />
one societal objective among others (SRU 2005).<br />
Mobility in the <strong>Alps</strong> as well as in the whole of Europe has to<br />
face the well-known dilemma between the present economic<br />
dependency on a reliable transport system and its sometimes<br />
negative impacts on life quality and environmental quality.<br />
Long term developed transport supply and demand patterns<br />
need to be developed towards sustainable mobility structures.<br />
This will require the horizontal integration of reduced<br />
transport demands as an policy objective (EEA 2006).<br />
The specifics of mountain regions when talking about<br />
traffic effects<br />
Regarding transport conditions and traffic effects mountainous<br />
areas are very different from flatland areas. The morphological<br />
shape demands different constructions of traffic<br />
infrastructure like galleries, tunnels, bridges etc. Costs for<br />
construction and maintenance of infrastructure are often<br />
higher. Accessibility may temporarily be restricted by weather<br />
and road conditions as well as by natural hazards (e.g.<br />
avalanches, land slides, rock fall like on the Gotthard-route<br />
during summer 2006 etc.)<br />
Mountains provide recreational and aesthetic landscapes<br />
and high biodiversity because they extend through different<br />
altitudinal zones. Large unfragmented areas are an endangered<br />
resource for recreation and sometimes represent the<br />
last retreat for animals with large habitat demands. This peculiar<br />
characteristics make the alpine space highly attractive<br />
for leisure activities and tourism.<br />
Morphology also leads to the concentration of traffic flows<br />
on a limited number of routes, often in narrow valleys where<br />
human population density is also high. So the potential for<br />
conflicts between social life quality of inhabitants, economic<br />
requirements and ecology is often higher than in flatlands.<br />
The relief and the narrowness of many valleys limit the<br />
air volume for reception of emissions and have amplifying<br />
effects on traffic noise. In addition the particular meteorological<br />
conditions like inversions and local wind systems impede<br />
the rarefaction and transportation of pollutants.<br />
E1.1 The transport system<br />
The transport system has been explored in this report in<br />
respect of the most important transport modes in the <strong>Alps</strong> –<br />
road and rail. Within this transport infrastructure (chapter<br />
A1) lies the basis for transport activities. These are freight<br />
transport (chapter A2) and passenger transport (chapter A3),<br />
both of which are divided into road and rail.<br />
E1.1.1 Transport infrastructure<br />
Road<br />
Road density in the Alpine area corresponds at least to general<br />
European averages, so no further efforts are necessary<br />
to achieve conditions comparable to other areas of Europe.<br />
Local improvements may still be necessary to widen existing<br />
bottlenecks and ease burdens for people living close to<br />
roads with very high traffic loads. The improvement of the<br />
Alpine road infrastructure is needed above all to increase the<br />
safety standard especially in the tunnels. In general improve-<br />
127
Report on the State of the <strong>Alps</strong><br />
ments of infrastructure for easier interoperability between<br />
different transport modes and an intensified implementation<br />
of traffic management systems can offer efficient and smart<br />
solutions.<br />
Road pricing still is affected by heterogeneity between countries<br />
but will be made easier with the implementation of the<br />
EU-Directive on the Eurovignette. Successful results of the<br />
Swiss LSVA in terms of modal shifts promise to encourage<br />
this approach. In future, mileage related tolls may have<br />
stronger effects on transport, on regional and long distance<br />
traffic equally. <strong>How</strong>ever it remains the question on which<br />
parts of the national road systems these tolls will apply to.<br />
Railway<br />
As with the road infrastructure, the railway density in the<br />
Alpine area also corresponds to EU averages. In the last<br />
decades the modal split has moved increasingly towards<br />
road transport.<br />
Therefore the increases may be compensated for either by<br />
more effective use of the existing rail network, or by carefully<br />
selected upgrades or extensions of the railway infrastructure.<br />
Such measures are a precondition to compensate for<br />
the predicted increase in freight volumes and to offer more<br />
competitive services.<br />
Insufficient interoperability between the different national<br />
railway infrastructures represents an important bottleneck<br />
of railway infrastructure. Optimisation of interoperability and<br />
of schedules may explore further potential for a successful<br />
increase in rail transport.<br />
Development of transport infrastructure needs intensified<br />
consultation and participation<br />
Infrastructures are a long term investment in terms of financial<br />
effort as well as in the effects in space and development.<br />
In many countries, responsibilities for infrastructure development<br />
are still shared between different organisations. Considering<br />
the long-lasting effects, consultation between the<br />
responsible authorities and efforts to achieve integrated solutions,<br />
already at strategic level, should be intensified.<br />
Concerning the construction of large infrastructures, decision-making<br />
processes should be applied and local governance<br />
and participation promoted, which involve stakeholders<br />
at all levels. This could help in assessing the possible social<br />
consequences the infrastructure might produce at local level<br />
(see Dematteis & Governa 2002).<br />
For example a possible strategy might be, to strengthen<br />
regional and local transport networks which are able to connect<br />
the local territory to the main infrastructure and to create<br />
favourable effects also in the long run, whose positive consequences<br />
will be felt at the local level.<br />
E1.1.2 Freight transport<br />
The amount of freight transport is increasing both on road<br />
and on rail, however road freight transport is growing at a<br />
higher rate.<br />
Road freight transport<br />
A detailed comparison of the main Alpine crossings in the last<br />
few years is difficult due to bypass effects following tunnel<br />
accidents and closures. But in general a significant increase<br />
in total road transport volumes is reported for most Alp crossing<br />
passes (see Fig. A2-6). The highest traffic load is on the<br />
Brenner pass. The share of long distance transport is estimated<br />
to be about 47% of the total road freight transport.<br />
The reasons for the increasing share of road transport may<br />
be found in the way international transport is organised,<br />
serving complex production processes of pre-manufactured<br />
and singly delivered parts in tight time schedules.<br />
Accidents in recent years have underlined that tunnel safety<br />
will be a key element for maintaining predictable road freight<br />
transport. Therefore improvements of safety measures for<br />
road tunnels are under way almost for all long road tunnels.<br />
Rail freight transport<br />
Against the backdrop of generally increasing freight transport<br />
(up to 24% in the period 1994–2004 in terms of transported<br />
tonnes) the highest share is transported across the<br />
St. Gotthard route. One remarkable observation is the successful<br />
shift towards rail freight transport in Switzerland<br />
thanks to measures promoting Swiss rail freight.<br />
Some important requirements of rail freight transport comprise<br />
punctual delivery, short and reliable transport times or<br />
current information on the transport progress. In particular<br />
cross-border rail transport suffers from slow transport speed<br />
and delays due to technological differences such as rolling<br />
stock and signals.<br />
The increase in the amount of rail freight transported will<br />
depend also on improvements to the infrastructure itself, in<br />
terms of electrification and performance.<br />
The lack of interoperability between the different infrastructures<br />
and equipment limit the competitiveness of rail freight<br />
transport.<br />
E1.1.3 Passenger transport<br />
Passengers are transported increasingly by car. Some case<br />
studies show that use of car transport is significantly higher in<br />
rural regions compared to urban areas. Some support for this<br />
development may come from the preference of infrastructure<br />
investment for road extension in the last decades. But<br />
urban development featuring sub urbanisation around former<br />
centres has also triggered this development.<br />
But also on long distance roads such as motorways a<br />
further increase in motorised individual transport could be<br />
observed.<br />
The development of rail transport is hard to interpret for the<br />
Alpine area as only few data were available to analyse. In<br />
Switzerland increasing passenger numbers are reported,<br />
while the national railway company offers an attractive and<br />
frequent service. Besides the railway, bus companies and<br />
on-demand services can serve local demand.<br />
128
Chapter E – Main Conclusions for the <strong>Alps</strong><br />
In view of the expected growth of passenger volumes even<br />
the effects of the envisaged upgrade of transport infrastructure<br />
will not be a sufficient solution. Therefore serious efforts<br />
are needed to improve the attractiveness of public transport<br />
and to support alternative transport modes in the future.<br />
E1.2 Economy, tourism and<br />
economic effects<br />
As the most important drivers behind transport in the economic<br />
field for this report, the economy (chapter B2) and<br />
tourism (chapter B4) have been selected. The economic<br />
effects deriving from development of transport and of the<br />
drivers have been analysed in chapter C1.<br />
In Europe the discussion of the interrelation of the economy<br />
and transport is about the positive effects of transport but<br />
also on the “two-way road principle” and spatial distribution<br />
effects of transport infrastructure for the economy. Passenger<br />
transport growth has paralleled economic growth at<br />
EU average levels, but freight transport volume has grown<br />
disproportionate to the GDP and here road freight transport<br />
is continuously increasing its market share. Also as a general<br />
phenomenon, access to basic services depends mainly<br />
on car use and is presently supported by price structures.<br />
Therefore the definition of external and internal costs, and<br />
the calculation of benefits for the economy are needed<br />
to make further progress. In Europe price structures are<br />
increasingly below the level of external costs, but there are<br />
promising developments in transport pricing (SACTRA 1999,<br />
EEA 2004, EEA 2006).<br />
E1.2.1 The economy<br />
One of the objectives of the Alpine Convention is to promote<br />
regional economic development, enhancing job opportunities<br />
as well as supplying the goods and services necessary<br />
for economic, social and cultural well-being.<br />
Polarised economic conditions in the Alpine area<br />
Despite the commitment of the Alpine Convention both in<br />
rural and urban areas, the Alpine arc is characterised by remarkable<br />
polarities of its economic conditions. Hence, significant<br />
differences regarding the economic situation can be<br />
detected between the various Alpine countries, regions and<br />
lower administrative units. Many of the economically strongest<br />
regions are situated in or close to the <strong>Alps</strong>. In general<br />
the contrast between the central part and the eastern and<br />
western fringes of the <strong>Alps</strong> is striking. The distribution of<br />
the GDP is particularly adapted to show this finding. With<br />
a few exceptions (e.g. the surroundings of Wien and Graz)<br />
functioning like a bridge there is a clear division between the<br />
particularly high values of the more centrally located parts of<br />
the <strong>Alps</strong> (e.g. Bayern, Swiss foothills) and the lower parts on<br />
their peripheral western and eastern flanks.<br />
Transport infrastructure does not guarantee that the local or regional economy will<br />
benefit, because traffic operates in two directions and an improved accessibility<br />
may sometimes benefit one and damage another region or city.<br />
<strong>How</strong>ever, there is a close economic interrelationship between<br />
the Alpine and non Alpine regions which is indicated by the<br />
high GDPs in the Italian part as a consequence of the economic<br />
centres included in the NUTS 3 level. Nevertheless,<br />
analyses on regional level showed the highly heterogeneous<br />
structure of the <strong>Alps</strong> even on the lowest spatial levels. In fact,<br />
prosperous municipalities often exist close to areas which<br />
are becoming depopulated.<br />
Not surprisingly the economically weak regions with a low<br />
GDP are mostly also regions with a high unemployment rate.<br />
As a consequence the regions with the highest unemployment<br />
rate are situated on the peripheral western and eastern<br />
border of <strong>Alps</strong> (Rhône-Alpes, Provence-Alpes-Côte d´Azur,<br />
Burgenland) while those with lower unemployment rates are<br />
mostly located close to the centre of the <strong>Alps</strong>.<br />
Role of transport for maintaining agriculture<br />
A good reflection of the various economic conditions and<br />
situation in the <strong>Alps</strong> even on regional level is given by the<br />
agricultural sector which is of outstanding relevance for the<br />
whole region due to its multifunctional services. In fact, on<br />
the one side there are regions with a relatively stable agriculture<br />
or a moderate agricultural decrease (e.g. Alto Adige/<br />
Südtirol, Swiss and Austrian regions).<br />
On the other side many regions register high farm abandonment<br />
rates (e.g. Slovenia, many regions in Italy and France).<br />
The exemplary situation of Alto Adige/Südtirol shows that an<br />
economically vital region featuring good transport infrastructure<br />
and access to jobs is one important prerequisite for a<br />
persistence of agriculture. This is confirmed by some authors<br />
who see a persistence of part-time-farms in regions where<br />
commuting to non-agricultural employment is feasible due to<br />
good accessibility to the local road network which permits<br />
commuting.<br />
E1.2.2 Tourism<br />
Tourism is an important economic branch in Alpine economy,<br />
even if only 9% of Alpine municipalities may be considered<br />
as tourism centres (cp. Fig. B4-1). These centres are often<br />
ski resorts. According to EU estimates about 80% of tourist<br />
journeys to the <strong>Alps</strong> are driven in private cars. Additional traffic<br />
originates from these tourist destinations due to day-trips<br />
undertaken by tourists.<br />
A case study for Austria suggests that summer tourists in<br />
particular are dependent on individual motor transport during<br />
their holiday stays. Bearing in mind that winter tourism might<br />
alter due to climate change, special efforts need to be taken<br />
to develop measures which encourage the use of public or<br />
non-motorised transport in the summer season.<br />
One main issue concerning the field of tourism related transport<br />
is the modal split of the journeys to and from the destinations.<br />
Both, the figures of the Brenner pass as well as<br />
those of the Austrian case study in chapter B4.5 indicate the<br />
related high pressures on the road system and subsequently<br />
on the Alpine population and environment.<br />
129
Report on the State of the <strong>Alps</strong><br />
In terms of tourism transport, three objectives are mentioned<br />
in the Alpine Convention:<br />
• encouraging of measures to reduce dependence on<br />
motorised vehicles in tourist resorts [Tourism Protocol<br />
Art. 13 (1)],<br />
• promotion of both public and private initiatives to improve<br />
access by public transport to resorts and tourist areas<br />
and encouraging of tourists to use these services [Tourism<br />
Protocol Art. 13 (2)],<br />
• establishment and maintenance of traffic-calmed and<br />
traffic-free zones, establishment of car-free tourist destinations,<br />
measures of promoting the car free arrival and<br />
stay of holiday guests [Transport Protocol Art. 13 (2)].<br />
For the future some questions may be of interest in particular,<br />
such as<br />
• Have there been any changes in transport behaviour<br />
of tourists after the restructuring of tourist destinations<br />
since the mid-nineties?<br />
• <strong>How</strong> much trans-Alpine tourism traffic is going to other<br />
destinations and how can the Alpine destinations influence<br />
this traffic?<br />
• Which part of tourism traffic is due to local mobility of<br />
tourists when at their destination?<br />
E1.2.3 Effects of transport on the economy<br />
Good accessibility, efficient transport infrastructures and<br />
modern mobility concepts can induce employment and consumer<br />
well being (and GDP) convergence (Alpencors 2005).<br />
Therefore, innovative transport policies could support further<br />
economic improvement in the Alpine area.<br />
Difficult assessment of the interrelation of transport and<br />
the economy<br />
The economic effects of transport on the Alpine regional development<br />
are quite difficult to assess. Different elements<br />
contribute to determine the economic well-being of a region<br />
and it is complex to isolate single effects with certainty.<br />
A relation between transport development, both in terms of<br />
infrastructures and services, and national economic growth<br />
as represented by GDP can be identified in regions with less<br />
infrastructure, while on the other hand other studies suggest<br />
that no correlation exists between transport infrastructure endowment<br />
and regional added value per capita. From market<br />
theory areas with better access to locations of raw materials<br />
and markets will, ceteris paribus, be more competitive than<br />
peripheral areas. <strong>How</strong>ever, this does not mean that good accessibility<br />
guarantees regional economic success and that a<br />
poor transport network implies poor economic performance.<br />
A transport improvement can successfully open an area to<br />
external competition with a negative effect on the local producers.<br />
Therefore the effects of transport on local economies<br />
can be both positive and negative.<br />
Economic prosperity of a location is also composed by “soft<br />
factors” such as the existence or avoidance of environmental<br />
problems, efficient governance structures and the perceived<br />
quality of life by people at this location.<br />
Transport infrastructures can also induce economic effects<br />
in a territory wider than the one they cross or link with. Since<br />
the main infrastructures crossing the <strong>Alps</strong> often have an EUwide<br />
relevance, their economic effects can reach far beyond<br />
the EU borders and assume a strategic function, as is the<br />
case for the Trans-European-Traffic-Networks (TEN-T) EU<br />
policy.<br />
An innovative and well-balanced transport policy can lead to<br />
substantial improvements in interregional trade and consumers’<br />
well being, not only according to an economic perspective<br />
(lower prices, wider choice of goods and services, faster<br />
connections, etc.), but also in terms of social and environmental<br />
benefits.<br />
In Western Europe the growth rate of transport services and<br />
infrastructures has been slowing down in the last 30–40 years<br />
in comparison to economic growth (GDP), even though further<br />
development of both freight and passenger transport is<br />
expected in the Alpine Space over the next 30 years, according<br />
to EU Commission studies. In any case no clear signs of<br />
decoupling between economic and traffic growth have been<br />
achieved in the Alpine space to date.<br />
External costs of transport<br />
The strong development expected for trade (in monetary<br />
value) and transport (in quantity) will also produce undesired<br />
effects on local economies, society and the environment<br />
which can be expressed economically as the external<br />
costs of transport. As long as these external costs are not<br />
reflected in transport costs for the end consumers, their mobility<br />
behaviour and market choices will not undergo a substantial<br />
change. The assessment of these costs is the first<br />
step towards their internalisation in the price of goods and<br />
services: the studies made in this direction led to an assessment<br />
of the relative dimension of external transport costs as<br />
being 7.3% compared to GDP of EU15+2 in the year 2000<br />
(INFRAS & IWW 2004).<br />
Through the growing interest in economic tools in the EU and<br />
Alpine territory and the adoption of some levies (especially<br />
on road transport), a higher degree of internalisation of external<br />
environmental and infrastructure costs is still a primary<br />
objective to be reached in the Alpine countries.<br />
E1.3 Population and effects on the<br />
social sphere<br />
The social sphere is compounded of results from analysis<br />
of population development (B1), the effects on the<br />
social sphere, particularly the ageing of the Alpine population<br />
(chapter C2.2) and effects on human health through air pollution<br />
(see chapter C3.1) and noise (see chapter C3.2).<br />
At the European level transport related health effects are<br />
reported owing to air pollution and also to greenhouse<br />
gas emissions which will indirectly contribute to health effects<br />
because of climate change (extreme weather can affect<br />
health, as can exposure to flooding and the spread of<br />
disease). For people living close to heavily used transport<br />
infrastructures, increasing health effects and impacts on<br />
130
Chapter E – Main Conclusions for the <strong>Alps</strong><br />
life quality are reported owing to road traffic injuries and<br />
noise. Also in urban areas transport related effects lead<br />
to increasing psychological and social impacts on health<br />
which finally result in a loss of life quality and mobility<br />
opportunities (PEP 2004, SRU 2005).<br />
E1.3.1 Population<br />
The population with its different motivational needs for mobility<br />
is without doubt the most important driving force for traffic<br />
development in and throughout the Alpine arc. All the demographic<br />
processes and the change in quality of life and customs<br />
influence the quantity and the kind of traffic.<br />
Population growth in the <strong>Alps</strong> compared to EU-level<br />
Some significant trends characterising the Alpine arc can be<br />
derived from the data presented in chapter B1. If compared<br />
to the European context the analysis shows a very dynamic<br />
population growth. The achieved growth rate of 7.8% exceeds<br />
the average rate of the EU-15 (3.2%) and the national<br />
values of the Alpine states (Tab. E1-1), too.<br />
<strong>How</strong>ever Map B1-1 confirms that this growth, contrary to<br />
one of the objectives of article 1 of the Alpine Convention, is<br />
not equally distributed over the Alpine arc. Comprehensive<br />
studies have detected increasing disparities for the inner Alpine<br />
territories (Favry et al. 2004). The modern infrastructure<br />
services and the changed personal needs, driving the migration<br />
process, have led to a polarisation of booming and<br />
depopulated areas in urban and peripheral centres and also<br />
in major and minor valleys.<br />
Country Population change [%]<br />
Austria 2.7<br />
France 4.9<br />
Germany 1.5<br />
Italy 1.8<br />
Liechtenstein 13.1<br />
Slovenia 0.4<br />
Switzerland 5.7<br />
EU-15 3.2<br />
Alpine Convention Area* 7.8<br />
Tab. E1-1: Population growth, comparison between Europe and <strong>Alps</strong><br />
(1994–2004); data refer to 1991–2001 (see Tab. B1-1); national and<br />
European data refer to 1994 and 2004 (Source: Eurostat, http://epp.eurostat.ec.europa.eu).<br />
Spatial patterns of population development<br />
The influence of the neighbouring metropolises (Milano, Torino,<br />
München, Wien, Lyon) on municipalities located on the<br />
Alpine border is growing and further growth is to be expected.<br />
These regions are characterized by their relatively good<br />
accessibility. Gradually these municipalities become suburbs<br />
of these metropolises. The intense expansion of traffic activities<br />
and the implementation of high-speed railways will probably<br />
support the establishment of commuter centres in the<br />
inner <strong>Alps</strong>.<br />
Municipalities in the peripheral areas of the inner <strong>Alps</strong> following<br />
the “tertiarisation” of jobs (particularly in tourism) will<br />
benefit from this growth potential. <strong>How</strong>ever, the municipalities<br />
of the southern Alpine arc are not the only areas to be<br />
negatively affected.<br />
An Alpine wide analysis detected also an increasing urbanisation<br />
along the central traffic corridors in the great inner<br />
Alpine valleys. These areas are characterised by strong<br />
dynamics. Due to their good accessibility, particularly from<br />
outside the Alpine arc, these areas are favoured locations<br />
for living in and for economic activities. Some examples are<br />
the valleys of Inn, Adige, Rhône, Valle d’Aosta, Venosta and<br />
Pusteria.<br />
E1.3.2 Effects on the social sphere<br />
Spatial segregation of living and working<br />
As a benefit, transport enables access to basic services like<br />
education, work, shopping and leisure activities, which are<br />
essential for economic and social activities.<br />
Over the last decades individual motorised traffic has gained<br />
a leading role in transport and society has been transformed<br />
along the way. Shops have moved out of the town centres<br />
to shopping malls, workplaces and living places can be further<br />
apart, giving individuals a broader choice of where to<br />
live, where to work and where to spend their leisure time.<br />
This results in a separation of living, working and shopping<br />
locations. For some regions this may help to slow down a<br />
depopulation trend by giving the people the opportunity to<br />
commute.<br />
An increasing number of elderly people will require<br />
attention<br />
The present analysis was focused on the particular category<br />
of elderly people. Old people form a consistent percentage of<br />
the Alpine arc population, in particular in the Italian <strong>Alps</strong> and<br />
in the Principality of Monaco. The analysis of the distribution<br />
of the old age index confirms the strong tendency to shift<br />
toward older ages of the Italian population in particular. This<br />
is caused by the emigration of the young people and the declining<br />
birth rate. The municipalities which suffer more from<br />
over-aging are the most and the least populated ones.<br />
Although the closer the proximity to the central chain of the<br />
<strong>Alps</strong>, the more the old-age index increases, no significant<br />
correlation has been detected between accessibility and the<br />
old-age index. In other words good accessibility alone does<br />
not guarantee a well-balanced social structure in the Alpine<br />
municipalities.<br />
Children, elderly and disabled people are disadvantaged<br />
by individual car traffic<br />
Together with this spatial segregation, the limited public<br />
transport supply in mountain areas leads to high car-dependence.<br />
Many individuals benefit from the possibilities gained<br />
mainly by private cars.<br />
131
Report on the State of the <strong>Alps</strong><br />
But some social groups, who do not have access to a car,<br />
benefit less or are even disadvantaged by individual motorised<br />
traffic. These groups are mainly children, elderly and<br />
disabled persons and all people who are unable to drive. The<br />
decline in public transport, together with the moving out of<br />
basic services from residential areas, reduces their life quality.<br />
As elderly people constitute an increasing percentage<br />
of the population, it is necessary to identify and meet their<br />
requirements.<br />
Modal split differs between urban and rural areas (see chapter<br />
A3), with a significantly higher degree of public transport<br />
in urban areas. The present transport situation means an<br />
inequitable distribution of advantage between rural and<br />
urban citizens as well as between different generations.<br />
In consideration of the increasing share of elderly people the<br />
assurance of mobility by an adequate public transport system<br />
for local as well as for long distance traffic will become<br />
more and more important.<br />
Decline of public services<br />
The low use of infrastructures and services due to depopulation<br />
in many peripheral mountain areas may constitute a<br />
further problem. The decline of shops and supply services<br />
within walking distance is a disadvantage not only for those<br />
people in peripheral areas who are not mobile but it also negatively<br />
affects the attractiveness of the municipalities themselves.<br />
The decline in public services in local centres is then<br />
reinforced by the decrease in population which also lowers<br />
service provision and weakens the local economy. This leads<br />
to a kind of vicious circle, as shown in Fig. E1-2.<br />
Decline of<br />
attractiveness<br />
Depopulation<br />
Decline of<br />
public services<br />
Fig. E1-2: Circle of demographic change and public services (Graphic:<br />
ifuplan).<br />
As a consequence, in these municipalities quality of life<br />
diminishes. This creates an additional motivation for the local<br />
young people to leave. As the older people, who constitute a<br />
considerable and still growing part of society, are physically<br />
less mobile, alternative supply systems such as E-commerce<br />
and other home delivery services will become of greater significance<br />
for them in their everyday lives.<br />
<strong>How</strong>ever, in order to maintain a well-balanced demographic<br />
structure and avoid the exclusion of any social or age group,<br />
adequate political and economic measures and cultural<br />
stimuli are needed for mountain areas. One way of solving<br />
these problems may lie at least partly in a better integration<br />
of transport and spatial planning.<br />
The increase in programmes and projects for the development<br />
of mountain regions which aim at improving the quality<br />
of life in less-favoured regions demonstrates how this issue<br />
of vital mountain regions has become of real political relevance.<br />
Spatial effects on social life quality<br />
Transport infrastructure can constitute not only a barrier for<br />
wildlife, but also for humans, by separating valleys or even<br />
communities. Also social life and social interactions near to<br />
much-frequented streets are less than in quiet residential<br />
areas. These effects sometimes lead, in a cumulative or<br />
synergistic manner together with air pollution and noise (see<br />
E1.3.3), to a decrease of life quality.<br />
E1.3.3 Health risks from air pollution and<br />
traffic noise<br />
Studies show that the same traffic load contributes to a concentration<br />
of nitrogen oxides in the ambient air in mountainous<br />
areas which is three times higher than in lowlands owing<br />
to meteorological particularities (EEA 2001). Because of the<br />
topography, the ambient air quality along steep valleys with<br />
high traffic loads is often as bad as in urban areas.<br />
Apart from individual motorised traffic, transport and traffic<br />
in general (irrespective of whether public or private, transit<br />
or intra-Alpine, freight or persons) has several effects on humans.<br />
People living close to traffic infrastructure suffer from<br />
air pollution and noise, both of which can lead to health problems<br />
or even diseases like respiratory and allergy problems,<br />
sleep and concentration disturbance, heart diseases or psychological<br />
symptoms. The weakest section of the population<br />
– children, elderly and disabled people – are often the most<br />
affected group (cp. chapters C3.1, C3.2).<br />
NO 2<br />
immissions as an indicator of acidifying and eutrophing<br />
substances were in decline until the mid 1990s. <strong>How</strong>ever<br />
since 1995 immissions are no longer declining, but slightly<br />
increasing. Analyses of air quality show that the 2010 EU<br />
limit values for NO 2<br />
are exceeded in annual means (up to<br />
32% of stations) as well as for short term peaks (see chapters<br />
C3.1 and C3.2).<br />
Ozone concentration increases particularly in high remote<br />
areas, frequently exceeding their EU limit values (2002/3/<br />
EC) under extreme conditions (up to 93% in 2003). These<br />
are less at urban traffic stations. Exposure to PM10 occurs in<br />
particular at urban and urban background stations and also<br />
significantly overruns the EU limit values (see chap. C3.1.3).<br />
Beneath the higher pressures from air pollution, the inhabitants<br />
of traffic-loaded Alpine valleys also suffer from traffic<br />
noise, the distribution of which also differs here significantly<br />
from flatlands (see chapter C3.2.3).<br />
As well as the indirect health effects of traffic via air pollution<br />
and noise direct health effects occur through traffic accidents.<br />
E.g. EU-regulation N° 1698/2005 on support for rural development by the European<br />
Agricultural Fund for Rural Development (EAFRD).<br />
E.g.: IMALP – Implementation of sustainable agriculture and rural development in<br />
Alpine mountains (2003–2006).<br />
132
Chapter E – Main Conclusions for the <strong>Alps</strong><br />
E1.4 Land use change and<br />
environmental effects<br />
Close interactions have been identified between land-use<br />
change and transport (chapter B3). Land use which determines<br />
where settlement areas are, is also steering effects on<br />
air quality (chapter C3.1) and noise (chapter C3.2).<br />
In Europe, land use has been identified as an important driver<br />
for loss of natural habitats, change of landscape amenities<br />
and loss or degradation of recreation areas (EEA 2004).<br />
The emission of air pollutants is declining in general, but<br />
in cities in particular air pollution remains problematic. The<br />
GHG emissions are still rising although technological improvements<br />
have been achieved but in many cases have<br />
been overcompensated for by transport increase (EEA 2004,<br />
2006). In consequence in the mid-term effects of changing<br />
natural hazards owing to climate change may be expected.<br />
It is expected that greater use of alternative biofuels and<br />
fuel development will contribute to emission reduction (EEA<br />
2006), however this will not affect the question of land take<br />
for further transport infrastructure.<br />
E1.4.1 Land use<br />
Densely settled areas experience a trend towards greater<br />
increase of settlement and traffic infrastructure areas – “infrastructure<br />
and people attract further infrastructure”. The<br />
area resource is mainly drawn from cultivated area. Except<br />
for Italy, in most regions forest is increasing too, also mainly<br />
drawing on cultivated area. So there are two transformations<br />
of cultivated area: in densely settled regions it flows to further<br />
settlement and infrastructure, whereas in other regions it is<br />
more likely to flow to forest.<br />
If one recalls former economic and social reasons for the<br />
extension of areas of human settlement into some Alpine<br />
regions, some central question arise:<br />
• Can a stable population in the <strong>Alps</strong> be maintained for the<br />
whole Alpine area in future at any costs?<br />
• Will this be a sustainable objective with regard to environmental<br />
and economic equity for other parts of the<br />
population?<br />
• Do we perhaps have to accept population decline in<br />
some areas as an adaptation towards modern economic<br />
conditions?<br />
The rate of loss of cultivated area per year is fairly low in the<br />
eastern and northern <strong>Alps</strong> (Austria, Germany, parts of Switzerland),<br />
whereas in the southern and western <strong>Alps</strong> (parts of<br />
Switzerland, France, Italy) it is much higher.<br />
Interrelation of land use and population change<br />
The concentration of settlements and different kinds of regional<br />
development (dynamic central regions versus marginal<br />
and peripheral regions) has a twofold impact on mobility<br />
needs: on the one hand there is not much political force to<br />
develop the traffic infrastructure of large peripheral areas,<br />
because of the demographic decline. Decreasing infrastruc-<br />
ture and accessibility, along with decreasing possibilities to<br />
generate income in return drives people to move into more<br />
central areas. This in turn contradicts the objectives of the Alpine<br />
Convention [§2, 2(a)], which strive to secure the whole<br />
Alpine area as a living space for people.<br />
On the other hand, growing population in certain (central)<br />
regions increases the need for traffic connections between<br />
those regions. The construction of high quality roads usually<br />
tries to meet those needs. This is contrary to the objectives of<br />
transport protocol [§1, 1(a)], which explicitly gives preference<br />
to railway connections over roads.<br />
Transport development supports the polarisation of<br />
functions<br />
The preferences are presently clearly set out to concentrate<br />
effective transportation facilities between the central regions.<br />
<strong>How</strong>ever, from a viewpoint committed to sustainability, such<br />
a polarisation of land-use development is not the target.<br />
Polarisation and functional separation of regions induces<br />
growing traffic, along with its associated problems for the environment,<br />
health, living quality, and social systems. According<br />
to the Alpine Convention Art. 2 § 2(b), the “harmonious<br />
development of the whole region”, specifically mentioned that<br />
the “avoidance of over- or under-use” should be supported.<br />
The mutual dependency of infrastructure development and<br />
land use changes requires an integrated approach to regional<br />
development. To increase the accessibility of peripheral<br />
regions it is more important to develop possibilities for gaining<br />
income than to extend traffic infrastructure.<br />
E1.4.2 Effects on air quality<br />
Air pollution and the deposition of pollutants from traffic contribute<br />
to acidification and eutrophication in terrestrial and<br />
aquatic ecosystems. Ozone acts as a cytotoxin and can in<br />
higher concentration cause damage to crops and forest trees<br />
as well as to wild plants.<br />
Summer ozone concentrations in the <strong>Alps</strong> have slowly increased<br />
since 1995, but in most areas not significantly.<br />
Ozone concentrations have frequently (up to 87% in the<br />
extreme summer 2003) exceeded the EU target values<br />
(AOT40) for the protection of vegetation at background stations<br />
in almost all Alpine countries (see Fig. C3-8). Owing<br />
to the process of ozone generation, remote areas are much<br />
more affected by high ozone concentrations than are areas<br />
close to traffic emissions.<br />
Whereas immissions at motorways and in towns are caused<br />
by local and regional emissions, extensive remote areas<br />
of the Alpine regions are affected especially by ozone and<br />
deposition of acidifying and eutrophying substances formed<br />
outside the <strong>Alps</strong>.<br />
• Art. 2 (2c) of the Alpine Convention contains general<br />
regulations for the prevention of air pollution. The objective<br />
is “to drastically reduce the emission of pollutants<br />
and pollution problems in the Alpine region, together with<br />
inputs of harmful substances from outside the region, to<br />
a level which is not harmful to man, animals and plants”.<br />
133
Report on the State of the <strong>Alps</strong><br />
More precise (qualitative) objectives directly oriented on<br />
traffic emissions are part of the Transport Protocol.<br />
• Art. 7 (2) focuses on the step-by-step reduction of contaminant<br />
emissions of all traffic carriers. Art. 3 (1a) requires<br />
the limitation of the input of substances from the<br />
atmosphere to a level which avoids damage of ecological<br />
structures and natural material cycles.<br />
• Special attention to transboundary air pollutants is given<br />
in the Protocol on Mountain Forests (Art. 2a). The reduction<br />
of the input of substances from the atmosphere will<br />
prevent forest damages.<br />
The Alpine Convention objectives comply with the agreed<br />
objectives of the European legal framework, but are not as<br />
detailed.<br />
With respect to incidences where present and future European<br />
limit and target values for NO 2<br />
, NOx, PM10 and ozone<br />
are severely exeeded in parts of the Alpine region, further it<br />
has to be stated that measures will be necessary to fulfil the<br />
objectives of the Alpine Convention.<br />
E1.4.3 Effects on noise<br />
Noise – traffic noise in particular – has a serious impact on<br />
human health. It may cause – as described at the beginning<br />
of this chapter – several diseases and also has psychological<br />
effects (e.g. loss of concentration, nervousness, bad mood<br />
etc.). Besides this it also influences social life by disturbing<br />
communication and even social behaviour, e.g. reduced<br />
helpfulness. The social structure of residential areas is also<br />
affected by (traffic) noise, because residential areas which<br />
are known as quiet are more expensive than areas close to<br />
main traffic roads, airports or railways. There is less social<br />
life and fewer social interactions in noisy neighbourhoods<br />
than in quiet ones.<br />
But (traffic) noise also has economic effects such as costs for<br />
health impairments and costs due to noise-induced losses of<br />
work efficiency. Further noise means a decline in value for<br />
real estate and houses and finally costs of noise abatement<br />
measures cause high additional expenditure.<br />
The environmental effects of noise cause a loss of quality of<br />
quiet recreation areas and remote landscapes. The effects<br />
on fauna, and on birds in particular, are reported in scientific<br />
studies, but are not much considered as serious effects in<br />
transport planning.<br />
Noise emission and noise propagation in mountainous regions<br />
is remarkably different from in lowland areas. This not<br />
generally known fact highlights the importance of this topic<br />
for the <strong>Alps</strong>. Therefore joint efforts by all member states are<br />
required to change the recent direction of ever-increasing<br />
traffic noise.<br />
The relevant AC objectives of the Traffic protocol demand<br />
that measures are enforced for noise abatement (Art. 3d)<br />
and to reduce step by step the noise emissions of all transport<br />
systems [Art. 7, (2)].<br />
Measures for noise abatement have been taken up in the<br />
member states at strategic and project level, however an<br />
evaluation for the AC area is not feasible due to limited data<br />
availability. An achievement of step-wise reduction of noise<br />
emissions cannot be proved, as comparison of noise levels<br />
at the Alpine space is not feasible at the moment. But an increase<br />
in noise emission must be regarded as evident due to<br />
remarkable rise in traffic flows and the extension of transport<br />
infrastructures.<br />
E1.5 Synthesis<br />
Observation at expert level have identified different drivers<br />
which trigger the development of traffic which then causes<br />
desired and undesired effects.<br />
• The main drivers identified in this report are the growth<br />
and the ageing of population, economic growth, and land<br />
use change with spatial development.<br />
• Traffic will react to the drivers by modal shifts, technological<br />
developments and further infrastructure development.<br />
• The effects of transport are expected to be felt on transport<br />
itself by congestion, prolongation of travel times<br />
and external costs. But it will also cause environmental<br />
changes, have economic effects and influence quality of<br />
life, in positive and negative ways.<br />
For the future a further increase in transport as well as an<br />
increase of some of its drivers (e.g. tourism), is predicted.<br />
Without a substantial change in transport policies, negative<br />
effects will be severe, sometimes triggering self-amplifying<br />
cause-effect relations (such as the concentration of population<br />
and infrastructure).<br />
Coming back to the model of drivers and transport underlying<br />
this report, it might give some indications where solutions<br />
can be found to maintain or even improve mobility. The question<br />
arises of how a decoupling can be identified systematically<br />
between these drivers and traffic as well as between<br />
traffic and its adverse effects.<br />
• Dealing with the interrelation of drivers and transport<br />
some important strategies will lie in the decoupling of<br />
economic growth from traffic growth in particular through<br />
a fair pricing system internalising external costs, but also<br />
through incentives to support modal shift and the correction<br />
of existing subsidies which contradict the objectives<br />
for the Alpine area. The link between population development,<br />
land-use changes and transport requires serious<br />
recognition in the spatial development of regions and<br />
municipalities.<br />
• The avoidance of adverse transport effects can take<br />
place at the level of infrastructures and of technology:<br />
Technological improvement of vehicles (cars, trucks,<br />
trains, etc.) can reduce emissions of air pollutants and<br />
noise, may further improve safety for passengers and<br />
might offer better intermodal transport possibilities. Infrastructures<br />
as well can be improved in terms of land<br />
take, fragmentation effects, noise abatement or upgrade<br />
of transport effectiveness.<br />
134
Chapter E – Main Conclusions for the <strong>Alps</strong><br />
Also at European level, and from an integrated consideration<br />
of transport the call exists to define strategies for a traffic<br />
turnaround, traffic abatement, modal shift and technical<br />
optimisation. For this objectives are needed in terms of traffic<br />
safety, air pollution, noise, life quality, nature and landscape<br />
conservation, and climate change. This may be conceptualised<br />
at project level through an Economic Impact Report, for<br />
identification of winners and losers of transport development,<br />
or by a Health Impact Report for stronger consideration of<br />
the effects of transport on health (SACTRA 1999, SRU2005,<br />
PEP 2004).<br />
The long-term measures and trans-European policies promoted<br />
at the EU level should be coupled with economic<br />
policies developed at national and lower levels in the Alpine<br />
area. These additional measures should aim to improve regional<br />
development, either building or strengthening existing<br />
networks to ensure better connections to the main infrastructures<br />
crossing the Alpine space. The appropriate level of policies<br />
to provide possible solutions will be elaborated in more<br />
depth in the chapter E2.<br />
It is most probable that there will not be one big and simple<br />
solution. But maybe small changes at the different levels of<br />
drivers and cause-effect chains will offer efficient solutions<br />
which in their combination will mean progress towards the<br />
objectives of the Alpine Convention.<br />
2000. Arbeitsbericht Verkehrs- und Raumplanung, 310, IVT,<br />
ETH Zürich, Zürich.<br />
Hyman, M. (2005): The impact of accessibility to the road network<br />
on the economy of peripheral regions of the EU.<br />
INFRAS/IWW (2004): External Costs of Transport. Update<br />
study, final report. Zurich, Karlsruhe.<br />
OECD (2000): EST environmentally sustainable transport.<br />
Guidelines for environmentally sustainable transport (EST).<br />
Proceedings of the international conference, 4.-6. October<br />
2000, Vienna.<br />
OECD (2001): Transport and economic development. Report<br />
on the hundred and ninth round table on transport economies.<br />
European Conference of Ministers of Transport.<br />
PEP (2004): Transport-related Health Effects with a Particular<br />
Focus on Children. Synthesis report. 2004. Austrian Federal<br />
Ministry of Agriculture, Forestry, Environment and Water<br />
Management (BMLFUW), Vienna.<br />
SACTRA (1999): Transport and the economy: Summary report<br />
by the Standing Adivsory Committee on Trunk Road Assessment<br />
(SACTRA). http: //www.dft.gov.uk/stellent/groups/<br />
dft_econappr/documents/divisionhomepage/031568.hcsp<br />
(accessed: 12. August 2006).<br />
SRU – Sachverständigenrat für Umweltfragen (2005):<br />
Umwelt und Straßenverkehr. Hohe Mobilität – Umweltverträglicher<br />
Verkehr. Eckpunkte des Sondergutachtens. Berlin.<br />
Bibliography<br />
ALPENCORS (2005): Guidelines for an efficient policy of<br />
Corridor V – Alpencors the core of Corridor V.<br />
BMVIT - Bundesministerium für Verkehr, Innovation und Technologie,<br />
HERRY Consult (2006): Alpenquerender Güterverkehr<br />
in Österreich. Wien.<br />
Dematteis, G., Governa, F. (2002): Grandi infrastrutture e sistemi<br />
locali. Il valore aggiunto territoriale delle infrastrutture di<br />
trasporto. Franco Angeli, Milano.<br />
DETR – Department of the Environment, Transport and the<br />
Regions (1999): Transport and the economy. The Standing<br />
Advisory Commitee on Trunk Road Assessment.<br />
EEA – European Environment Agency (2001): Road freight<br />
transport and the environment in mountainous areas. Case<br />
studies in the Alpine region and the Pyrenees. Technical Report<br />
No. 68/2001. Copenhagen.<br />
EEA – European Environment Agency (2004): Ten key transport<br />
and environment issues for policy-makers. TERM 2004:<br />
Indicators tracking transport and environment in the European<br />
Union. Report No. 3/2004. Copenhagen.<br />
EEA – European Environment Agency (2006): Transport and<br />
environment: facing a dilemma. TERM 2005: Indicators<br />
tracking transport and environment in the European Union.<br />
Report No. 3/2006. Copenhagen.<br />
Favry, E., Arlot, M.-P., Atmanagara, J., Castiglioni, B., Cernic-Mali,<br />
B., Egli, H.-R., Golobic, M., Massarutto, A., Pfefferkorn,<br />
W., Probst, T. (2004): Regalp: Projektbeschreibung,<br />
Hauptergebnisse und Schlussfolgerungen. Wien.<br />
Fröhlich, Ph., Tschopp, M., Axhausen, K. W. (2005): Entwicklung<br />
der MIV und ÖV Erreichbarkeit in der Schweiz: 1950-<br />
135
Report on the State of the <strong>Alps</strong><br />
E2<br />
The Main Challenges for<br />
the Future<br />
This final part of the report adopts a different perspective<br />
from the previous ones: making use of all the foregoing descriptions<br />
and explanations it tries to formulate the key issues<br />
for future political action on the basis of the principles<br />
of Alpine and European policy that have been developed in<br />
the last decades.<br />
For systematically identifying the main political challenges<br />
that result from the foregoing overall analysis, this final part<br />
of the report<br />
• recalls the overall policy objectives and frame conditions<br />
any policy in this realm has to respect<br />
• goes back to the basic service functions that Alpine<br />
transport is supposed to fulfil and identifies the specific<br />
challenges from the perspective of these functions<br />
• compares these perspectives and gives examples for<br />
cross-cutting measures and policy packages<br />
• identifies and describes the big challenges for Alpine<br />
transport in the next ten years<br />
E2.1 Overall objectives and frame<br />
conditions<br />
E2.1.1 Sustainable development of the <strong>Alps</strong> –<br />
the Alpine Convention obligations<br />
In the Alpine Convention (framework treaty) the Contracting<br />
Parties commit themselves to developing an integrated<br />
policy for the conservation and protection of the <strong>Alps</strong> and the<br />
sustainable use of resources, observing<br />
• the principle of prevention,<br />
• the principle that the party responsible is liable for the<br />
damage and<br />
• the principle of cooperation.<br />
In doing so they will take into account in an equilibrated way<br />
the interests of all Alpine states, their Alpine regions and the<br />
European Community.<br />
Concerning transport, the frame convention requires measures<br />
which aim to reduce nuisances and risks caused by<br />
intra-Alpine and cross-Alpine transport to a level that is<br />
“supportable for humans, animals and plants and their living<br />
space”, “among other measures through a stronger modal<br />
shift to the rail, especially for freight, mainly through the realisation<br />
of appropriate infrastructures and market-conform<br />
incentives, without discrimination on the basis of nationality”.<br />
The provisions in the sections concerning Population and<br />
Culture, Spatial Planning, Air Quality, Soil Protection, Nature<br />
Protection and Tourism also point in this direction.<br />
The Transport protocol asks for a coordinated transport policy<br />
by the contracting parties concerning all modes of transport,<br />
aiming for “sustainable development of the living space and<br />
the economic activities of the population living in the Alpine<br />
territory”. In detailed provisions it calls for the requirements of<br />
the environment, of society and of the economy to be taken<br />
into account. It stresses the importance of the railways and<br />
bans the construction of new major roads for cross-Alpine<br />
transport. Concerning other policies it requires the transport<br />
policy objectives to be taken into account.<br />
The protocol on Spatial Planning and Sustainable Development<br />
puts the transport issue in the larger context of spatial<br />
development, equally emphasising the importance of an<br />
integrated approach, of improving public transport and – if<br />
necessary – limiting motorised road traffic.<br />
The protocol on Tourism also deals with transport issues,<br />
asking for support for measures to limit motorised transport<br />
in tourist resorts and for initiatives that boost the provision<br />
and the use of public transport for and by tourists.<br />
European interests and EU policy objectives<br />
The EU policy objectives are an important frame condition for<br />
a joint Alpine Transport Policy. The main cornerstones have<br />
been described in chapter D3.<br />
E2.1.2 The embeddedness of the <strong>Alps</strong> in the<br />
European and the global economy<br />
More generally than in the sense of the above legal frameworks,<br />
it has to be taken into account that due to national,<br />
European and global economic integration, the <strong>Alps</strong> are ever<br />
more strongly embedded in a larger context that sets limits to<br />
independent developments in the <strong>Alps</strong>.<br />
As part of the European transport system, the Alpine transport<br />
system has to fulfil a series of important functions. It<br />
provides essential connections for the European economies<br />
and more specifically for the Alpine countries. This means<br />
also that technical and organisational interoperability of the<br />
road and rail systems has to be guaranteed. Moreover, the<br />
Alpine transport system is to a large extent dependent on<br />
technology development at international level.<br />
Finally, most aspects of the Alpine economy are exposed to<br />
international competition. Hypothetical additional costs for<br />
businesses due to Alpine-specific sustainable mobility policies<br />
would have to be limited, or compensated for, by other<br />
competitive advantages such as attractive environment, better<br />
image, higher quality offers in the tourism industry, etc.<br />
E2.2 Providing services in the<br />
framework of sustainable development<br />
In order to identify the political challenges that result from the<br />
manifold and multi-layered picture that this report has drawn,<br />
it is helpful to ask the basic question: Which fundamental<br />
service functions is Alpine transport supposed to fulfil or to<br />
contribute to?<br />
Five basic service functions related to the Alpine transport<br />
system can be distinguished in this context. Two of them<br />
mainly serve interests from outside the <strong>Alps</strong>:<br />
• Ensuring freight transit and<br />
• Ensuring passenger transit.<br />
136
Chapter E – Main Conclusions for the <strong>Alps</strong><br />
Two others correspond to intrinsic interests of the Alpine<br />
population:<br />
• Ensuring access to services, goods and jobs for the Alpine<br />
population and<br />
• Ensuring access to services and goods for the Alpine<br />
economy.<br />
The last one combines external and internal interests:<br />
• Ensuring long-range accessibility and local mobility for<br />
Alpine tourism.<br />
The question is, how can these service functions be fulfilled<br />
in the framework of sustainable development, carefully taking<br />
into account the particularly sensitive Alpine environment?<br />
E2.2.1 Ensuring freight transit<br />
With increasing European integration freight transit through<br />
the <strong>Alps</strong> has become more and more important – for the<br />
whole European economy. <strong>How</strong>ever, the strong increase in<br />
the number of transiting trucks over the last decades has led<br />
to protests and intense political debates. (See chapters A1,<br />
A2, D6, E1.1.2)<br />
Points to be considered<br />
Most Alpine freight transit occurs on the road and causes<br />
more nuisance to nature, the landscape and the population<br />
of the <strong>Alps</strong> than does the equivalent freight transit on the<br />
railway.<br />
Freight transit is expected to continue to grow considerably<br />
in the next decades – however, not to the same extent on all<br />
corridors. A further increase in road freight transport meets<br />
strong opposition in the concerned corridors and the transport<br />
protocol bans new major roads for cross-Alpine transit.<br />
Decreasing noxious gaseous emissions by trucks on the big<br />
corridors due to technical progress and stricter norms do not<br />
diminish other environmental impacts or public opposition.<br />
Differences in road prices and traffic regulations between the<br />
Alpine countries as well as bottlenecks lead to considerable<br />
detours in long-range truck itineraries.<br />
The economic potential of rail connections over long distances<br />
is far from being exploited. Freight transit on the rail<br />
is growing, but more slowly than on the road (with exceptions<br />
in Switzerland). Present competitive disadvantages of<br />
the rail include:<br />
• lack of flexibility and coordination between the historical<br />
national railway companies and rail systems,<br />
• unsufficient reliability of present services,<br />
• old, steep railway lines,<br />
• lack of multimodal terminals, for example in some areas<br />
of Italy;<br />
• strongly road-based logistics systems, inter-modal<br />
switching hindered by low degree of container use<br />
• High costs of simple truck-transport systems (highway<br />
on the rail)<br />
Four new base tunnels across the <strong>Alps</strong> are being built or<br />
planned in order to considerably increase rail transit capacity<br />
in both north-south and east-west directions. Two of them<br />
are under construction in Switzerland (Lötschberg, completion<br />
2007/08; Gotthard, completion 2015/16,). Two more<br />
(Brenner, Lyon-Torino) are in the preparation phase for starting<br />
the construction of the main tunnels.<br />
Specific challenges are..<br />
• improving the rail transit infrastructure to allow for low<br />
operational costs, short travel times and high capacity<br />
on all main corridors,<br />
• adjusting road and rail pricing in such a way that<br />
» rail has a good competitive chance,<br />
» freight flows are reasonably distributed between corridors,<br />
avoiding detour traffic, and<br />
» the impact of road freight traffic remains below reasonable<br />
and jointly agreed limits,<br />
• promoting multi-modal transport by<br />
» providing appropriate terminal infrastructure and international<br />
connections,<br />
» encouraging containerisation, and<br />
» encouraging SMEs to use modern logistics systems,<br />
• curbing the transport intensity of European economies by<br />
» internalising external costs of the different modes,<br />
» using up-to-date logistics, and<br />
» reducing material flows and accelerating the shift towards<br />
service economies,<br />
• developing alternatives to Alpine transit using marine<br />
routes.<br />
E2.2.2 ensuring passenger transit<br />
Passenger transit through the <strong>Alps</strong> is essential for the European<br />
economy as well as for cultural exchange and social<br />
cohesion in Europe. Tourism traditionally makes up a large<br />
part of Alpine passenger transit. With the integration of European<br />
economies, cross-boundary and therefore cross-Alpine<br />
business travel, apart from tourism, increases in importance.<br />
Moreover, with the tertiarisation of European economies,<br />
business travel becomes even more important. The improvement<br />
of road and rail passenger connections has helped<br />
considerably to facilitate European integration (see chapters<br />
A1, A3, B4, E1.2.2).<br />
Points to be considered<br />
Most passenger transit occurs on the road and causes more<br />
nuisances than benefits to the Alpine population.<br />
Peak loads exceed capacities on road and rail.<br />
Present cross-border railway links are not well coordinated<br />
between national railway companies.<br />
Specific challenges<br />
137
Report on the State of the <strong>Alps</strong><br />
• To improve technical interoperability and coordination<br />
between rail companies and to enhance competition between<br />
international passenger train companies<br />
• To increase frequencies of public transport and improve<br />
upstream and downstream connections<br />
• To improve the rail infrastructure for higher speed and<br />
higher capacity<br />
• To improve international tariff and booking systems<br />
• To smoothen peak loads<br />
• To eliminate road bottlenecks in heavily populated areas<br />
E2.2.3 Ensuring access to services, goods<br />
and jobs for the Alpine population<br />
Ensuring and maintaining a certain degree of accessibility to<br />
services, goods and jobs is essential for living in the <strong>Alps</strong>. As<br />
well as transport, local provision of services and goods, education<br />
and labour market policies, urban planning, increased<br />
use of Information and Computing Technology (ICT) and local<br />
initiatives can all contribute to providing this access. Integrated<br />
approaches need to take into account the evolving<br />
needs of different parts of the population (see chapters B1,<br />
C2, D7, E1.3).<br />
Points to be considered<br />
Several factors have considerably improved the access of<br />
the Alpine population to services, goods and jobs over the<br />
last 50 years:<br />
• the improvement of the road infrastructure<br />
• the greatly increased ownership of private cars<br />
• the internal migration to larger settlements<br />
At the same time other factors have contributed to a sharp<br />
increase in the demand for such accessibilities:<br />
• the decline of traditional Alpine economies and ways of<br />
life along with the increasing spread of urban lifestyles<br />
• rising levels of education<br />
• increasing specialisation in the labour market<br />
• structural changes of urban functions in the EU as well<br />
as in the Alpine area<br />
For those who do not own a private car, accessibility has<br />
often decreased because of the withdrawal of local public<br />
services, the decline of local trade and the decline of public<br />
transport.<br />
In many peripheral areas decreasing population as well<br />
as ever tighter public budgets increase the pressure to cut<br />
spending on public infrastructure. The increasing risk of more<br />
frequent and stronger natural hazards and extreme weather<br />
events, as a possible consequence of climate change, affects<br />
the costs of transport infrastructure.<br />
Marked differences in the local provision of services and<br />
goods between different areas with similar population densities<br />
show that considerable improvements might be possible<br />
through policies at different levels. The potential of ICT is far<br />
from being fully exploited.<br />
In peripheral areas, improving the transport infrastructure<br />
without ensuring a sufficient level of local attractions (services,<br />
jobs etc.) has often resulted in economic and demographic<br />
decline.<br />
Public transport services differ strongly between Alpine regions.<br />
Cross-border services in particular are often neglected.<br />
Railway connections linking destinations within the <strong>Alps</strong><br />
are generally less well developed than those linking to the<br />
peri-Alpine centres.<br />
Internal migration in the <strong>Alps</strong> has partially led to extended<br />
suburbanisation. The opportunities for considerably lowering<br />
the need for individual motorised transport in this relocation<br />
process have not been fully exploited. Best practice examples<br />
show that appropriate urban planning could make a difference.<br />
Specific challenges are..<br />
• improving the local availability of public and private services,<br />
also by a greater use of ICT,<br />
• defining transparent and reliable accessibility standards<br />
for different categories of territories,<br />
• lowering the need for individual motorised transport by<br />
appropriate urban planning,<br />
• strengthening public transport in the <strong>Alps</strong> by improving<br />
» the accessibility of peripheral areas,<br />
» the mobility in agglomerations,<br />
» the local cross-border connections,<br />
» the connections between Alpine cities, and<br />
• strengthening the exchange of experiences and joint<br />
learning processes across the whole Alpine bow in order<br />
to enhance the development of appropriate new models<br />
for living in the <strong>Alps</strong>.<br />
Many of the challenges listed under “Ensuring passenger<br />
transit” are linked to challenges mentioned under E2.2.3 and<br />
could be mentioned here too.<br />
E2.2.4 Ensuring access to services and<br />
goods for the Alpine economy<br />
The accessibility needs of the Alpine economy are shifting as<br />
structural change progresses. Bulk transport of heavy goods<br />
is still important for the wood, mining and construction industries.<br />
But the increasingly important small, often high-tech<br />
industries and, even more so, the service sector have other<br />
needs: rapid and reliable transport of smaller freight and of<br />
passengers. ICT has an increasingly important role.<br />
To ensure spatial access to services, goods and the labour<br />
market for the Alpine economy remains an essential objective<br />
of Alpine policies (see chapters B2, C1, A2, D6, E1.2).<br />
Points to be considered<br />
Intra-Alpine freight transport (including transport with its<br />
source or destination in the <strong>Alps</strong>, as defined by the Transport<br />
protocol; see introduction part A), with its associated negative<br />
impacts, makes up the largest part of freight transport<br />
in the <strong>Alps</strong>.<br />
138
Chapter E – Main Conclusions for the <strong>Alps</strong><br />
The share of intra-Alpine freight transport that goes by rail<br />
varies considerably between countries and does not only<br />
depend on the industries’ freight structure: Switzerland has<br />
succeeded in maintaining a relatively strong role for rail.<br />
Since the creation of the internal market, cross-border freight<br />
and passenger transport has considerably gained in importance<br />
also for the local economy. Whereas the road network<br />
has been able to meet this demand, the rail network is lagging<br />
behind.<br />
Increasing specialisation leads to larger and increasingly<br />
cross-border labour market areas. Public passenger transport<br />
is not always keeping up with this development.<br />
Compared to other regions in Europe, the physical accessibility<br />
by road of most parts of the <strong>Alps</strong> is rather good today.<br />
Better intra-Alpine rail and bus connections along the Alpine<br />
bow could facilitate the integration of Alpine economies.<br />
Specific challenges are..<br />
• encouraging structural change towards less material-intensive<br />
industries,<br />
• improving freight connections on the railways, making<br />
use of the transit infrastructure,<br />
• encouraging and facilitating increased use of ICT as a<br />
substitute for passenger transport and reaching a wider<br />
audience and<br />
• improving public passenger transport connections on<br />
short, medium and long distances.<br />
E2.2.5 Ensuring long-range accessibility<br />
and local mobility for Alpine tourism<br />
Tourism is an important sector for the Alpine economy and<br />
the Alpine labour market. On important corridors and in large<br />
parts of the <strong>Alps</strong>, tourism accounts for a large proportion<br />
of passenger transport. Peak loads on weekends in holiday<br />
times regularly lead to congestions and severe delays<br />
for cars and trucks on the road, and to overcrowded trains.<br />
Therefore, looking for alternatives in this sector is an important<br />
issue (see chapters A3, B4, D7.2, E1.2.2).<br />
Points to be considered<br />
The overwhelming majority of tourists travel by car. This is<br />
particularly true for the summer season.<br />
Many tourist destinations are located in remote areas and<br />
are poorly connected to public transport systems.<br />
For many tourists, flexible mobility at their destination is a<br />
major reason for taking the car for the whole journey.<br />
Ever shorter duration of stay leads to increased traffic.<br />
Climate change will most likely bring some transformations in<br />
the tourism sector.<br />
The increasing number of non-European visitors usually arrives<br />
by plane. Good public transport can be an argument for<br />
attracting them.<br />
Best practice examples show that good sustainable mobility<br />
offers can be very successful.<br />
Specific challenges are..<br />
• guaranteeing easy accessibility of tourism destinations<br />
in the <strong>Alps</strong> by public transport from all European origins,<br />
• ensuring mobility of tourists at their destination in the<br />
<strong>Alps</strong> with attractive public transport,<br />
• developing offers, incentives and information systems<br />
for effectively promoting sustainable mobility, and<br />
• levelling out peak traffic loads by staggering holidays in<br />
Europe and promoting appropriate offers in Alpine tourism.<br />
E2.3 The need for integrated<br />
approaches<br />
Looking at these challenges altogether, and formulating specific<br />
measures and programmes to meet them, two main observations<br />
emerge:<br />
• The challenges emerging from the individual perspectives<br />
are in most cases complementary. Measures and<br />
programmes aiming at one service function would mostly<br />
have positive effects on the others.<br />
• Physical transport is not the only solution for providing<br />
these services. Therefore, transport policy is not the only<br />
policy addressed by these challenges; other policies can<br />
and have to contribute. They are essential for reducing<br />
or containing the negative impacts of the transport system.<br />
Considering transport issues from the perspective of sustainable<br />
development leads to asking for more integrated<br />
approaches compared to traditional transport policy. Integrating<br />
different territory-related policies at different levels<br />
becomes essential for success.<br />
139
Report on the State of the <strong>Alps</strong><br />
Three examples of measures may illustrate this:<br />
• Investing in rail infrastructure and improving the international<br />
interoperability of railways will help to facilitate<br />
freight and passenger transit through the <strong>Alps</strong> and will<br />
reduce the traffic load on the road transit corridors.<br />
• Enhancing access to broadband connections and improving<br />
people’s ability to use the Internet will facilitate<br />
access to services both for individuals and for companies<br />
in remote areas.<br />
• Urban planning, providing basic services within walking<br />
distance and allowing for easy access to public transport<br />
for large parts of the population would reduce the need to<br />
use private car and boost the local economy.<br />
There are no single answers to these challenges. The variety<br />
of approaches that have been adopted in the Alpine countries<br />
and regions show that different combinations of measures<br />
are possible. <strong>How</strong>ever, they also show that efforts and<br />
success vary largely and there is a huge potential for mutual<br />
learning through cooperation and exchange.<br />
In order to develop satisfactory and economically viable solutions,<br />
appropriate policy packages combining different kinds<br />
of users, investments and regulations, incentives and educational<br />
efforts are needed. Simple restrictive measures in one<br />
territory may cause problems in neighbouring ones.<br />
Horizontal and vertical cooperation in a system of multi-level<br />
international governance thus becomes essential for tackling<br />
the transport problems in the <strong>Alps</strong>. An important task for the<br />
Alpine Convention will be to help develop appropriate instruments<br />
and cooperation networks.<br />
E2.4 Towards a common Alpine<br />
transport policy for the next<br />
ten years<br />
Combined policy approaches for reconciling seemingly<br />
contradictory demands<br />
Alpine transport policy has to conciliate:<br />
• the requests for accessibility at various scales and in<br />
various fields, such as long-range freight, intra-Alpine<br />
freight, tourist attractiveness, everyday life….<br />
• the difficulty of mobilising funds for very large public infrastructure<br />
investments<br />
• and the need to take into consideration the specific Alpine<br />
environment, the need to reduce all kinds of negative<br />
impacts of transport.<br />
Different approaches will have to contribute to the solution<br />
of this problem:<br />
• the promotion of less harmful modes of transport for passengers<br />
and goods<br />
• the reduction of the structural needs for transport –<br />
fulfilling the requested services in another way<br />
• the more efficient organisation of transport<br />
A series of obstacles<br />
Policies for sustainable transport and mobility in the <strong>Alps</strong> will<br />
have to propose innovative solutions for overcoming difficult<br />
obstacles. Some examples:<br />
• the need to update the Alpine railway system in a difficult<br />
topographical context is leading to build four new tunnels<br />
and some new railway lines,<br />
• the cost of such big investments, which requires the organisation<br />
of specific and considerable funding, using<br />
innovative methods such as PPP (Public Private Partnership),<br />
RPLP (Capacity-linked levy on heavy goods<br />
vehicles) at the very moment when there is high pressure<br />
on public finances and limited European funds,<br />
• the large variety of national situations and interests, especially<br />
concerning freight transport:<br />
» high road traffic growth rates on some corridors (Brenner,<br />
Ventimiglia) in particular,<br />
» low share of the rail traffic on the corridors Austria/Italy<br />
and France/Italy, compared to a much higher share in<br />
Switzerland, and<br />
» some Alpine countries directly linked to big European<br />
axes, others in a more peripheral situation;<br />
• the objective difference between a country like Italy, for<br />
whom passing through the <strong>Alps</strong> is strategic, and countries<br />
like Austria or Switzerland, confronted with an important<br />
transit flow.<br />
The five main challenges<br />
For the next ten or fifteen years, Alpine countries will have to<br />
face the following five main challenges:<br />
• To develop a coherent inter-modal policy aiming at<br />
reducing road freight traffic. It will have to include the<br />
implementation of big new rail infrastructures as well as<br />
pricing and regulation measures taking account of environmental<br />
and other external costs.<br />
• To ensure the safety of transport in the <strong>Alps</strong>, for each<br />
mode, both for the infrastructures and the services.<br />
• To improve public passenger transport across and<br />
within the <strong>Alps</strong>. Inter-City connections, urban transport,<br />
cross-border links, access to rural areas – all are necessary<br />
for reducing congestion and pollution while ensuring<br />
a high level of personal mobility. Best practice examples<br />
show how high levels can be attained.<br />
• To promote sustainable mobility in the Alpine Area,<br />
with specific policies for tourism mobility. Best practice<br />
examples show the considerable potential for business<br />
and for the quality of life of the local populations, for<br />
example through cooperation between public transport<br />
companies, local authorities and tourism operators.<br />
• To develop integrated spatial planning policies, considering<br />
the strategic objective of reducing the structural<br />
needs of transport. They will have to enhance the<br />
local provision of services and goods by various means.<br />
Better coordination of settlement patterns and infrastructures<br />
should also facilitate the accessibility and the efficiency<br />
of public transport.<br />
140
Chapter E – Main Conclusions for the <strong>Alps</strong><br />
Cooperation is essential for success<br />
These challenges invite Alpine countries to develop specific<br />
and concrete cooperation, both between themselves and<br />
with the European Union:<br />
• No real progress will be made without a general agreement<br />
between Alpine countries on concrete actions concerning<br />
these issues on the scale of the whole Alpine<br />
space.<br />
• Important measures of an Alpine transport policy will<br />
have to use European policy instruments – such as the<br />
Eurovignette – and to take account of European principles<br />
– such as the principle of free circulation and the<br />
protection of the environment.<br />
• An Alpine transport policy has to be linked to the European<br />
policy framework aiming at interoperability for<br />
increasing the capacity, quality and reliability of the rail<br />
system.<br />
• Because of the inter-relation between the different Alpine<br />
corridors any regulation policy in one place has an impact<br />
on others. This is an important issue to be considered<br />
when discussing proposals such as tradable transit<br />
certificates.<br />
• Cooperation needs commitment: in view of the stepby-step<br />
completion of the four new base tunnels between<br />
2007 and 2020, a precise calendar for the<br />
implementation of an overall Alpine freight transport<br />
regime is very important. The Swiss constitution<br />
requires reducing truck transit by 50% two years after<br />
the completion of the new Lötschberg connection – only<br />
some few years ahead. In order to adapt their planning,<br />
transport operators need to know coming restrictions<br />
precisely and well in advance.<br />
141
Report on the State of the <strong>Alps</strong><br />
Annex A2<br />
Country Mode 1994 1999 2004<br />
France<br />
Austria<br />
Total<br />
Total 44.6 49.0 48.7<br />
Rail 8.6 9.4 6.8<br />
Road 36.0 39.6 41.9<br />
Total 24.1 26.8 34.9<br />
Rail 17.9 18.4 22.4<br />
Road 6.2 8.4 12.5<br />
Total 63.7 85.9 108.1<br />
Rail 24.0 27.8 33.4<br />
Road 39.7 58.1 74.7<br />
Total 132.4 161.7 191.7<br />
Rail 50.5 55.6 62.6<br />
Road 81.9 106.1 129.1<br />
Annex A2-1: Modal split of freight transport of selected Alpine countries<br />
in Mio tonnes per year (Source: CAFT 2004 Survey).<br />
Country Alpine Crossing Mode<br />
France<br />
Austria<br />
Year<br />
1994 1999 2004<br />
Rail 1.0 1.0 0.5<br />
Ventimiglia<br />
Road 9.4 12.9 18.1<br />
Montgenèvre Road 1.6 0.4<br />
Fréjus Road 12.2 22.8 16.8<br />
Mt. Cenis Rail 7.6 8.4 6.3<br />
Mt. Blanc Road 14.3 2.9 5.2<br />
Gran San Bernardo Road 0.4 0.4 0.6<br />
Rail 4.7 3.5 6.8<br />
Simplon<br />
Road 0.1 0.2 0.7<br />
Rail 13.2 14.9 15.6<br />
San Gottardo<br />
Road 5.1 7.0 9.9<br />
San Bernardino Road 0.6 0.8 1.3<br />
Reschen Road 0.8 1.2 2.0<br />
Rail 8.3 8.2 10.2<br />
Brennero<br />
Road 17.6 25.2 31.5<br />
Rail 5.3 5.6 8.0<br />
Tauern<br />
Road 4.7 8.2 12.2<br />
Rail 4.0 4.6 5.4<br />
Schoberpass<br />
Road 6.9 11.2 14.6<br />
Rail 6.1 9.3 9.6<br />
Semmering<br />
Road 3.7 4.0 5.6<br />
Rail 0.4 0.1 0.2<br />
Wechsel<br />
Road 6.0 8.2 8.8<br />
Annex A2-2: Road and rail transport volumes on Alpine crossings in<br />
Mio tonnes (Source: CAFT 2004 Survey).<br />
Country<br />
France<br />
Switzerland<br />
Switzerland<br />
Switzerland<br />
Alpine<br />
crossing<br />
Road<br />
(Mio t)<br />
Rail<br />
(Mio t)<br />
Modal split<br />
road/rail<br />
(in %)<br />
Total<br />
(Mio t)<br />
Ventimiglia 11.6 100/0 11.6<br />
Modane 1.1 0/100 1.1<br />
Fréjus 4 100/0 4<br />
Mt. Blanc 1.8 100/0 1.8<br />
Simplon 0.3 6.2 5/95 6.5<br />
Gran San<br />
Bernardo<br />
0.3 100/0 0.3<br />
San Bernardino 0.8 100/0 0.8<br />
San Gottardo 6.2 13.5 31/69 19.7<br />
Brennero 27.9 9.4 75/25 37.3<br />
Austria<br />
Tauern 7.2 100/0 7.2<br />
Annex A2-3: Road and rail crossing transit traffic in 2004 in Mio tonnes<br />
(Source: Alpinfo 2004).<br />
Alpine crossing<br />
Country<br />
Share of Alpinecrossing<br />
traffic<br />
Ventimiglia France-Italy 13%<br />
Fréjus / Mt. Cenis France-Italy 11%<br />
Mt. Blanc France-Italy 3%<br />
Gran San Bernardo Italy-Switzerland 1%<br />
Simplon Italy-Switzerland 1%<br />
Gotthard Italy-Switzerland 9%<br />
San Bernardino Switzerland 1%<br />
Reschen Austria-Italy 1%<br />
Brennero Austria-Italy 19%<br />
Tauern Austria 13%<br />
Schoberpass Austria 12%<br />
Semmering Austria 5%<br />
Wechsel Germany 9%<br />
Total 98%<br />
Annex A2-4: Share of Alpine crossings in total cross-Alpine freight traffic<br />
on roads in 2004 (Sources: CAFT 2004 Survey).<br />
Route<br />
E52<br />
München-Bad<br />
Reichenhall<br />
E45<br />
Brenner road<br />
axis Innsbruck-<br />
Bolzano<br />
E70<br />
Chambéry-Lyon<br />
E43<br />
Lainate-Como-<br />
Chiasso<br />
Daily flow<br />
of HDV<br />
7,000–<br />
9,000<br />
Freight rate<br />
(in %)<br />
Freight rate<br />
increase (in %)<br />
1995 – 2005<br />
15–18 25–27<br />
11,000 28–32 35<br />
5,500 16 28<br />
12,500 18 22<br />
E55<br />
Pesnica-Maribor<br />
5,000 12 35<br />
Annex A2-5: Freight traffic flows on main Alpine motorways.<br />
143
Report on the State of the <strong>Alps</strong><br />
NUTS-2 region<br />
Vehicle movements<br />
with origin in<br />
NUTS-2 region<br />
(Number of vehicle<br />
movements 2004)<br />
Vehicle movements<br />
with destination<br />
in NUTS-2 region<br />
(Number of vehicle<br />
movements 2004)<br />
Steiermark 854,000 926,000<br />
Lombardia 851,000 925,000<br />
Veneto 450,000 396,000<br />
Piemonte 433,000 417,000<br />
Niederösterreich 379,000 350,000<br />
Oberösterreich 269,000 249,000<br />
Kärnten 236,000 221,000<br />
Provence-Alpes-Côte<br />
d‘Azur<br />
220,000 188,000<br />
Wien 211,000 192,000<br />
Rhône-Alpes 204,000 210,000<br />
Tirol 204,000 190,000<br />
Oberbayern 190,000 175,000<br />
Slovenia 187,000 177,000<br />
Salzburg 164,000 165,000<br />
Province of Bolzano/<br />
Bozen<br />
151,000 161,000<br />
Other NUTS-2<br />
regions that at least<br />
partly overlap with<br />
930,593 923,076<br />
AC area<br />
NUTS-2 regions that<br />
do not overlap with 4,264,392 4,311,930<br />
AC area<br />
Annex A2-6: Alpine NUTS-2 regions as origin and destination of traffic.<br />
NUTS-2<br />
regions<br />
generating<br />
traffic<br />
Steiermark<br />
Lombardia<br />
Veneto<br />
NUTS-2 destinations of<br />
traffic<br />
Vehicle movements<br />
in 2004<br />
Niederösterreich 199,000<br />
Steiermark 132,000<br />
Oberösterreich 115,000<br />
Salzburg 35,000<br />
Other Alpine Regions 88,000<br />
Non-Alpine Regions 285,000<br />
TOTAL 854,000<br />
Rhone-Alpes 52,000<br />
Provence-Alpes-Côte d‘Azur 36,000<br />
Oberbayern 27,000<br />
Zürich 14,000<br />
Other Alpine Regions 97,000<br />
Non-Alpine Regions 625,000<br />
TOTAL 851,000<br />
Oberbayern 22,000<br />
Rhone-Alpes 17,000<br />
Provence-Alpes-Côte d‘Azur 11,000<br />
Tirol 10,000<br />
Other Alpine Regions 54,000<br />
Non-Alpine Regions 336,000<br />
TOTAL 450,000<br />
Rhone-Alpes 61,000<br />
Provence-Alpes-Côte d‘Azur 28,000<br />
Piemonte<br />
Region Lemanique 8,000<br />
Espace Mittelland 6,000<br />
Other Alpine Regions 27,000<br />
Non-Alpine Regions 303,000<br />
TOTAL 433,000<br />
Steiermark 201,000<br />
Niederösterreich<br />
Kärnten 37,000<br />
Burgenland 31,000<br />
Niederösterreich 24,000<br />
Other Alpine Regions 57,000<br />
Non-Alpine Regions 29,000<br />
TOTAL 379,000<br />
Annex A2-7: NUTS-2 regions with highest volumes of generated traffic<br />
(CAFT 2004).<br />
144
Report on the State of the <strong>Alps</strong><br />
Origin<br />
intermodal<br />
platform<br />
Country<br />
of origin<br />
Destination<br />
Destination<br />
country<br />
Aarau CH Graz – Wien AT<br />
Basel CH Graz – Linz AT<br />
Brescia IT München DE<br />
Busto Arsizio IT Frankfurt DE<br />
Chiasso CH Singen DE<br />
Genova IT Zürich CH<br />
Graz<br />
AT<br />
Basel<br />
Koper<br />
CH<br />
SLO<br />
Hall in Tirol AT Verona IT<br />
Koper<br />
SLO<br />
Graz – Linz – Salzburg<br />
– Wien<br />
La Spezia IT Zürich CH<br />
Linz<br />
Ljubljana<br />
AT<br />
SLO<br />
Zürich – Basel<br />
Koper – Ljubljana<br />
München<br />
Wien<br />
AT<br />
CH<br />
SLO<br />
DE<br />
AT<br />
Milano<br />
Certosa<br />
IT Singen DE<br />
Munich-Riem DE Verona IT<br />
Salzburg AT Ljubljana – Koper SLO<br />
Singen DE Milano IT<br />
Trento IT Nürnberg DE<br />
Verona<br />
Villach<br />
Wien<br />
IT<br />
AT<br />
AT<br />
München<br />
Nürnberg<br />
Koper – Ljubljana<br />
Trieste – Verona<br />
Koper – Ljubljana<br />
Verona<br />
DE<br />
SLO<br />
IT<br />
SLO<br />
IT<br />
Genova<br />
Zürich<br />
CH<br />
IT<br />
La Spezia<br />
Annex A2-8: Rail transport O/D-pairs with highest volumes (Source: ISTAT<br />
Railflows 2004)<br />
Origin<br />
Destination<br />
Number of vehicle<br />
movements<br />
Lombardia Germany 1,840,000<br />
Lombardia France 770,000<br />
Emilia Romagna Germany 637,000<br />
Lombardia Switzerland 604,000<br />
Friuli V,G Austria 470,000<br />
Piemonte Germany 305,000<br />
Friuli V,G Switzerland 290,000<br />
Lombardia Austria 278,000<br />
Piemonte France 204,000<br />
Friuli V,G Germany 120,000<br />
Trentino A,A Austria 104,000<br />
Annex A2-9: Number of vehicle movements between Italian NUTS-2<br />
regions and Alpine countries in 2004.<br />
Case study: Freight traffic crossing the Slovenian-<br />
Italian border<br />
In 2004, the total freight traffic regarding main Slovenian<br />
border-crossings towards the Alpine Convention area<br />
amounted to about 36.5 Mio tonnes per year.<br />
N.Gorica /<br />
Gorizia *<br />
Fernetiči /<br />
Fernetti *<br />
Šentilj /<br />
Spielfeld*<br />
Karavanke<br />
/ Karawanken<br />
Rail<br />
(Mio t)<br />
Road<br />
(Mio t)<br />
Road<br />
(number of<br />
trucks)<br />
totAL<br />
(Mio t)<br />
Share of<br />
road<br />
0.1 9.1 580,000 9.2 99%<br />
1.2 8.6 550,000 9.8 88%<br />
4.7 5.6 358,000 10.3 54%<br />
3.5 3.7 237,000 7.2 51%<br />
TOTAL 9.5 27.0 1,725,000 36.5 72%<br />
Annex A2-10: Freight traffic on Slovenian Alpine border crossings.<br />
(* Not within the Alpine Convention Area.)<br />
On the border between Italy and Slovenia the number<br />
of trucks has been increasing rapidly over the last few<br />
years. From 2000 to 2004 it rose from around 700,000 to<br />
over 1.1 Mio which constitutes an increase of 59.7%. In<br />
the period from 1995 to 2003 the share was higher for the<br />
Nova Gorica/Gorizia border-crossing.<br />
The increasing traffic through the border-crossings of<br />
Fernetiči/Fernetti and Nova Gorica/Gorizia derives from<br />
two main factors:<br />
• it is the road connection from Italy to growing markets<br />
in Central and Eastern Europe,<br />
• it is an alternative to the Tarvisio corridor.<br />
After the EU enlargement to 25 Member States in 2004,<br />
an extremely sharp increase of freight traffic was observed<br />
along the route of Corridor V across Slovenia.<br />
Some of this increase is already noticeable in the data<br />
for the Fernetiči/Fernetti and Nova Gorica/Gorizia bordercrossings<br />
for the year 2004.<br />
Regarding the modal split, it is interesting that the share<br />
of rail transport is much lower on the border between<br />
Slovenia and Italy than between Slovenia and Austria.<br />
While the share of rail traffic going to Italy is only around<br />
7%, towards Austria it is around 47%. One of the reasons<br />
for such a difference derives from the different structure<br />
of freight; a considerable share of freight going to Austria<br />
is dry bulk cargo.<br />
With respect to the mountain passes in Slovenia it is also<br />
interesting to consider the data for the Postojna pass,<br />
being just outside of the Alpine Convention area, defining<br />
the eastern sub-Alpine passage similarly to Ventimiglia<br />
on the western side. The total volume of traffic in 2004<br />
was over 30 Mio tonnes, 9.8 million of which was on rail<br />
(32%) and around 21 million on road (68%).<br />
Source: Ministry of Transport of the Republic of Slovenia<br />
145
Report on the State of the <strong>Alps</strong><br />
Annex B3<br />
Country Content Level<br />
National data source,<br />
method<br />
Years<br />
Provider and<br />
original data owner<br />
AT<br />
Cultivated area, forests, settlement<br />
and traffic infrastructure, area of<br />
permanent settlement<br />
LAU-2<br />
Regionalinformation des<br />
BEV, aggregated from<br />
cadastral data<br />
2001, 2006<br />
AC<br />
Umweltbundesamt,<br />
(based on BEV data)<br />
CH<br />
Cultivated area, forests, settlement<br />
and traffic infrastructure, area of<br />
permanent settlement<br />
LAU-2<br />
Area statistics:<br />
Every 4 years, 17 land use<br />
categories, survey among<br />
municipalities<br />
1979-85, 1992-97<br />
AC<br />
BFS<br />
DE<br />
Cultivated area, forests, settlement<br />
and traffic infrastructure, area of<br />
permanent settlement<br />
LAU-2<br />
Area statistics: Every 4<br />
years, 17 land use<br />
categories, survey among<br />
all municipalities<br />
2000, 2004<br />
AC<br />
LfstaD<br />
LI<br />
Cultivated area, forests, settlement<br />
and traffic infrastructure, area of<br />
permanent settlement<br />
Countrylevel<br />
Area statistics,<br />
aerial photo with one<br />
sample point / ha<br />
1996, 2002<br />
AC<br />
Amt für Wald, Natur<br />
und Landschaft,<br />
Vaduz<br />
FR<br />
Forests, settlement and traffic<br />
infrastructure<br />
LAU-2 CLC 1990, 2000<br />
AC<br />
IFEN<br />
FR Cultivated area NUTS-3 annual statistics 1993, 2003<br />
AC<br />
Ministere Agriculture<br />
(SCEES)<br />
IT<br />
Cultivated area, forests;<br />
no settlement data<br />
NUTS-3<br />
method unknown, forest<br />
nomenclature only in Italian,<br />
Forest (Pioppeti and<br />
Boschi)<br />
1990, 2000<br />
AC<br />
APAT, ISTAT<br />
SL<br />
Cultivated area, forests, settlement<br />
and traffic infrastructure, area of<br />
permanent settlement<br />
NUTS-3<br />
Interpretation of Satellite<br />
Data (LANDSAT) and<br />
auxiliary data<br />
Cultivated area<br />
only 2001<br />
1997, 2001<br />
AC<br />
Statistical Office<br />
of the Republic of<br />
Slovenia<br />
Annex B3-1: Data sources and basic method by nation.<br />
Metadata have not been provided sufficiently in all cases.<br />
146
Report on the State of the <strong>Alps</strong><br />
Calculation of land-use transformation matrices<br />
Because land use is a phenomenon based on location, in<br />
any case of change we can always talk about transformations<br />
of land use. Any site of analysis can change its land<br />
use from type 1 to type 2. The changes in a larger defined<br />
area can be displayed within a cross table, which shows<br />
in rows the area of the different land-use classes at time<br />
1, compared to the columns with the area of the different<br />
land-use classes at time 2. The cells of the table indicate<br />
the amount of area with land-use change from land use<br />
“x” at time 1 to “y” at time 2 or “a” at time 1 to “y” at time 2,<br />
respectively, within the given area.<br />
Time 1<br />
Forest<br />
Time 2<br />
Agriculture<br />
Settlement<br />
Sum<br />
time 1<br />
Forest 35 10 5 50<br />
Agriculture 5 15 10 30<br />
Settlement 5 15 20<br />
the valid one, the higher sum is accounted to an “unknown”<br />
class.<br />
If the sum of the total area differs remarkably between<br />
the years, a substantial change in the method of land-use<br />
assessment is assumed. In this case either the methodological<br />
differences can be resolved or the case has to be<br />
excluded from analysis.<br />
If no transfer between land-use classes is detectable, i.e.<br />
all three classes gain or all of them lose area, the changes<br />
are assumed to be due to the changes in an unknown<br />
additional class. No change of land use is reported in this<br />
case for the three “known” classes.<br />
These rules result in corrected tables of land-use class<br />
area, which are equal in total for both years. On this basis<br />
the main land-use flows are calculated per LAU2-unit,<br />
and aggregated per region, so that one matrix-table displays<br />
the land-use transformation for one region (maybe<br />
also for the whole nation).<br />
Sum time 2 40 30 30<br />
In this imaginary example one can see how many areas<br />
of new settlement have come from forest (5 units),<br />
and how many have come from agriculture (10 units). In<br />
this example one can also see that 5 units of agriculture<br />
changed to forest, whereas 10 units of forest are under<br />
agricultural use at time 2. Another 5 units went from settlement<br />
to agriculture, which is quite unrealistic, but good<br />
enough for this example.<br />
For the actual case the statistical changes are collected<br />
for the smallest available land units (LAU-2), and these<br />
are treated as the sample points. Thus the land-use transformation<br />
is depicted for each of these units, and then the<br />
transformation values are aggregated to a higher level.<br />
This procedure sharpens the image of land-use change,<br />
because on every aggregation level it is still possible to<br />
report the share of transformation from each land-use<br />
class to each other class. For sake of generalisation of<br />
inherent errors, this method requires at least one aggregation<br />
level between the sample level and the flow analysis.<br />
For example, if the base data have a resolution of<br />
LAU-2, then the flows should not be depicted finer than<br />
NUTS-2 level.<br />
For each municipality (LAU-2 Level) the status of two time<br />
steps is collected. This is still the statistical representation,<br />
but in high resolution compared to the result level<br />
(NUTS-2). Using certain assumptions and rules, the flows<br />
of land use can be inferred from those data:<br />
One single “winner type” compensates all losses of the<br />
others; differences are adjusted so that the lower sum<br />
is the valid one, the higher sum is accounted to an “unknown”<br />
class.<br />
One single “loser type” provides the gains of all others;<br />
again differences are adjusted so that the lower sum is<br />
147
Report on the State of the <strong>Alps</strong><br />
Annex D7<br />
European Expert Conference “Environmentally Friendly<br />
Travelling in Europe” – Final Document<br />
The European Expert Conference, “Environmentally Friendly<br />
Travelling in Europe – Challenges and Innovations Facing<br />
Environment, Transport and Tourism“, took place on 30 and<br />
31 January 2006 in Vienna, mounted by the Federal Ministry<br />
of Agriculture, Forestry, Environment and Water Management,<br />
the Federal Ministry for Transport, Innovation<br />
and Technology and the Federal Ministry of Economics and<br />
Labour within the framework of the Austrian EU-Presidency<br />
and the Austrian Presidency of the Alpine Convention.<br />
The conference focused on good practice examples of soft<br />
mobility measures in the fields of environment, transport<br />
and tourism, including the EU projects, <strong>Alps</strong> Mobility II –<br />
Alpine Pearls, Alpine Awareness, mobilAlp, and Environmentally<br />
Sustainable Transport and Tourism in Sensitive Areas<br />
–Lake Neusiedl/Fertö-tó Region. As demonstrated by the<br />
award-winning projects in the European Contest held in conjunction<br />
with the conference a number of local and regional<br />
entrepreneurial initiatives are already under way in Europe;<br />
the range extends from trans-sectoral traffic calming measures,<br />
the improvement of travel to and mobility in the holiday<br />
region by public transport, to the use of innovative transport<br />
technologies, awareness raising and mobility management.<br />
The recommendations derived from the above-mentioned<br />
projects, the contest and the results of the conference need<br />
to be seen against the backdrop of the following political objectives<br />
in Europe:<br />
• The March 2000 EU Lisbon Strategy of the European<br />
Council, targeting employment, economic reform and<br />
social cohesion;<br />
• the “European Sustainable Development Strategy” (EU-<br />
SDS), June 2001;<br />
• the “Kyoto-Protocol”, which came into force in February<br />
2005;<br />
• the Transport White Paper “European Transport Policy<br />
for 2010: Time to decide” of the European Commission,<br />
September 2001;<br />
• the Communication of the European Commission, “Basic<br />
orientations for the sustainability of European tourism”,<br />
November 2003;<br />
• the 6 th Environment Action Programme of the European<br />
Union<br />
• the technology platforms ERRAC (European Rail Research<br />
Advisory Council) and ERTRAC (European Road<br />
Transport Research Advisory Council) set up at the initiative<br />
of the European Commission, 2001 and 2002;<br />
• the Alpine Convention and its protocols.<br />
Recommendations issued by the European Expert<br />
Conference<br />
The principles of sustainable mobility and sustainable<br />
tourism need to be integrated into as many tourism products<br />
as possible, taking account of all the three pillars of sustainability,<br />
i.e. economy, ecology and social aspects. In the implementation<br />
of the following proposals, close cooperation between<br />
stakeholders in the sectors of environment, transport,<br />
tourism and regional policy at destinations is a precondition<br />
for attaining improved products and problem solutions.<br />
Recommendations to the transport sector:<br />
• Guarantee the provision and funding of public transport<br />
in the regions for both the local population and for tourists,<br />
• guarantee easy accessibility of tourism destinations by<br />
public transport (railway, bus and ship) in all seasons,<br />
• upgrade and extend cross-border passenger transport<br />
through direct connections (railway – also considering<br />
the options offered by the liberalisation foreseen in the<br />
Third Railway Package – and bus) to scheduled transport,<br />
including attractive special package offers combining<br />
public transport with cycling,<br />
• create consumer-friendly products and integrated tariffsystems,<br />
including all means of public transport, to give<br />
better access to the entire environmentally friendly transport<br />
system,<br />
• create consumer-friendly logistic chains for smoother intermodal<br />
travel to and from destinations (including provisions<br />
for luggage transport),<br />
• eliminate consumer-unfriendly institutional and technical<br />
barriers to cross-border rail and bus passenger transport,<br />
• promote increased use of new transport technologies,<br />
such as efficient alternative propulsion, eco-friendly fuels<br />
and vehicle technologies, and<br />
• use new information and communication technologies in<br />
public transport for optimum customer information, with<br />
a view to stimulating demand.<br />
Recommendations to the tourism industry:<br />
• Enhance integration and consider environmentally friendly<br />
mobility solutions when designing tourism products,<br />
• integrate environmentally friendly mobility into existing<br />
product labels – ecolabels,<br />
• develop attractive offerings and enhance implementation<br />
of measures with a view to extending the length of stay<br />
– thus counter-acting current trends and increasing yearround-tourism<br />
as far as possible,<br />
• promote initiatives that raise awareness of sustainable<br />
tourism and sustainable mobility, and<br />
• consider soft mobility as a USP (Unique Selling Proposition)<br />
in the marketing of tourism products.<br />
148
Report on the State of the <strong>Alps</strong><br />
Recommendations to destinations:<br />
• Develop strategies for regional sustainable development<br />
(e.g. Local Agenda 21) and sustainable tourism as well<br />
as measures for their implementation,<br />
• develop an easy-to-apply system for monitoring the<br />
status quo and the ongoing process of sustainable<br />
development,<br />
• conduct research designed to improve socio-economic<br />
market surveys with a view to developing target-groupspecific<br />
tourism products,<br />
• integrate ecological requirements and criteria of sustainable<br />
tourism as well as the promotion of environmentally<br />
friendly transport modes in the regions and in the origin/destination<br />
transport chain into the tourism and travel<br />
concepts, policies and marketing strategies of all destinations,<br />
• develop and promote cooperation between destinations<br />
specially dedicated to sustainable development with a<br />
focus on soft mobility and sustainable lifestyle values,<br />
such as the Alpine Pearls initiative,<br />
• manage mobility for destinations (e.g. traffic-calming and<br />
car-free zones, local demand-oriented public transport<br />
systems as well as human-powered mobility),<br />
• establish an origin/destination service chain and create<br />
special products, taking into account car-free travel to<br />
and car-free stays at resorts,<br />
• sensitise visitors and create incentives for the increased<br />
use of public transport,<br />
• create strategic partnerships between tourism industry<br />
and transport enterprises, tourism destinations and places<br />
of origin, with a view to jointly launching attractive,<br />
environmentally friendly products, which give tourists a<br />
door-to-door mobility guarantee, and<br />
• take account of soft-mobility issues in tourism marketing<br />
and in the marketing of destinations (quality of travel experience,<br />
event-character or advantages of soft mobility<br />
ect).<br />
Recommendations to policy-makers and the administration:<br />
• Take into account the principle of fair pricing in transport<br />
and internalise external costs as a contribution to<br />
fair competition between the different transport modes<br />
(road, rail, aviation),<br />
• set up a framework for enhancing the harmonisation<br />
and integration (e.g. technical standards, cross-border<br />
licences, user-friendly equipment and guiding systems,<br />
…) of European public transport, in particular for railway<br />
systems, with a view to improving cross-border railway<br />
connections,<br />
• promote efforts with the objective of a Europe-wide, coordinated<br />
staggering of holiday periods,<br />
• gain reliable data on travel behaviour through appropriate<br />
amendment of tourism statistics,<br />
• consider environmentally friendly mobility in the forthcoming<br />
“Agenda 21 for European Tourism”,<br />
• support environmentally friendly mobility management in<br />
tourism and leisure, to promote the use of environmentally<br />
sound vehicle technologies and fuels, particularly<br />
fuels derived from renewable energies (e.g. bio fuels<br />
and biogas) and further tighten the emission standards<br />
for vehicles powered by combustion engines (e.g. EURO<br />
5, 6),<br />
• create an appropriate instrument which enables the limitation<br />
of greenhouse gas emissions from air transport<br />
within the EU and between EU and third countries, taking<br />
into account the conclusions of the Environment Council<br />
of 02/12/2005; further enforce, at the international level<br />
the integration of climate-damaging emissions of international<br />
aviation into the Kyoto-Protocol,<br />
• promote innovative, application-oriented projects for the<br />
implementation of environmentally friendly transport concepts<br />
for leisure and tourism as well as targeted cooperation<br />
between the environment, transport and tourism<br />
sectors under the programmes of the Structural Funds<br />
(Interreg, Urban, Leader, Equal) and under national development<br />
programmes,<br />
• increase investment into research and development of innovative<br />
transport technologies under the 7th European<br />
Union Framework Programme for Research and Development,<br />
as well as into national research programmes,<br />
in order to pave the way for innovations and to realise<br />
an integrated, more environmentally friendly and more<br />
intelligent Europe-wide transport system,<br />
• develop and promote an award and a labelling system<br />
for destinations that is oriented towards sustainable development,<br />
including soft mobility and lifestyle values,<br />
such as the Alpine Pearls initiative, and examine the options<br />
of Europe-wide application,<br />
• promote existing labels for the successful placement of<br />
destinations on the tourism market and integrate criteria<br />
of sustainable tourism into the day-to-day business of<br />
successfully positioned destinations. Support the regular<br />
monitoring of destination branding and labelling and create<br />
the required databases, and<br />
• integrate sustainable tourism and soft mobility issues<br />
into all forms of tourism-related education and life-long<br />
learning initiatives.<br />
Recommendations to destinations facing special<br />
challenges<br />
• Many European countries, in particular the new member<br />
states and candidate countries as well as the South-East<br />
European and Balkan countries, still have untouched<br />
and ecologically sensitive areas which could provide a<br />
good starting point for the development of sustainable<br />
tourism.<br />
• Effective solutions in ecologically sensitive areas require<br />
cross-sectoral approaches.<br />
• In destinations facing special challenges the external<br />
costs of environmental impacts should be considered in<br />
pricing (e.g. surcharges), in order to allow cross-funding<br />
of sustainable mobility in these areas.<br />
149
Report on the State of the <strong>Alps</strong><br />
• National and European funding instruments, such as the<br />
Structural Funds, should focus on the requirements of<br />
destinations facing special challenges and include soft<br />
mobility measures as well as support cross-border and<br />
transnational activities.<br />
• The special challenges posed by the sensitivity of these<br />
areas should be communicated to tourists and to the<br />
local population in order to raise acceptance of specific<br />
protective measures.<br />
Mountains:<br />
• Due to the fact that environmental impacts are enhanced<br />
by the special topography, the climate conditions and the<br />
restricted living space, specific measures are required,<br />
particularly in transport. As measures at the destination<br />
alone may not be sufficient to reduce the environmental<br />
impact of transport, sustainable transport has to be promoted<br />
also in the source countries.<br />
• Instruments such as the Alpine Convention and the Carpathian<br />
Convention have already highlighted the specific<br />
needs and proposed measures for sustainable development.<br />
The pertinent implementation procedures could<br />
serve as a model at international and global level. <strong>How</strong>ever,<br />
each mountain region must work out its own type of<br />
political contract based on the prevailing conditions and<br />
making a special allowance for an integrated approach<br />
to transport/tourism.<br />
• Signing and ratification of the Transport Protocol of the<br />
Alpine Convention and subsequent increased efforts to<br />
ensure its implementation by the European Community<br />
and its Member States.<br />
• of their residents should be promoted in order to enforce<br />
sustainable leisure mobility.<br />
Coastal areas:<br />
• Induce a modal shift to coastal shipping, especially in<br />
areas with land use constraints and conflicts.<br />
• Promote and increase the use of cleaner fuels for vessels<br />
as well as alternative propulsion and renewal of<br />
fleets.<br />
• Adapt land use planning in coastal areas in order to protect<br />
these zones and prevent new heavy infrastructure.<br />
The participants in the European Expert Conference, “Environmentally<br />
Friendly Travelling in Europe – Challenges and<br />
Innovations Facing Environment, Transport and Tourism”.<br />
Vienna, January 2006<br />
Wetlands:<br />
• Since rivers and lakes divide as well as connect countries,<br />
a cross-country approach is called for.<br />
• As the shores of rivers and lakes are usually flat areas,<br />
they have good potential for cycling; therefore package<br />
tours combining cycling with public transport (bus, rail,<br />
ship) should be promoted.<br />
• Rivers and lakes need also to be considered as waterways.<br />
Therefore environmentally sustainable solutions<br />
for inland shipping and leisure and sport boating should<br />
be implemented, including the use of cleaner fuels and<br />
the renewal of the boat fleets as well as traffic restrictions<br />
in sensitive sections of lakes and rivers.<br />
Urban areas:<br />
• Leisure and tourism transport should be considered in<br />
the EU thematic strategy on urban environment and in<br />
its implementation.<br />
• The EU thematic strategy on urban environment and its<br />
implementation should take into account the interaction<br />
between urban areas and their hinterland, focusing on<br />
leisure traffic flows of residents to recreation areas and<br />
the requirements for an environmentally sustainable<br />
origin/destination transport chain. Cooperation between<br />
urban areas and the recreation areas.<br />
150
Report on the State of the <strong>Alps</strong><br />
Annex: List of the indicators<br />
Data for the following Indicators were requested from the<br />
Contracting Parties of the Alpine Convention. Not all data<br />
were available and not all data have been used.<br />
B1-1 Population<br />
B1-3 Var Age structure classes<br />
B1-4 Natural growth rate of the population<br />
B1-5 Balance of migration (immigration minus<br />
emigration)<br />
B1-6 Persons with a university degree (or/and doctorate<br />
degree, bachelor’s degree, master’s degree)<br />
B2-1 Gross domestic product<br />
B2-5 Unemployment rate<br />
B3-3 Age of Employees in Agriculture<br />
B3-4 Number of full time farms owned by natural<br />
persons<br />
B3-4.1<br />
B3-4.2<br />
Number of farms subdivided in classes according<br />
to the cultivated area<br />
Number of farms subdivided to types (full-time,<br />
part-time)<br />
B3-5 Cultivated land<br />
B3-5 Cultivated land above 1.500m<br />
B3-10 Farms with agrotourism<br />
B4-1 Forest area<br />
B6-1 Settlement and traffic area<br />
B7-3 Network load due to cars and trucks at automatic<br />
traffic meters (AVZ) in the Alpine region<br />
B7-4 Passengers conveyed by train<br />
B7-5 Passengers conveyed by regional bus<br />
B7-6 Number of municipalities with regular or ondemand<br />
services<br />
B7-8 Number of commuters in a municipality<br />
B7-8.1<br />
B7-8.2<br />
Number of commuters inflowing a municipality<br />
Number of commuters outflowing a municipality<br />
B7-9 Modal split – case studies<br />
B7-9.1<br />
B7-9.2<br />
Modal split – case studies LAU-2 municipalities<br />
Modal split – case studies NUTS-2 regions<br />
B8-1 Number of guest beds in hotel and para-hotel<br />
sectors per inhabitant<br />
B8-1.1<br />
Number of tourist beds per inhabitant summer<br />
season<br />
B8-1.2<br />
B8-1.3<br />
Number of tourist beds per inhabitant winter<br />
season<br />
Number of tourist beds per inhabitant annual<br />
average<br />
B8-2 Proportion of guest beds in second homes<br />
B8-2 Var Bed-places in second homes<br />
B8-3 Seasonal overnight stays in the hotel and parahotel<br />
sectors per inhabitant<br />
B8-3.1<br />
B8-3.2<br />
B8-3.3<br />
Number of tourist nights per inhabitant summer<br />
season<br />
Number of tourist nights per inhabitant winter<br />
season<br />
Number of tourist nights per inhabitant annual<br />
data<br />
B8-4 Seasonal arrivals in the hotel and para-hotel<br />
sectors per inhabitant<br />
B8-4.1<br />
B8-4.2<br />
B8-4.3<br />
Number of tourist arrivals per inhabitant summer<br />
season<br />
Number of tourist arrivals per inhabitant winter<br />
season<br />
Tourist arrivals annual data<br />
B8-5 Number of all ski lifts (diversified by type)<br />
B8-6 Transport performance of all ski lifts<br />
B8-9 Capacity of overnight stays of accommodation<br />
divided by category<br />
Air quality measuring stations:<br />
C1-10 NO 2<br />
immission<br />
C1-10Var<br />
NOx immission<br />
C1-15 Ozone peak exposure<br />
C1-16 Time of ozone exposure<br />
C1-17 PM10 concentration<br />
Air quality monitoring sites PM10:<br />
C1-18 PM10 concentration exceedance<br />
C8-2 Percentage of priority biotopes<br />
C9-1 Emissions of road traffic noise<br />
C9-1.1<br />
C9-1.2<br />
Noise emission by railways<br />
Noise emission by airports<br />
C9-2 Noise immissions based on LUCAS field data<br />
C9-3 Expenditure on noise abatement measures<br />
along main thoroughfares<br />
A questionnaire about the status quo (February 2006) regarding<br />
the Directive on Environmental Noise 2002/49/EC and<br />
expenses for measures of noise protection at high ranked<br />
roads, railways and airports.<br />
151
www.alpconv.org