English - Alps Know-How - Cipra
English - Alps Know-How - Cipra
English - Alps Know-How - Cipra

You also want an ePaper? Increase the reach of your titles
YUMPU automatically turns print PDFs into web optimized ePapers that Google loves.
Chapter A – The Alpine Transport System<br />
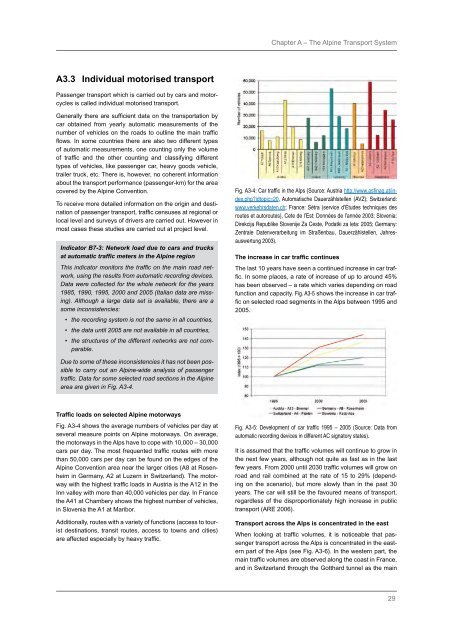
A3.3 Individual motorised transport<br />
Passenger transport which is carried out by cars and motorcycles<br />
is called individual motorised transport.<br />
Generally there are sufficient data on the transportation by<br />
car obtained from yearly automatic measurements of the<br />
number of vehicles on the roads to outline the main traffic<br />
flows. In some countries there are also two different types<br />
of automatic measurements, one counting only the volume<br />
of traffic and the other counting and classifying different<br />
types of vehicles, like passenger car, heavy goods vehicle,<br />
trailer truck, etc. There is, however, no coherent information<br />
about the transport performance (passenger-km) for the area<br />
covered by the Alpine Convention.<br />
To receive more detailed information on the origin and destination<br />
of passenger transport, traffic censuses at regional or<br />
local level and surveys of drivers are carried out. <strong>How</strong>ever in<br />
most cases these studies are carried out at project level.<br />
Indicator B7-3: Network load due to cars and trucks<br />
at automatic traffic meters in the Alpine region<br />
This indicator monitors the traffic on the main road network,<br />
using the results from automatic recording devices.<br />
Data were collected for the whole network for the years<br />
1985, 1990, 1995, 2000 and 2005 (Italian data are missing).<br />
Although a large data set is available, there are a<br />
some inconsistencies:<br />
• the recording system is not the same in all countries,<br />
• the data until 2005 are not available in all countries,<br />
• the structures of the different networks are not comparable.<br />
Fig. A3‐4: Car traffic in the <strong>Alps</strong> (Source: Austria http://www.asfinag.at/index.php?idtopic=20,<br />
Automatische Dauerzählstellen (AVZ); Switzerland:<br />
www.verkehrsdaten.ch; France: Sétra (service d’Études techniques des<br />
routes et autoroutes), Cete de l’Est: Données de l’année 2003; Slovenia:<br />
Direkcija Republike Slovenije Za Ceste, Podatki za leta: 2005; Germany:<br />
Zentrale Datenverarbeitung im Straßenbau, Dauerzählstellen, Jahresauswertung<br />
2003).<br />
The increase in car traffic continues<br />
The last 10 years have seen a continued increase in car traffic.<br />
In some places, a rate of increase of up to around 45%<br />
has been observed – a rate which varies depending on road<br />
function and capacity. Fig. A3‐5 shows the increase in car traffic<br />
on selected road segments in the <strong>Alps</strong> between 1995 and<br />
2005.<br />
Due to some of these inconsistencies it has not been possible<br />
to carry out an Alpine-wide analysis of passenger<br />
traffic. Data for some selected road sections in the Alpine<br />
area are given in Fig. A3‐4.<br />
Traffic loads on selected Alpine motorways<br />
Fig. A3‐4 shows the average numbers of vehicles per day at<br />
several measure points on Alpine motorways. On average,<br />
the motorways in the <strong>Alps</strong> have to cope with 10,000 – 30,000<br />
cars per day. The most frequented traffic routes with more<br />
than 50,000 cars per day can be found on the edges of the<br />
Alpine Convention area near the larger cities (A8 at Rosenheim<br />
in Germany, A2 at Luzern in Switzerland). The motorway<br />
with the highest traffic loads in Austria is the A12 in the<br />
Inn valley with more than 40,000 vehicles per day. In France<br />
the A41 at Chambery shows the highest number of vehicles,<br />
in Slovenia the A1 at Maribor.<br />
Additionally, routes with a variety of functions (access to tourist<br />
destinations, transit routes, access to towns and cities)<br />
are affected especially by heavy traffic.<br />
Fig. A3‐5: Development of car traffic 1995 – 2005 (Source: Data from<br />
automatic recording devices in different AC signatory states).<br />
It is assumed that the traffic volumes will continue to grow in<br />
the next few years, although not quite as fast as in the last<br />
few years. From 2000 until 2030 traffic volumes will grow on<br />
road and rail combined at the rate of 15 to 29% (depending<br />
on the scenario), but more slowly than in the past 30<br />
years. The car will still be the favoured means of transport,<br />
regardless of the disproportionately high increase in public<br />
transport (ARE 2006).<br />
Transport across the <strong>Alps</strong> is concentrated in the east<br />
When looking at traffic volumes, it is noticeable that passenger<br />
transport across the <strong>Alps</strong> is concentrated in the eastern<br />
part of the <strong>Alps</strong> (see Fig. A3‐6). In the western part, the<br />
main traffic volumes are observed along the coast in France,<br />
and in Switzerland through the Gotthard tunnel as the main<br />
29