English - Alps Know-How - Cipra
English - Alps Know-How - Cipra
English - Alps Know-How - Cipra

Create successful ePaper yourself
Turn your PDF publications into a flip-book with our unique Google optimized e-Paper software.
Chapter C – Effects of Transport and Mobility in the <strong>Alps</strong><br />
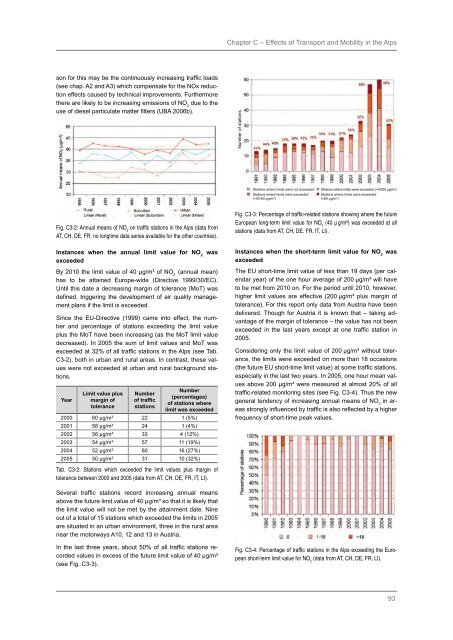
son for this may be the continuously increasing traffic loads<br />
(see chap. A2 and A3) which compensate for the NOx reduction<br />
effects caused by technical improvements. Furthermore<br />
there are likely to be increasing emissions of NO 2<br />
due to the<br />
use of diesel particulate matter filters (UBA 2006b).<br />
Number of stations<br />
Stations where limits were not exceeded<br />
Stations where limits were exceeded<br />
(>50-60 µg/m 3 )<br />
Stations where limits were exceeded (>40/50 µg/m 3 )<br />
Stations where limits were exceeded<br />
(>60 µg/m 3 )<br />
Fig. C3‐2: Annual means of NO 2<br />
on traffic stations in the <strong>Alps</strong> (data from<br />
AT, CH, DE, FR, no longtime data series available for the other countries).<br />
Instances when the annual limit value for NO 2<br />
was<br />
exceeded<br />
By 2010 the limit value of 40 µg/m³ of NO 2<br />
(annual mean)<br />
has to be attained Europe-wide (Directive 1999/30/EC).<br />
Until this date a decreasing margin of tolerance (MoT) was<br />
defined, triggering the development of air quality management<br />
plans if the limit is exceeded.<br />
Since the EU-Directive (1999) came into effect, the number<br />
and percentage of stations exceeding the limit value<br />
plus the MoT have been increasing (as the MoT limit value<br />
decreased). In 2005 the sum of limit values and MoT was<br />
exceeded at 32% of all traffic stations in the <strong>Alps</strong> (see Tab.<br />
C3‐2), both in urban and rural areas. In contrast, these values<br />
were not exceeded at urban and rural background stations.<br />
Year<br />
Limit value plus<br />
margin of<br />
tolerance<br />
Number<br />
of traffic<br />
stations<br />
Number<br />
(percentages)<br />
of stations where<br />
limit was exceeded<br />
2000 60 µg/m³ 22 1 (5%)<br />
2001 58 µg/m³ 24 1 (4%)<br />
2002 56 µg/m³ 33 4 (12%)<br />
2003 54 µg/m³ 57 11 (19%)<br />
2004 52 µg/m³ 60 16 (27%)<br />
2005 50 µg/m³ 31 10 (32%)<br />
Tab. C3‐2: Stations which exceeded the limit values plus margin of<br />
tolerance between 2000 and 2005 (data from AT, CH, DE, FR, IT, LI).<br />
Fig. C3‐3: Percentage of traffic-related stations showing where the future<br />
European long-term limit value for NO 2<br />
(40 µg/m³) was exceeded at all<br />
stations (data from AT, CH, DE, FR, IT, LI).<br />
Instances when the short-term limit value for NO 2<br />
was<br />
exceeded<br />
The EU short-time limit value of less than 19 days (per calendar<br />
year) of the one hour average of 200 µg/m³ will have<br />
to be met from 2010 on. For the period until 2010, however,<br />
higher limit values are effective (200 µg/m³ plus margin of<br />
tolerance). For this report only data from Austria have been<br />
delivered. Though for Austria it is known that – taking advantage<br />
of the margin of tolerance – the value has not been<br />
exceeded in the last years except at one traffic station in<br />
2005.<br />
Considering only the limit value of 200 µg/m³ without tolerance,<br />
the limits were exceeded on more than 18 occasions<br />
(the future EU short-time limit value) at some traffic stations,<br />
especially in the last two years. In 2005, one hour mean values<br />
above 200 µg/m³ were measured at almost 20% of all<br />
traffic-related monitoring sites (see Fig. C3‐4). Thus the new<br />
general tendency of increasing annual means of NO 2<br />
in areas<br />
strongly influenced by traffic is also reflected by a higher<br />
frequency of short-time peak values.<br />
Several traffic stations record increasing annual means<br />
above the future limit value of 40 µg/m³ so that it is likely that<br />
the limit value will not be met by the attainment date. Nine<br />
out of a total of 15 stations which exceeded the limits in 2005<br />
are situated in an urban environment, three in the rural area<br />
near the motorways A10, 12 and 13 in Austria.<br />
In the last three years, about 50% of all traffic stations recorded<br />
values in excess of the future limit value of 40 µg/m³<br />
(see Fig. C3‐3).<br />
Fig. C3‐4: Percentage of traffic stations in the <strong>Alps</strong> exceeding the European<br />
short-term limit value for NO 2<br />
(data from AT, CH, DE, FR, LI).<br />
93