ÐÑой 4/2010 - СÑопанÑки ÑакÑлÑÐµÑ - Югозападен ÑнивеÑÑиÑеÑ
ÐÑой 4/2010 - СÑопанÑки ÑакÑлÑÐµÑ - Югозападен ÑнивеÑÑиÑеÑ
ÐÑой 4/2010 - СÑопанÑки ÑакÑлÑÐµÑ - Югозападен ÑнивеÑÑиÑеÑ

Create successful ePaper yourself
Turn your PDF publications into a flip-book with our unique Google optimized e-Paper software.
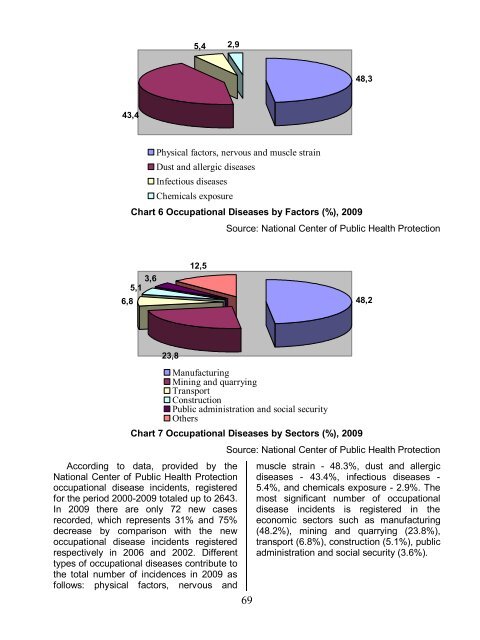
5,4 2,9<br />
48,3<br />
43,4<br />
Physical factors, nervous and muscle strain<br />
Dust and allergic diseases<br />
Infectious diseases<br />
Chemicals exposure<br />
Chart 6 Occupational Diseases by Factors (%), 2009<br />
Source: National Center of Public Health Protection<br />
6,8<br />
3,6<br />
5,1<br />
12,5<br />
48,2<br />
23,8<br />
Manufacturing<br />
Mining and quarrying<br />
Transport<br />
Construction<br />
Public administration and social security<br />
Others<br />
Chart 7 Occupational Diseases by Sectors (%), 2009<br />
According to data, provided by the<br />
National Center of Public Health Protection<br />
occupational disease incidents, registered<br />
for the period 2000-2009 totaled up to 2643.<br />
In 2009 there are only 72 new cases<br />
recorded, which represents 31% and 75%<br />
decrease by comparison with the new<br />
occupational disease incidents registered<br />
respectively in 2006 and 2002. Different<br />
types of occupational diseases contribute to<br />
the total number of incidences in 2009 as<br />
follows: physical factors, nervous and<br />
Source: National Center of Public Health Protection<br />
69<br />
muscle strain - 48.3%, dust and allergic<br />
diseases - 43.4%, infectious diseases -<br />
5.4%, and chemicals exposure - 2.9%. The<br />
most significant number of occupational<br />
disease incidents is registered in the<br />
economic sectors such as manufacturing<br />
(48.2%), mining and quarrying (23.8%),<br />
transport (6.8%), construction (5.1%), public<br />
administration and social security (3.6%).