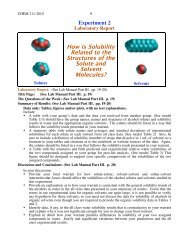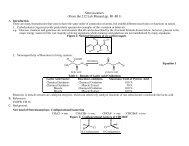
Organic Chemistry Semester 1 LABORATORY MANUAL - Moravian ...
Organic Chemistry Semester 1 LABORATORY MANUAL - Moravian ...
Organic Chemistry Semester 1 LABORATORY MANUAL - Moravian ...

You also want an ePaper? Increase the reach of your titles
YUMPU automatically turns print PDFs into web optimized ePapers that Google loves.
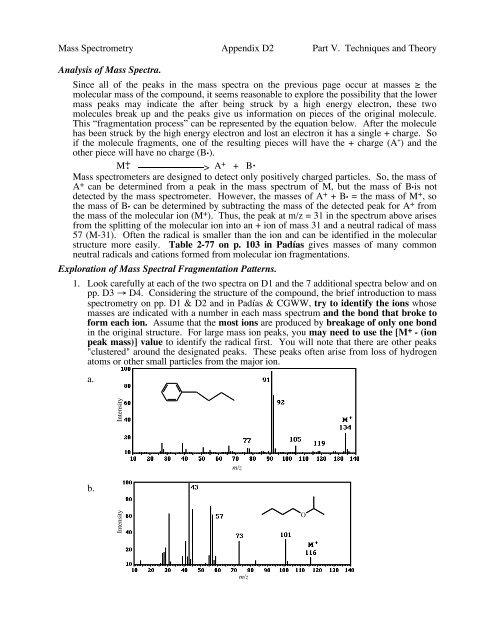
Mass Spectrometry Appendix D2 Part V. Techniques and Theory<br />
Analysis of Mass Spectra.<br />
Since all of the peaks in the mass spectra on the previous page occur at masses ≥ the<br />
molecular mass of the compound, it seems reasonable to explore the possibility that the lower<br />
mass peaks may indicate the after being struck by a high energy electron, these two<br />
molecules break up and the peaks give us information on pieces of the original molecule.<br />
This “fragmentation process” can be represented by the equation below. After the molecule<br />
has been struck by the high energy electron and lost an electron it has a single + charge. So<br />
if the molecule fragments, one of the resulting pieces will have the + charge (A + ) and the<br />
other piece will have no charge (B.).<br />
M + . > A + + B.<br />
Mass spectrometers are designed to detect only positively charged particles. So, the mass of<br />
A + can be determined from a peak in the mass spectrum of M, but the mass of B.is not<br />
detected by the mass spectrometer. However, the masses of A + + B. = the mass of M + , so<br />
the mass of B. can be determined by subtracting the mass of the detected peak for A + from<br />
the mass of the molecular ion (M + ). Thus, the peak at m/z = 31 in the spectrum above arises<br />
from the splitting of the molecular ion into an + ion of mass 31 and a neutral radical of mass<br />
57 (M-31). Often the radical is smaller than the ion and can be identified in the molecular<br />
structure more easily. Table 2-77 on p. 103 in Padías gives masses of many common<br />
neutral radicals and cations formed from molecular ion fragmentations.<br />
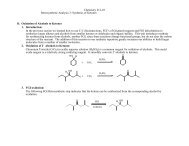
Exploration of Mass Spectral Fragmentation Patterns.<br />
1. Look carefully at each of the two spectra on D1 and the 7 additional spectra below and on<br />
pp. D3 → D4. Considering the structure of the compound, the brief introduction to mass<br />
spectrometry on pp. D1 & D2 and in Padías & CGWW, try to identify the ions whose<br />
masses are indicated with a number in each mass spectrum and the bond that broke to<br />
form each ion. Assume that the most ions are produced by breakage of only one bond<br />
in the original structure. For large mass ion peaks, you may need to use the [M + - (ion<br />
peak mass)] value to identify the radical first. You will note that there are other peaks<br />
"clustered" around the designated peaks. These peaks often arise from loss of hydrogen<br />
atoms or other small particles from the major ion.<br />
a.<br />
Intensity<br />
b.<br />
m/z<br />
Intensity<br />
O<br />
m/z